Implementing the ACA: Medicaid Spending & Enrollment Growth for FY 2014 and FY 2015
Appendix: Background on Medicaid Financing
Medicaid Financing Structure
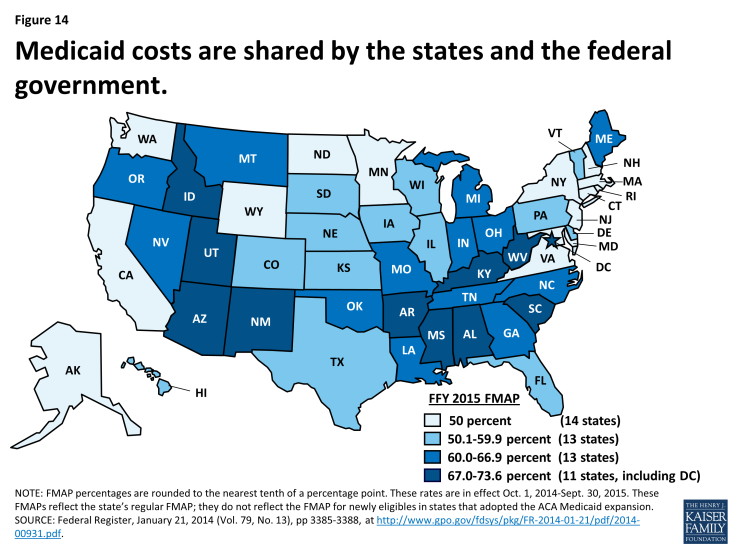
The Medicaid program is jointly funded by states and the federal government. The federal government guarantees match funds to states for qualifying Medicaid expenditures (payments states make for covered Medicaid services provided by qualified providers to eligible Medicaid enrollees.) The federal match rate (Federal Medical Assistance Percentage or FMAP) is calculated annually for each state using a formula set in the Social Security Act which is based on a state’s average personal income relative to the national average; poorer states have higher FMAPs. Personal income data are lagged, so data used for FFY 2015 FMAPs are from the three years of 2010 to 2012. According to the formula, the FMAP in FFY 2015 varies across states from a floor of 50 percent to a high of 73.6 percent. (Figure 14) This means every $1 of state spending on Medicaid is matched with at least $1 of federal funds.1
Medicaid’s Role in State Budgets
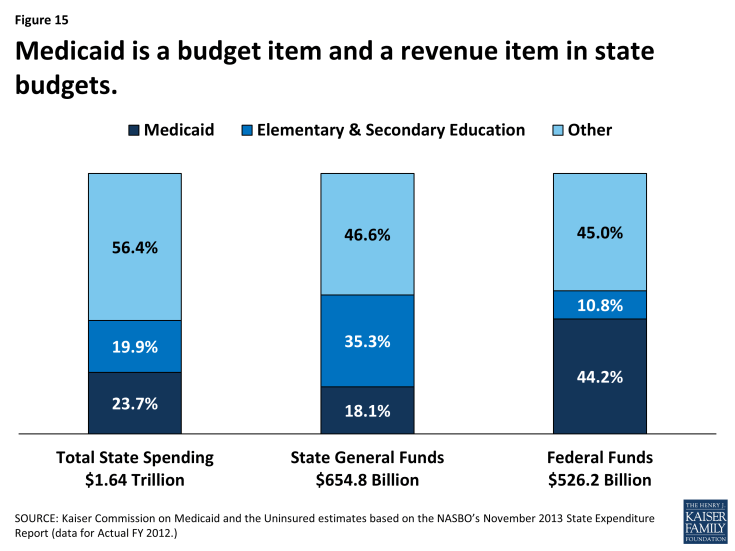
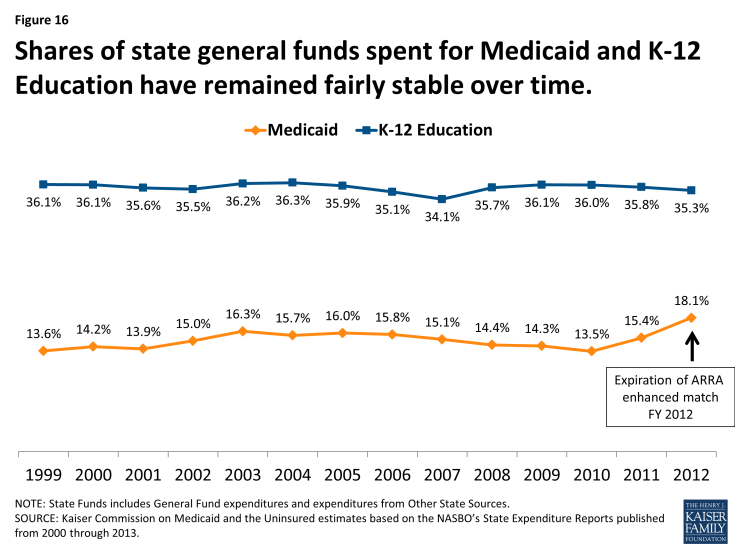
Medicaid has a unique role in state budgets because it is both an expenditure item and a source of federal revenue for states. In FY 2012, Medicaid accounted for 23.7 percent of total spending, but only 18.1 percent of all state general fund spending, a far second to spending on K-12 education (35.3 percent of state general fund spending.)2 Due to the federal match structure for Medicaid, the program is the largest source of federal funds for states, accounting 44.2 percent of all federal funds for states in FY 2012. Over the last decade, shares of general fund spending for Medicaid and K-12 education have remained fairly constant with an uptick in the share of general fund spending on Medicaid since 2010 in part due to the June 2011 expiration of the enhanced FMAP provided by under the American Recovery and Reinvestment Act (ARRA). (Figures 15 and 16)


