Changes in Insurance Coverage in Rural Areas under the ACA: A Focus on Medicaid Expansion States
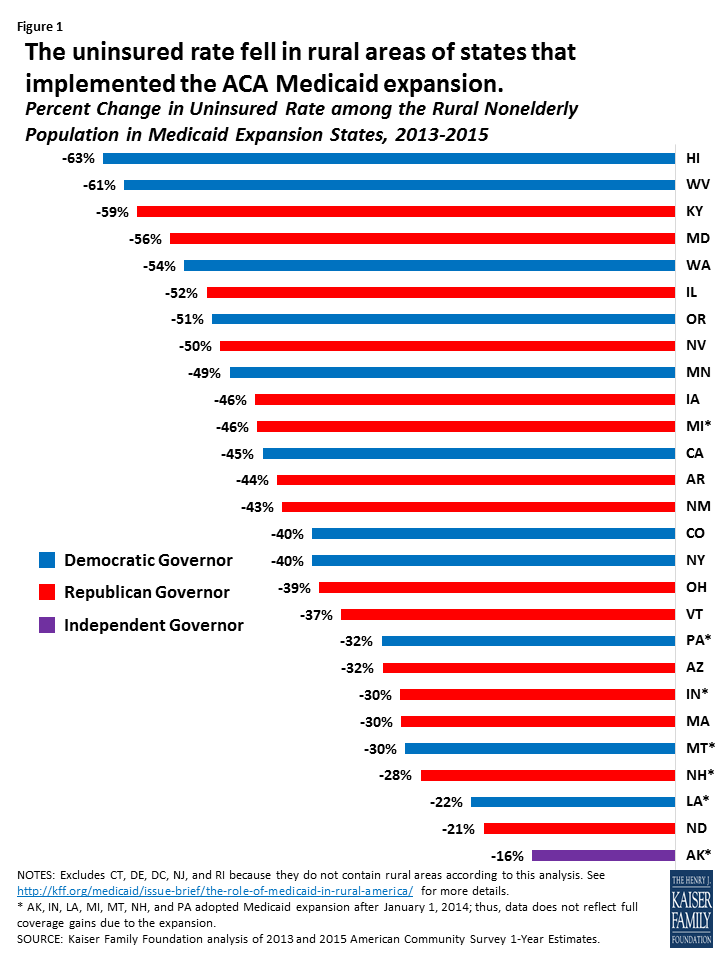
As shown in a recent brief, people in rural areas face particular challenges in health insurance and access, including limited access to employer-sponsored coverage and low incomes. Following implementation of the Affordable Care Act (ACA) Medicaid expansion in 2014, there were increases in insurance coverage for people in states that expanded their programs, including those in rural areas. Nationwide, nearly two million people in rural areas in Medicaid expansion states gained insurance coverage between 2013 and 2015. These coverage gains in rural areas occurred in expansion states across the political spectrum.
| Table 1: Health Coverage among the Rural Nonelderly Population in Medicaid Expansion States, 2013-2015 | ||||
| Expansion State | Rural Uninsured Rate, 2013 | Rural Uninsured Rate, 2015 | Percent Change in Rural Uninsured Rate, 2013-2015 | Change in Number of Rural Uninsured, 2013-2015 |
| Median | 16% | 9% | -44% | -1,900,400 |
| Alaska* | 22% | 19% | -16% | -13,600 |
| Arizona | 22% | 15% | -32% | -68,500 |
| Arkansas | 20% | 11% | -44% | -111,000 |
| California | 21% | 11% | -45% | -111,400 |
| Colorado | 21% | 12% | -40% | -73,000 |
| Hawaii | 13% | 5% | -63% | -17,600 |
| Illinois | 12% | 6% | -52% | -103,800 |
| Indiana* | 16% | 11% | -30% | -85,300 |
| Iowa | 11% | 6% | -46% | -68,700 |
| Kentucky | 19% | 8% | -59% | -202,200 |
| Louisiana* | 20% | 16% | -22% | -61,800 |
| Maryland | 14% | 6% | -56% | -17,400 |
| Massachusetts | 5% | 4% | -30% | -1,200 |
| Michigan* | 15% | 8% | -46% | -125,100 |
| Minnesota | 10% | 5% | -49% | -81,800 |
| Montana* | 20% | 14% | -30% | -48,700 |
| Nevada | 22% | 11% | -50% | -25,100 |
| New Hampshire* | 15% | 11% | -28% | -12,200 |
| New Mexico | 23% | 13% | -43% | -121,400 |
| New York | 11% | 7% | -40% | -81,200 |
| North Dakota | 12% | 9% | -21% | -12,700 |
| Ohio | 14% | 8% | -39% | -106,100 |
| Oregon | 19% | 9% | -51% | -102,500 |
| Pennsylvania* | 13% | 8% | -32% | -52,000 |
| Vermont | 9% | 6% | -37% | -12,700 |
| Washington | 21% | 10% | -54% | -108,800 |
| West Virginia | 17% | 7% | -61% | -74,400 |
| NOTES: Includes nonelderly individuals ages 0-64. Totals may not sum due to rounding. Excludes CT, DE, DC, NJ, and RI because they do not contain rural areas according to this analysis. See https://www.kff.org/medicaid/issue-brief/the-role-of-medicaid-in-rural-america/ for more details. * AK, IN, LA, MI, MT, NH, and PA adopted Medicaid expansion after January 1, 2014; thus, data does not reflect full coverage gains due to the expansion. SOURCE: Kaiser Family Foundation analysis of 2013 and 2015 American Community Survey 1-Year Estimates. |
||||

