Medicaid Enrollment & Spending Growth: FY 2024 & 2025
For a three-year period following the onset of the COVID-19 pandemic, states provided continuous Medicaid enrollment in exchange for an increase in the federal share of Medicaid spending (known as the Federal Medical Assistance Percentage or “FMAP”). This policy resulted in the largest ever number of enrollees in Medicaid, which, along with enhanced subsidies in the Affordable Care Act (ACA) Marketplaces, contributed to the lowest ever uninsured rate. The 2023 Consolidated Appropriations Act (CAA) ended the continuous enrollment provision on March 31, 2023, requiring states to begin the process of “unwinding”, and millions of individuals have been disenrolled from Medicaid since the unwinding began. Most states began unwinding related disenrollments in late state fiscal year (FY) 2023 (which ends June 30 in most states) and completed disenrollments in late FY 2024, though state unwinding timelines vary. The CAA also phased down the enhanced federal matching funds through the end of 2023 (partway through FY 2024 for most states).
Heading into FY 2025, states are expected to wrap up unwinding-related eligibility redeterminations; however, uncertainty remains regarding post-unwinding Medicaid spending and enrollment trends and what the new “normal” will look like. Adding to this uncertainty are the loss of pandemic-related enhanced federal funding, shifts in state fiscal conditions, and the upcoming election, all which can have implications for Medicaid spending trends.
This brief analyzes Medicaid enrollment and spending trends for FY 2024 and FY 2025, based on data provided by state Medicaid directors as part of the 24th annual survey of Medicaid directors. 50 states (including the District of Columbia) responded to the 2024 survey, although response rates for specific questions varied. More information on response rates and methodology can be found at the end of the brief. Nearly all officials indicated that their spending projections reflect what is assumed in their states’ adopted budgets. Key survey findings include the following:
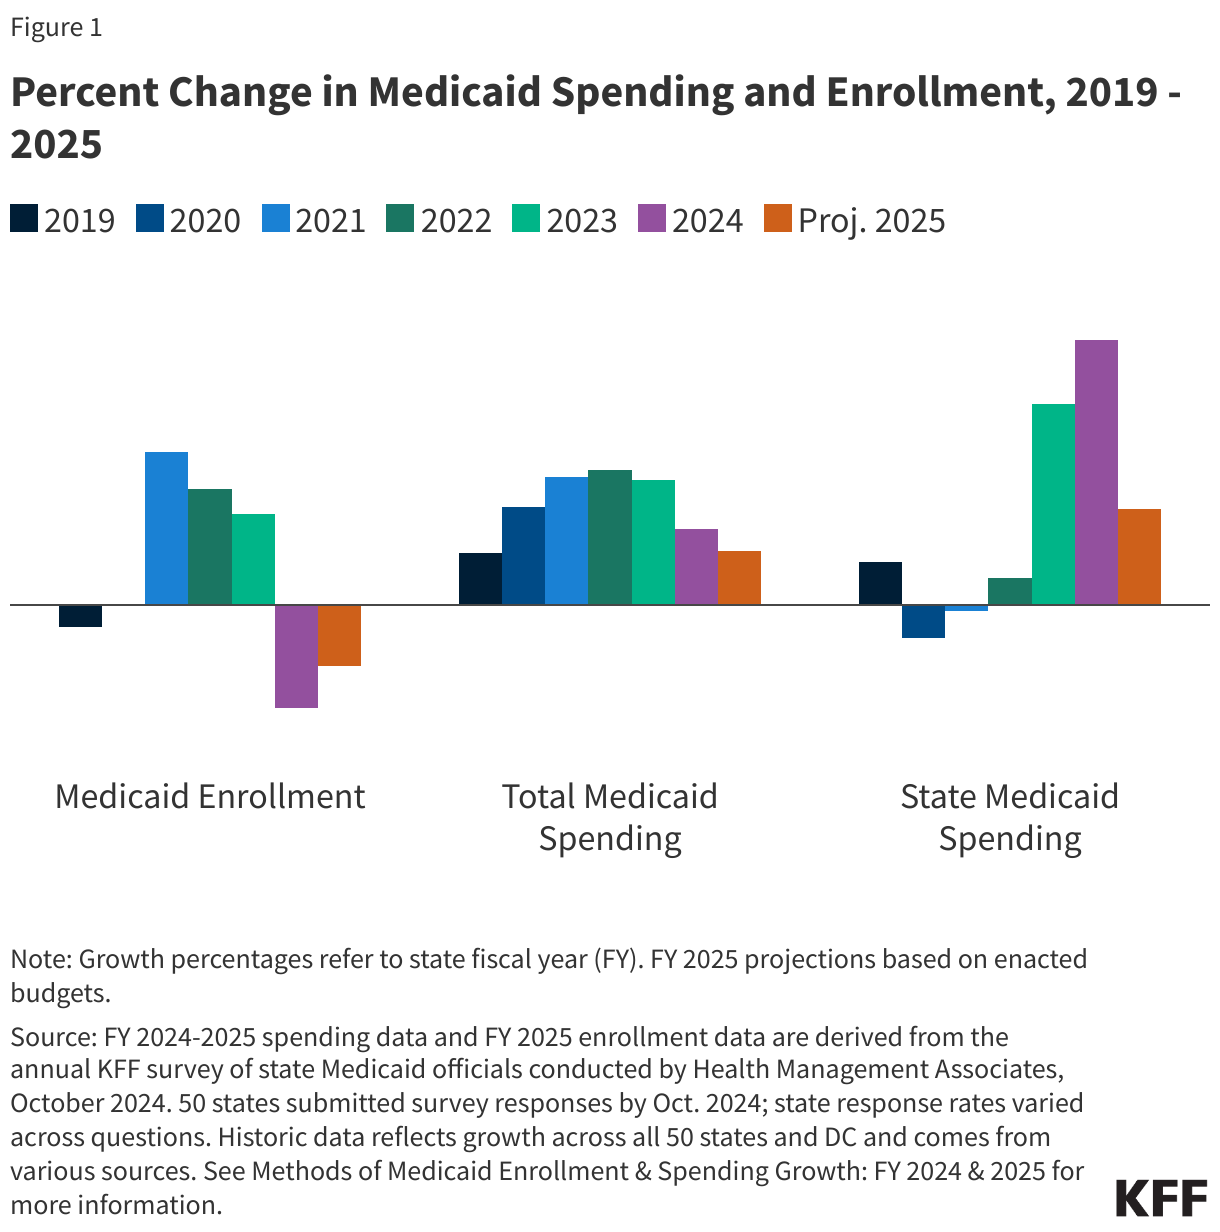
- Following years of significant growth, Medicaid enrollment declined by -7.5% in FY 2024 and state Medicaid officials expect enrollment to continue to decline by -4.4% in FY 2025. These growth rates reflect the net Medicaid enrollment change from year to year including new enrollments, coverage losses due to unwinding, and some “churn” when those who lose coverage re-enroll within a short period of time. The unwinding of the continuous enrollment provision was the largest driver of enrollment declines.
- Total Medicaid spending growth slowed to 5.5% in FY 2024 and is expected to slow further to 3.9% in FY 2025. While state Medicaid officials identified unwinding-related enrollment declines as the most significant factor driving changes in total Medicaid spending, they also noted a number of upward pressures on total spending. This included enrollment increases from eligibility changes such as 12-month continuous eligibility for children or overall state or Medicaid eligible population growth, the higher health care needs of enrollees that retained coverage during unwinding, and rate increases.
- As anticipated, state Medicaid spending growth increased sharply in FY 2024 (19.2%) as the enhanced FMAP phased down and expired (after declining earlier in the pandemic despite high enrollment growth). State Medicaid spending growth is projected to slow to 7.0% in FY 2025, only slightly higher than total spending growth as the shifts caused by the enhanced FMAP expiration end.
Context
Medicaid provides comprehensive health care coverage and long-term services and supports (LTSS) to over one in five people living in the US. Medicaid also represents nearly one in five dollars spent on health care in the U.S. and half of LTSS spending. Medicaid is administered by states within broad federal rules and jointly funded by states and the federal government through a federal matching program with no cap. Medicaid is often central to state fiscal decisions as it is simultaneously a significant spending item as well as the largest source of federal revenues for states. Medicaid is a counter-cyclical program, meaning that more people become eligible and enroll during economic downturns. At the same time, states typically may face declines in revenues that make it difficult to finance the state share of funding for the program. After peaking after the implementation of the ACA in 2014, Medicaid enrollment and total spending growth slowed or declined in the years leading up to the COVID-19 pandemic, due in part to improving economic conditions and restrictions permitted under the Trump Administration.
The economic fall-out from the COVID-19 pandemic, and the ensuing federal and state response, lead to significant increases in Medicaid enrollment and spending. As in past economic downturns, Congress enacted legislation that temporarily increased the federal share of Medicaid spending to help states maintain their Medicaid programs. States received a 6.2 percentage point FMAP increase that generally applied to Medicaid spending that would have otherwise been reimbursed at the state’s regular FMAP. In exchange, states were prohibited from disenrolling people, and as a result Medicaid and Children’s Health Insurance Program (CHIP) enrollment grew from 71 million to 94 million, an increase of 23 million or 32% between February 2020 and April 2023. Total Medicaid spending reached $804 billion in federal fiscal year 2022, with 29% financed by states and 71% paid by the federal government – a somewhat higher federal share than in prior years due to the pandemic-related enhanced FMAP. The CAA ended the continuous enrollment provision on March 31, 2023 and required states to begin the process of “unwinding” (i.e., resume historically typical eligibility redeterminations and disenroll individuals found to be no longer eligible for Medicaid). The CAA also phased down the enhanced federal matching funds from April 2023 through December 2023. Since the unwinding period began, millions of individuals have been disenrolled from Medicaid, but total net Medicaid and CHIP enrollment as of June 2024 remained over 8 million more than enrollment in February 2020, before the pandemic began. Though state unwinding timelines varied, all states except four completed unwinding renewals by August 2024.
State economic conditions worsened rapidly when the pandemic hit but recovered quickly, leading to a period of significant revenue and expenditure growth for states. Early in the pandemic, initial unemployment claims and the unemployment rate spiked and state revenue collections declined but all quickly rebounded. By FY 2021 and FY 2022, most states were seeing record-breaking revenue growth as well as budget surpluses. Favorable state fiscal conditions combined with federal fiscal relief mitigated the need for widespread state spending cuts and allowed states to make investments and expansions, including to Medicaid programs. Given strong revenue growth and budget surpluses, states also adopted some of the largest tax cuts on record. In FY 2023 and FY 2024, however, these tax cuts combined with a weaker stock market performance and changes in inflation and consumer consumption patterns led to flat state revenue growth. Despite slower growth in revenue collections, state general fund spending continued to grow in FY 2024 (due to one-time spending of surplus funds), and some states ended FY 2024 with modest budget surpluses and continued to build rainy day funds.
State fiscal conditions remained stable at the beginning of FY 2025, but the longer term fiscal outlook is less certain. Heading into FY 2025, revenue collections have begun to stabilize and states are returning to more “normal” state budget environments, following multiple years of high revenue and spending growth as well as pandemic-related volatility and unpredictability. States appear to be in a stable fiscal position, though there is variation across states. According to FY 2025 enacted budgets, most states anticipate revenue growth will continue to flatten and expect state general fund spending growth to slow. Reduced revenue collections due in part to earlier tax cuts, the expiration of pandemic-era federal funding, and macroeconomic uncertainties may dampen enthusiasm for further investments in Medicaid seen over the past few years and could even prompt spending reductions. The upcoming election also contributes to a more uncertain state fiscal outlook.
Trends in Enrollment Growth FY 2024 and FY 2025
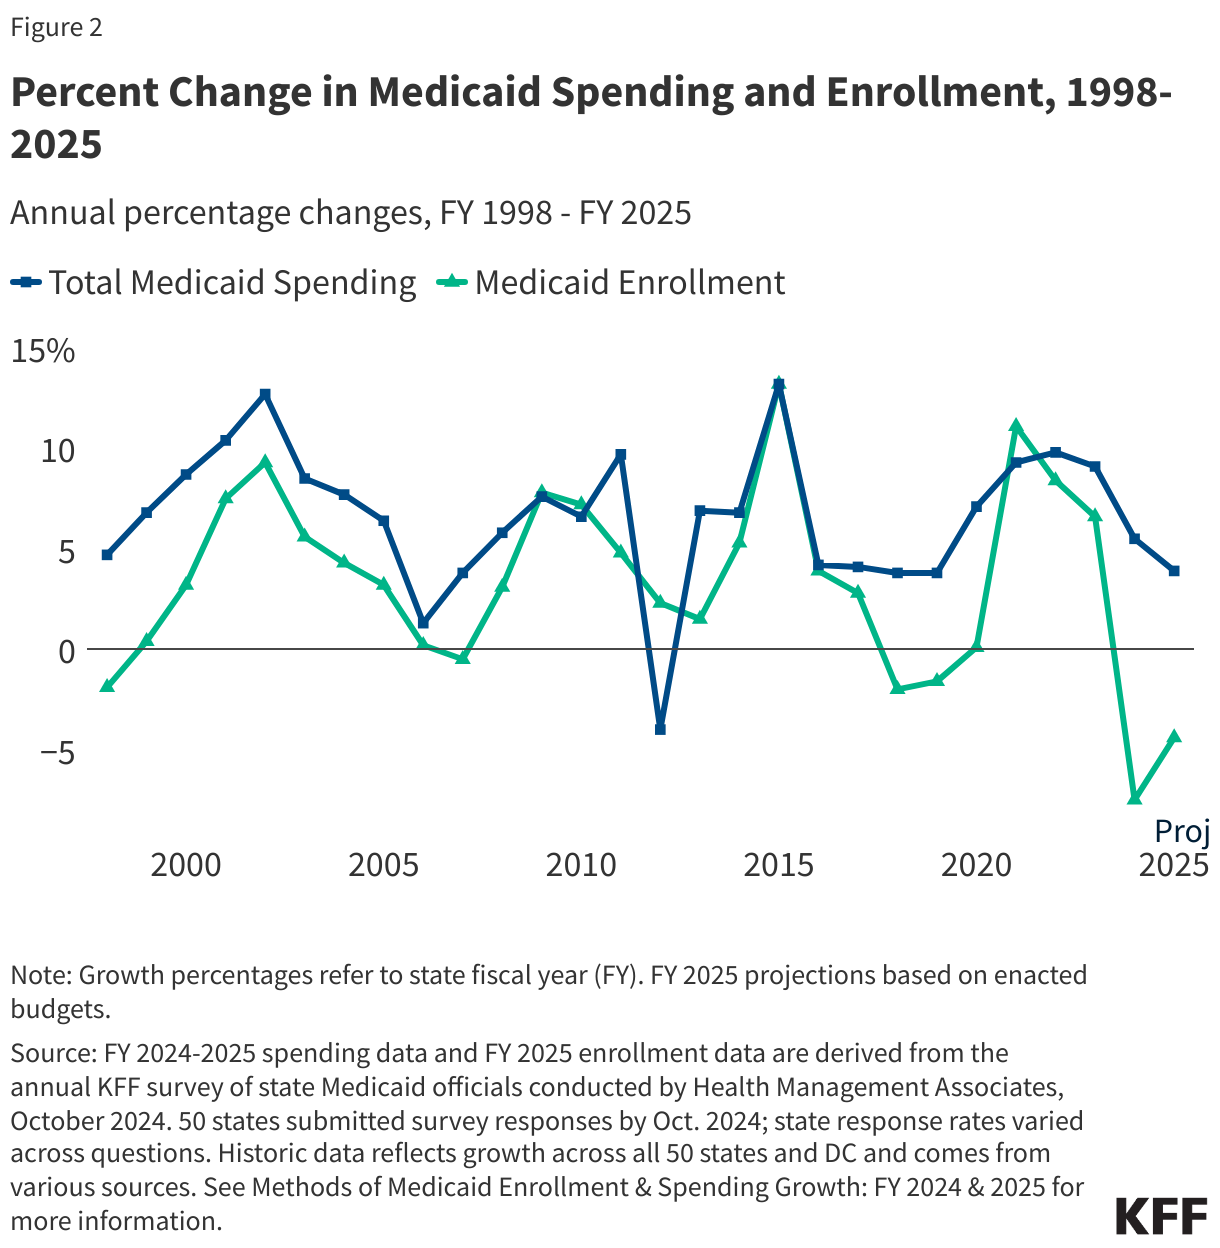
Following years of significant growth, Medicaid enrollment declined by -7.5% in FY 2024 and is expected to continue to decline by -4.4% in FY 2025, primarily due to the unwinding of the continuous enrollment requirement (Figure 2). Following the onset of the COVID-19 pandemic and start of the Medicaid continuous enrollment provision, enrollment rose sharply in FY 2021 and continued to grow, though more slowly, through FY 2023, reaching record highs for the program. When the continuous enrollment provision ended, most states began Medicaid disenrollments in late FY 2023 and finished in FY 2024 (though some states will continue to process renewals in FY 2025). As a result, Medicaid enrollment declined in FY 2024 and is projected to decline again in FY 2025. These growth rates reflect the net Medicaid enrollment change from year to year including new enrollments, coverage losses due to unwinding, and some churn. Additional KFF analysis of data through June 2024 found that net Medicaid enrollment remained above pre-pandemic levels; however, with a few states continuing unwinding renewals into FY 2025, estimates of both enrollment and spending for FY 2025 and beyond remain uncertain and continue to evolve.
As anticipated, the unwinding of the continuous enrollment provision was the largest driver of enrollment declines. Almost all responding states in FY 2024 and over half in FY 2025 reported unwinding and returning to normal renewal operations was the most significant downward pressure on total Medicaid enrollment. A number of state Medicaid agencies also mentioned a strong economy as a downward pressure on Medicaid enrollment in FY 2025 (though a few states noted potential worsening economic conditions in their state as an upward pressure). While Medicaid enrollment is expected to decline in both FY 2024 and FY 2025, about half of responding states in FY 2024 and FY 2025 mentioned eligibility expansions or overall state and Medicaid eligible population growth were putting an upward pressure on enrollment. The most frequently reported change was the new federal requirement that began January 2024 for all states to adopt 12-month continuous eligibility for all Medicaid and CHIP children under age 19. A few states also noted adopting multi-year continuous eligibility for children from birth to age six, an option to extend Medicaid postpartum coverage to 12 months, and changes in eligibility policy for justice-involved populations. A number of states also mentioned eligibility system and operational changes, such as increasing ex parte (or automated) renewal rates and unwinding waiver flexibilities offered by CMS, have mitigated some churn and coverage loss among eligible individuals, resulting in increased enrollment.
Trends in Spending Growth FY 2024 and FY 2025
Total Medicaid spending growth slowed to 5.5% in FY 2024 and is expected to slow further to 3.9% in FY 2025 (Figure 2). Total spending growth increased when the pandemic and continuous enrollment period began before peaking in FY 2022 and starting to slow slightly in FY 2023 as the continuous enrollment period ended. For FY 2024 and FY 2025, the total spending growth rate is projected to slow further as states wrap up the unwinding process. Nearly all responding states noted that Medicaid projections (for FY 2025) reflect the assumptions used in the state’s adopted budget.
Almost all states in FY 2024 and half in FY 2025 pointed to declines in enrollment during unwinding as the most significant factor driving changes in total Medicaid spending. Despite the downward pressure of enrollment declines due to unwinding, states are simultaneously experiencing a number of upward expenditure pressures, causing total spending to continue to increase but at a slower rate. Almost half of states noted upward pressure from enrollment increases due to eligibility expansions, overall state or Medicaid eligible population growth, or more generally, post-unwinding enrollment remaining above projected levels. States also noted that the enrollees that retained coverage during unwinding have higher health care needs and utilize more services than those disenrolled, resulting in increased per enrollee costs. A majority of responding states cited MCO or provider rate increases as an upward pressure on spending in FY 2024 and FY 2025. States noted that inflation and workforce shortages were driving higher labor costs, resulting in pressure to increase provider rates. Almost a quarter of states also mentioned expanding services available to members, directed or supplemental payments, and increasing LTSS costs as upward pressures on total spending in either FY 2024 or FY 2025 or both. A few states also reported increasing pharmacy costs as an upward budget pressure, though a few states noted pharmacy rebates or pharmacy cost containment initiatives were a downward pressure. A few states also mentioned a strong economy and its impact on enrollment as a downward pressure.
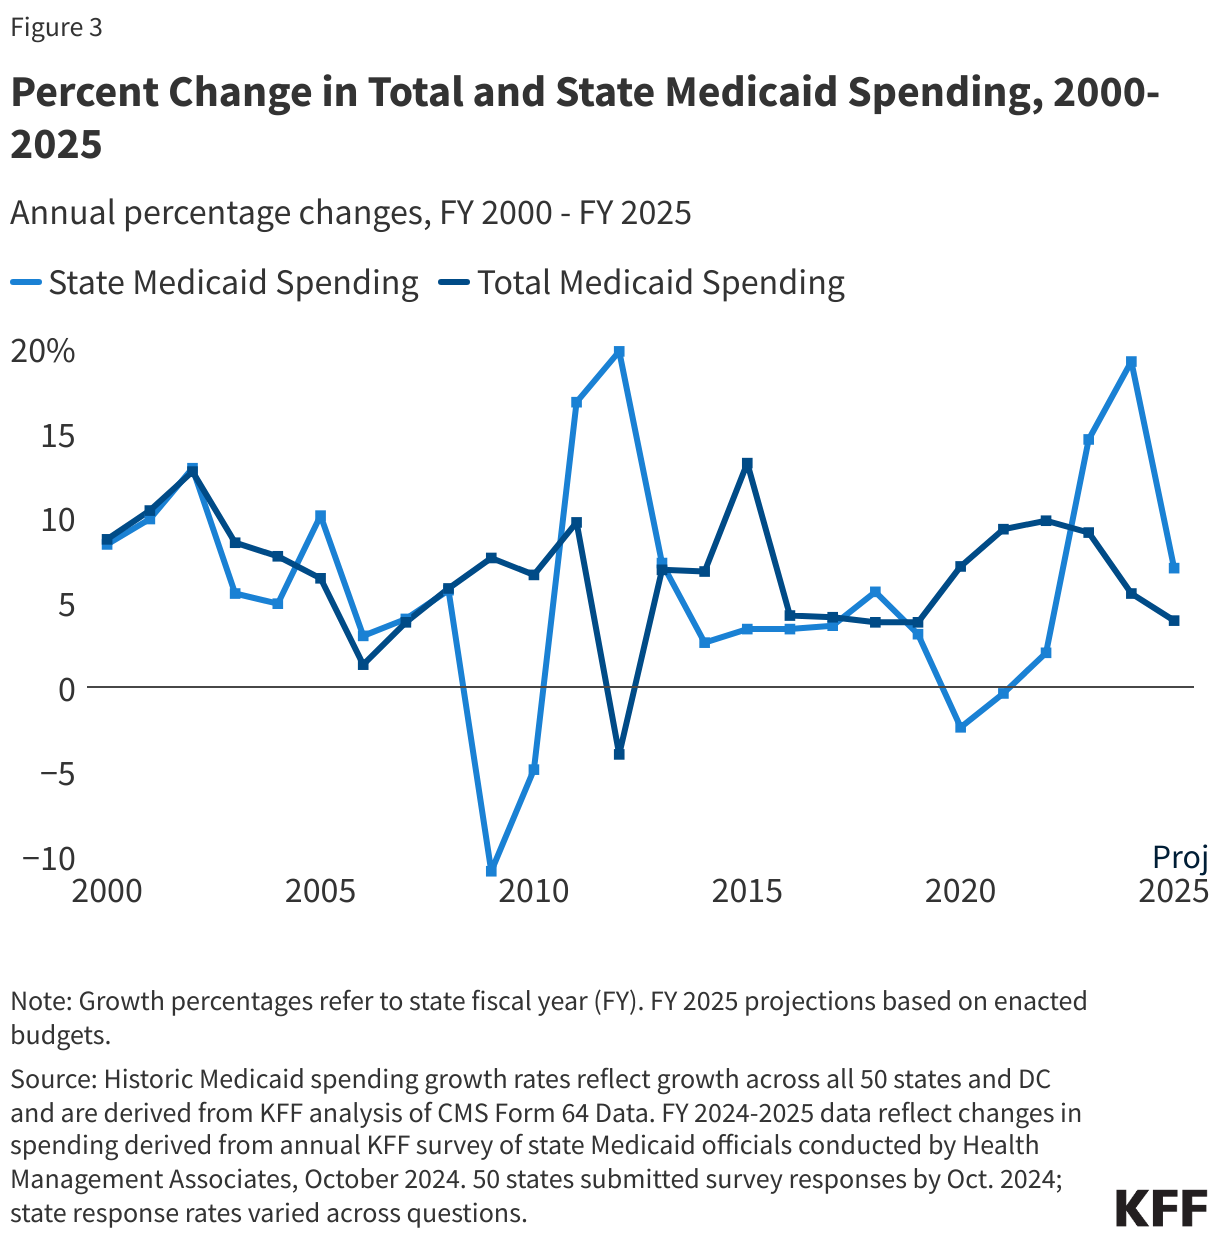
As anticipated, state Medicaid spending growth increased sharply in FY 2024 (19.2%) but is projected to slow to 7.0% in FY 2025, only slightly higher than total spending growth as the shifts caused by the enhanced FMAP expiration end (Figure 3). The state share of Medicaid spending typically grows at a similar rate as total Medicaid spending growth unless there is a change in the FMAP. During the Great Recession, state spending for Medicaid declined due to fiscal relief from a temporary FMAP increase provided in the American Recovery and Reinvestment Act (ARRA) but increased sharply when that fiscal relief ended. This pattern also occurred during the pandemic, with state Medicaid spending declining in FY 2020 and FY 2021 then increasing but at a slower rate than total spending in FY 2022 due to the pandemic-era enhanced FMAP. The rate of state spending growth increased in FY 2023 and FY 2024, surpassing the rate of total spending growth due to the phasing out of the enhanced FMAP. A few states also reported additional pressure on state spending from changes in their regular FMAP formula and/or the end of the enhanced FMAP for HCBS implemented as part of the American Rescue Plan Act (ARPA). Following the expiration of the enhanced FMAP, state Medicaid officials project state Medicaid spending in FY 2025 (7.0%) will fall back closer to total Medicaid spending growth projections (3.9%).
Despite overall stable budget conditions, over half of responding states at the time of the survey thought the chance of a Medicaid budget shortfall was “50-50”, “likely”, or “almost certain.” This is a significant change from the 2022 and 2021 surveys where most states did not anticipate state revenue shortfalls and signals that some states will have to contend with Medicaid budget gaps in FY 2025. A number of state officials commented on how challenging budgeting was at this time due to the downward expenditure pressure of declining enrollment coupled with the upward pressure of increasing per enrollee costs during unwinding as well as overall changes in the share of enrollees in each eligibility group and the implementation of recently enacted federal rules. States also noted uncertainty in their longer-term fiscal outlook due to emerging high-cost prescription drugs and economic factors such as costs of medical care and workforce challenges.
Methods |
| KFF commissioned Health Management Associates (HMA) to survey Medicaid directors in all 50 states and DC to identify and track trends in Medicaid spending, enrollment, and policymaking. Given differences in the financing structure of their programs, the U.S. territories were not included in this analysis. This is the 24th annual survey, conducted at the beginning of each state fiscal year from FY 2002 through FY 2025. State fiscal years begin on July 1 in most states except for: New York on April 1; Texas on September 1; Alabama, Michigan, and District of Columbia on October 1. The KFF/HMA Medicaid survey for this report was sent to each Medicaid director in June 2024. 50 states provided survey responses by October 2024; Florida did not respond to this year’s survey.
Medicaid Enrollment Growth: The average annual Medicaid enrollment growth rate for FY 2025 was calculated using weights based on Medicaid and CHIP preliminary monthly enrollment data for June 2024 published by CMS. For FY 2025, 48 states reported Medicaid enrollment growth rates. The data reported for FY 2024 and FY 2025 for Medicaid spending and FY 2025 for Medicaid enrollment are weighted averages, and therefore, data reported for states with larger enrollment and spending have a greater effect on the national average. Historical enrollment trend data for FY 1998 to FY 2013 reflects the annual percentage change from June to June of monthly enrollment data for Medicaid beneficiaries collected from all states and DC. Enrollment trend data for FY 2014 to FY 2024 reflects growth in average monthly enrollment based on KFF analysis of the Medicaid & CHIP Monthly Applications, Eligibility Determinations, and Enrollment Reports from CMS for all 50 states and DC. Note that several states have revised monthly enrollment data as far back as June 2017 to better align with reporting criteria for the CMS, Medicaid & CHIP Monthly Applications, Eligibility Determinations, and Enrollment Reports. Data for months prior to June 2017 have not been revised and may use slightly different criteria for reporting monthly enrollment and generally result in larger enrollment totals. Medicaid Spending Growth: For FY 2024 and FY 2025, annual rates of growth for Medicaid spending were calculated as weighted averages across all states. 50 states reported Medicaid expenditure growth rates for FY 2024 and FY 2025. Weights for spending were derived from net Medicaid expenditure data (including collections and adjustments) for FY 2023 from the CMS-64 Financial Management Reports and adjusted for state fiscal years. FY 2023 spending growth rate is also derived from net Medicaid expenditure data (including collections and adjustments) for FY 2023 from the CMS-64 Financial Management Reports, adjusted for state fiscal years. We estimate state fiscal year spending by summing 75% of spending from the same federal fiscal year with 25% of spending from the previous federal fiscal year. Historic Medicaid spending for FY 2022 and earlier are based on estimates prepared for KFF by the Urban Institute using CMS Form 64 reports. Definition of Medicaid Spending. Total Medicaid spending includes all payments to Medicaid providers for Medicaid-covered services provided to enrolled Medicaid beneficiaries. Medicaid spending also includes special disproportionate share hospital (DSH) payments that subsidize uncompensated hospital care for persons who are uninsured and unreimbursed costs of care for persons on Medicaid. Total Medicaid spending does not include Medicaid administrative costs and federally mandated state “Clawback” payments to help finance the Medicare Part D prescription drug benefit for Medicaid beneficiaries who are also enrolled in Medicare. States are also asked to exclude costs for the Children’s Health Insurance Program (CHIP). Total Medicaid spending includes payments financed from all sources, including state funds, local contributions, and federal matching funds. Historical state Medicaid spending refers to all non-federal spending, which may include local funds and provider taxes and fees as well as state general fund dollars. |