How Many Medicare Part D Enrollees Had High Out-of-Pocket Drug Costs in 2017?
The Medicare Part D prescription drug benefit has helped improve the affordability of medications for people with Medicare. Yet Part D enrollees can face relatively high out-of-pocket costs because the Part D benefit does not have a hard cap on out-of-pocket spending. For drug costs above the catastrophic threshold, enrollees are required to pay up to 5 percent of their total drug costs, unless they receive low-income subsidies (LIS) that help pay Part D premiums and cost sharing.
As policymakers continue to discuss ways to reduce Medicare prescription drug spending, proposals to place a hard cap on out-of-pocket spending in Part D have gained bipartisan support in the 116th Congress. This analysis presents the latest data on out-of-pocket drug spending among Medicare Part D enrollees without the LIS who have costs above the catastrophic threshold, referred to here as enrollees with high out-of-pocket drug costs.
Key Findings
- In 2017, 1 million Medicare Part D enrollees had out-of-pocket spending above the catastrophic threshold, with average annual out-of-pocket costs exceeding $3,200—over six times the average for all non-LIS enrollees.
- Treatments for autoimmune diseases, hepatitis C, and certain types of cancer were among the 10 highest-cost medications for these 1 million enrollees in 2017, with annual out-of-pocket spending per drug for each of the 10 medications averaging over $5,000.
- Part D enrollees without low-income subsidies who had high out-of-pocket drug costs in 2017 would have collectively saved $1.4 billion if Part D had a hard cap on out-of-pocket spending that year, rather than requiring enrollees to pay up to 5% coinsurance in the catastrophic phase.
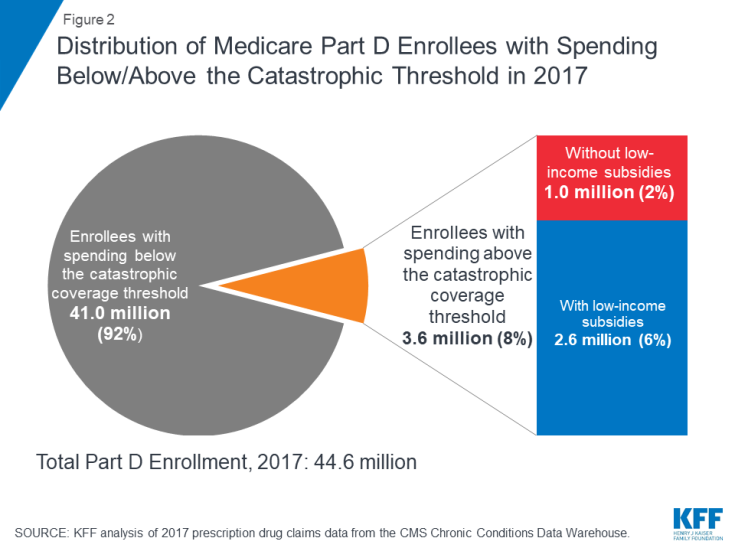
Nearly 1 in 10 Medicare Part D enrollees had drug spending above the catastrophic coverage threshold in 2017, most of whom received low-income subsidies—but 1 million did not
In 2017, 3.6 million Medicare Part D enrollees had total drug spending above the catastrophic coverage threshold, which equaled $8,071 in total drug costs that year. This equals 8% of the 44.6 million Medicare beneficiaries enrolled in Part D plans in 2017. Of this total, 2.6 million enrollees (72%) received low-income subsidies (LIS) to help pay their Part D plan premiums and cost sharing, but 1 million enrollees (28%) did not receive these additional subsidies and were therefore not protected against having high out-of-pocket drug costs.
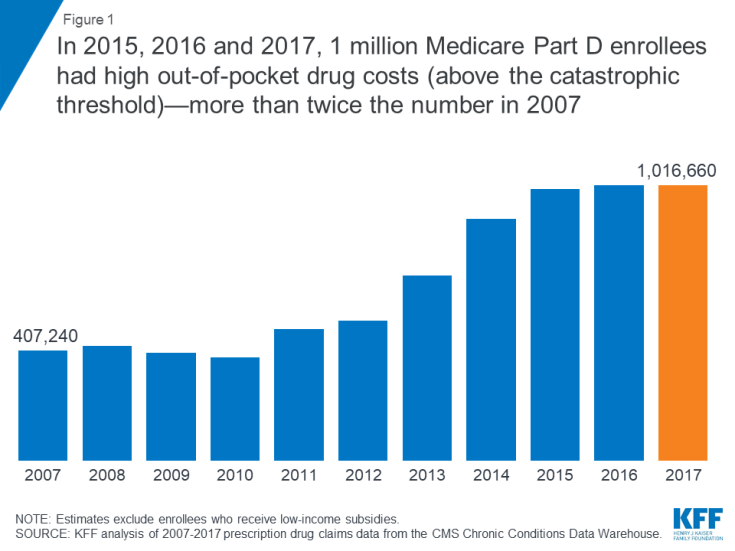
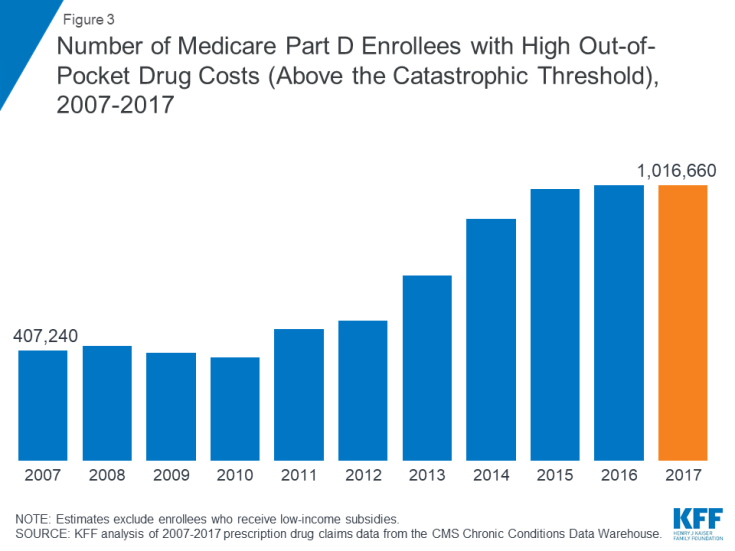
In 2015, 2016 and 2017, 1 million Medicare Part D enrollees without low-income subsidies had high out-of-pocket drug costs (above the catastrophic threshold)—more than twice the number in 2007
Between 2007 and 2015, the number of Part D enrollees without low-income subsidies who had spending above the catastrophic coverage threshold more than doubled. In each year between 2015 and 2017, 1 million Part D enrollees had high out-of-pocket drug costs.
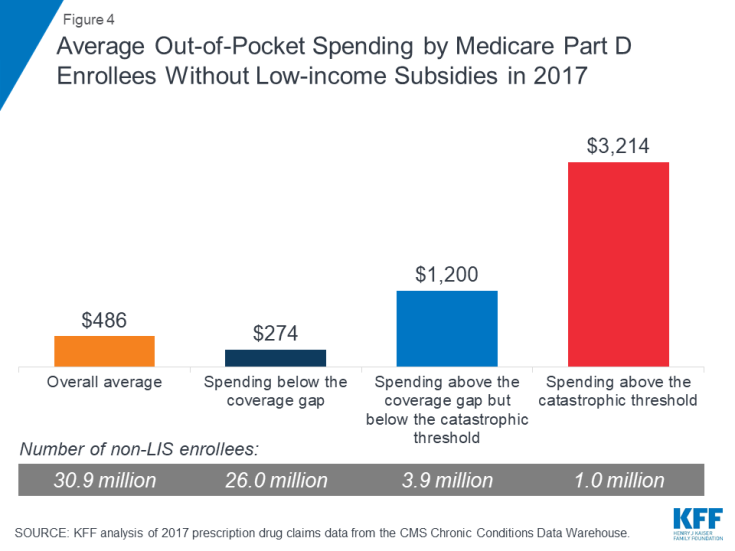
Part D enrollees with high out-of-pocket drug costs spent over $3,200 out-of-pocket in 2017, more than 6 times overall average out-of-pocket costs among non-LIS enrollees
On average, Part D enrollees with high out-of-pocket drug costs spent $3,214 for prescriptions in 2017. This is more than six times average out-of-pocket spending by enrollees without the LIS overall ($486), and more than 2.5 times average out-of-pocket spending by enrollees without the LIS who had spending in the coverage gap but not above the catastrophic threshold ($1,200). Enrollees without the LIS who did not have spending high enough to reach the coverage gap spent $274 out of pocket in 2017.
Medicare Part D enrollees with high out-of-pocket drug costs incurred 44% of their total out-of-pocket costs above the catastrophic coverage threshold in 2017
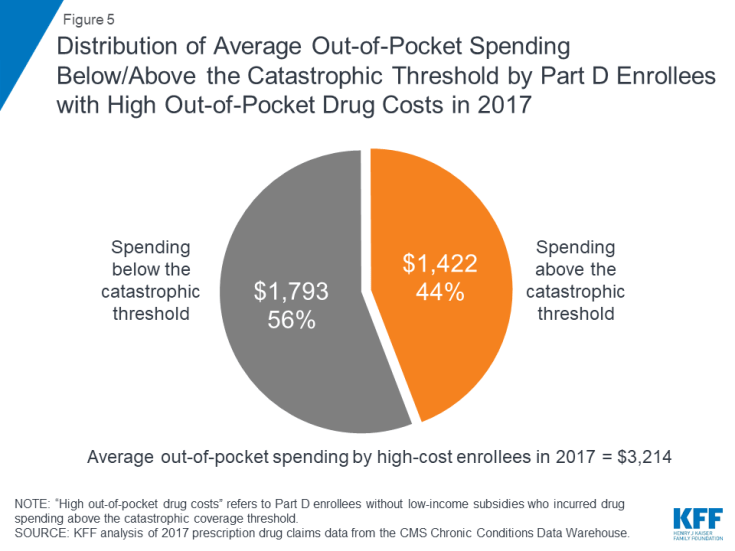
Of their total out-of-pocket costs, non-LIS Part D enrollees with high out-of-pocket costs spent an average of $1,793 (56%) below the catastrophic threshold and $1,422 (44%) above the threshold in 2017. In the aggregate, these Part D enrollees with high out-of-pocket costs spent $1.4 billion on their prescription drug costs above the catastrophic coverage threshold in 2017.
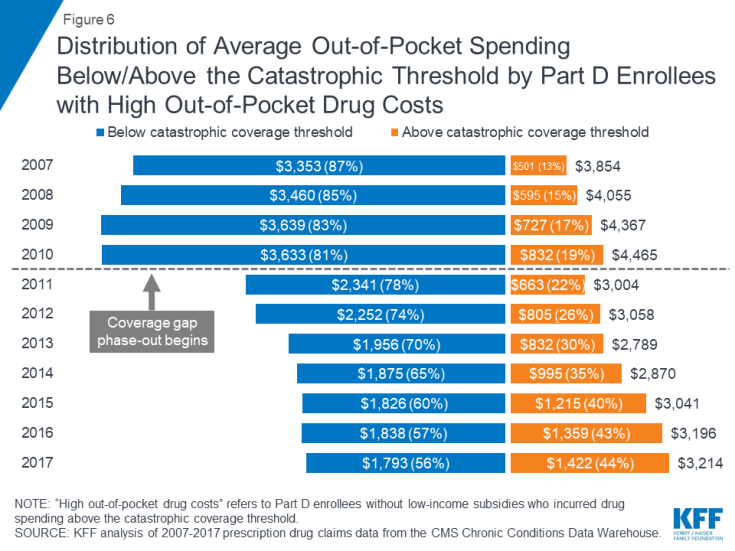
Over time, Part D enrollees with high out-of-pocket drug costs have spent more out of pocket in the catastrophic coverage phase, from 13% in 2007 to 44% in 2017
Although total out-of-pocket spending among Part D enrollees with high out-of-pocket drug costs is lower in 2017 than it was in 2007, the share of out-of-pocket spending in the catastrophic coverage phase among these enrollees has increased over time: from 13% in 2007 to 44% in 2017. This increase is related to changes in the Part D benefit design made by the Affordable Care Act (ACA) that have accelerated the pace of beneficiaries moving through the coverage gap and into the catastrophic phase—namely, the phase-out of the coverage gap, with increasing plan liability for total costs over time and a manufacturer discount on brand-name drugs in the coverage gap.
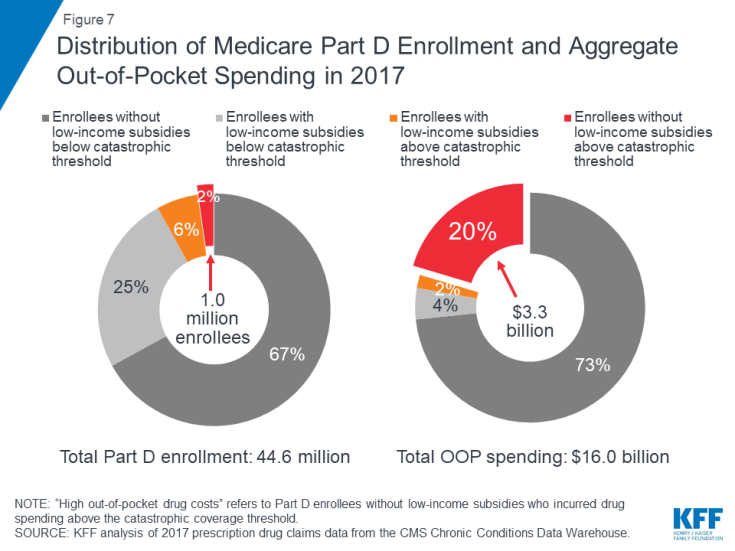
Part D enrollees with high out-of-pocket costs accounted for only 2% of all Part D enrollees in 2017, but their out-of-pocket costs represented 20% of the total
A disproportionate share of aggregate out-of-pocket drug spending by all Medicare beneficiaries enrolled in Part D is accounted for by enrollees without low-income subsidies who face high out-of-pocket costs (above the catastrophic coverage threshold). In 2017, beneficiaries in Part D plans spent a total of $16 billion out of pocket on prescription drugs. Part D enrollees with high out-of-pocket drug costs accounted for 20% of aggregate out-of-pocket drug spending by all enrollees ($3.3 billion), even though they comprised just 2% of all Part D enrollees.
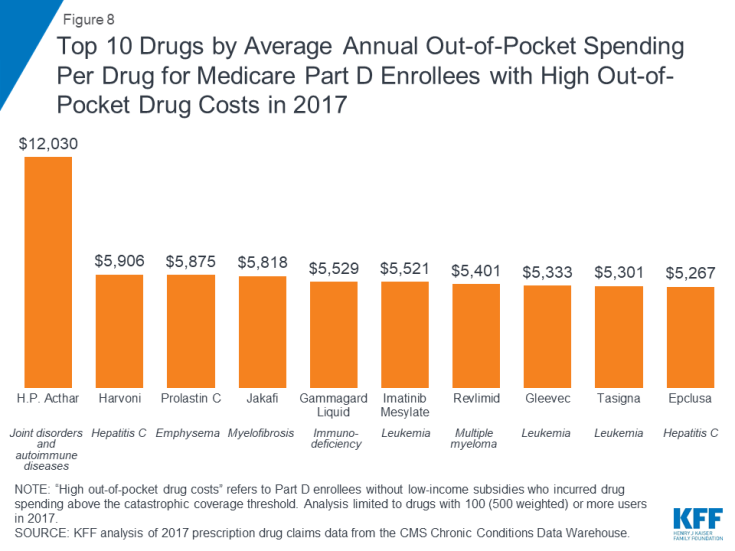
Drugs to treat hepatitis C and cancer were among the 10 drugs with the highest annual out-of-pocket costs per drug for Medicare Part D enrollees with high out-of-pocket drug costs in 2017
In 2017, H.P. Acthar, a treatment for joint disorders and autoimmune diseases, and Harvoni, a treatment for hepatitis C, were the two most expensive drugs, in terms of average per capita out-of-pocket spending per drug for Part D enrollees without low-income subsidies who had high out-of-pocket drug costs. On average, enrollees who faced high out-of-pocket drug costs in 2017 spent $12,030 for H.P. Acthar alone and $5,906 for Harvoni alone. Several cancer drugs were also among the top 10 drugs with the highest out-of-pocket costs per drug among non-LIS Part D enrollees with spending above the catastrophic threshold in 2017, including Jakafi ($5,818), Gleevec ($5,333), and its generic equivalent, imatinib mesylate ($5,521). Part D enrollees using any of these medications who incurred these high out-of-pocket costs per drug would have spent even more out of pocket in 2017 if were also taking other medications.
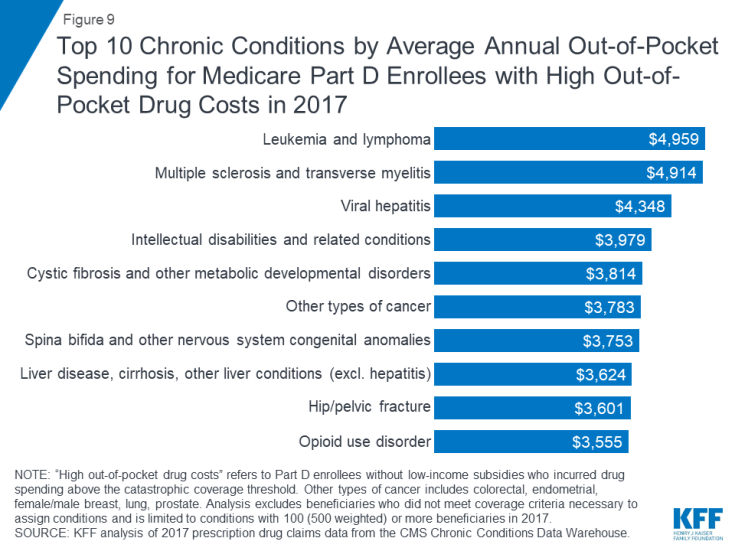
In 2017, Part D enrollees in stand-alone drug plans with leukemia and lymphoma who had high out-of-pocket drug costs spent more on their drugs than those with other conditions—nearly $5,000, on average
Among stand-alone prescription drug plan (PDP) enrollees without low-income subsidies who had high out-of-pocket drug costs, those with leukemia and lymphoma incurred the highest average out-of-pocket drug spending in 2017 ($4,959), followed by those with multiple sclerosis ($4,914), and those with viral hepatitis ($4,348).
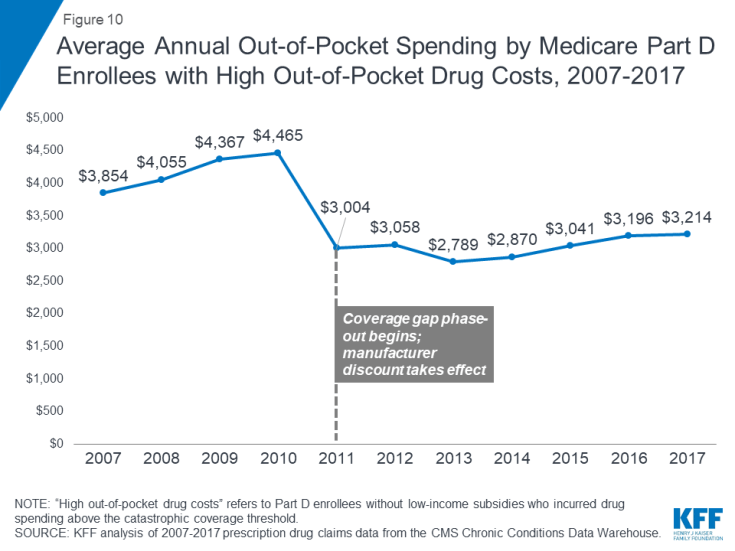
Average out-of-pocket spending by non-LIS Part D enrollees with high out-of-pocket drug costs decreased when the coverage gap phase-out started in 2011—but is on the rise
With the ACA provisions to phase out the coverage gap taking effect in 2011, average out-of-pocket spending by Part D enrollees who incur high out-of-pocket costs was lower in 2017 than it was in 2010, before the gap coverage phase-out began. The first-year effect of the ACA changes was a substantial reduction in spending by Part D enrollees who incurred high out-of-pocket drug costs, after increasing every year between 2007 and 2010. But this trend has reversed in recent years.
Between 2010 and 2011, average out-of-pocket spending by Part D enrollees with high out-of-pocket drug costs declined 33%, from $4,465 to $3,004, as the ACA coverage gap phase-out began. But between 2011 and 2017, the average increased by 7%, to $3,214, as new high-cost drugs came to market and prices for existing drugs increased.
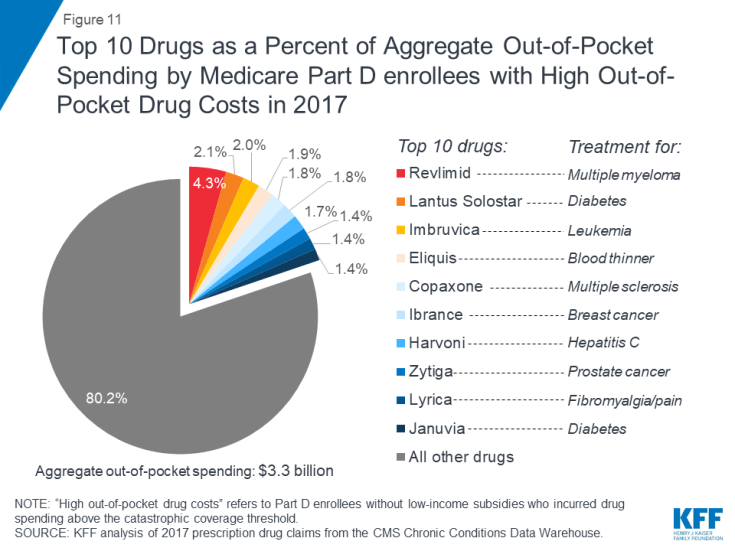
Ten brand-name drugs accounted for 20% of aggregate out-of-pocket spending by Medicare Part D enrollees with high out-of-pocket drug costs in 2017
Ten brand-name drugs accounted for 20% of the $3.3 billion in aggregate out-of-pocket spending by Part D enrollees without low-income subsidies who had high out-of-pocket drug costs in 2017. One drug alone—Revlimid, a treatment for multiple myeloma—accounted for 4% of total out-of-pocket costs among the high-spending population without the LIS in 2017, while the top three drugs—Revlimid, Lantus Solostar, a diabetes drug, and Imbruvica, a treatment for leukemia and lymphoma—accounted for 8.5%.
Juliette Cubanski and Tricia Neuman are with the Kaiser Family Foundation.
Anthony Damico is an independent consultant.

