Trends in State Medicaid Programs: Looking Back and Looking Ahead
Section 1: Medicaid Spending and Enrollment Trends
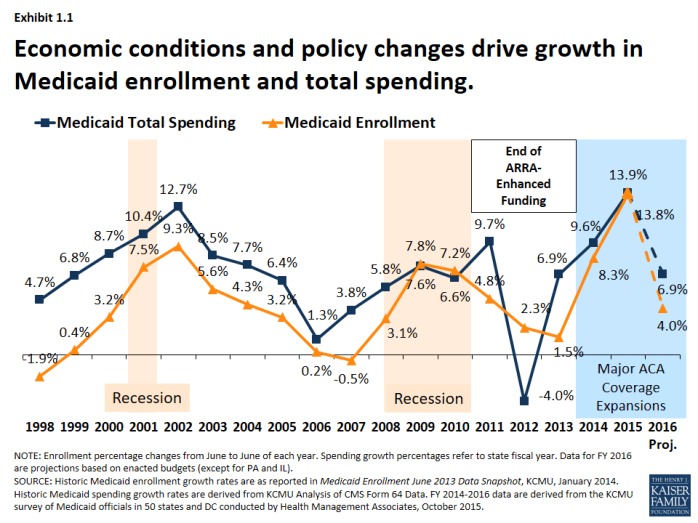
Medicaid is a countercyclical program; Medicaid spending and enrollment growth patterns generally follow the economic cycles. Over the past 15 years, Medicaid enrollment increased substantially during two major recessions, reflecting the countercyclical nature of the program. During economic downturns, when individuals lose their jobs and incomes decline, more people qualify and enroll in Medicaid, which in turn drives increases in total Medicaid spending. As economic conditions improve, Medicaid enrollment growth slows in the absence of other policy changes. This held true in recent years for Medicaid spending and enrollment growth – spending and enrollment growth peaked in SFY 2002 (during an economic downturn), slowed in SFYs 2006 and 2007, and then peaked again in SFY 2009 during the Great Recession. As economic conditions improved, Medicaid enrollment and spending slowed in SFY 2011 through SFY 2013.1 (Exhibit 1.1)
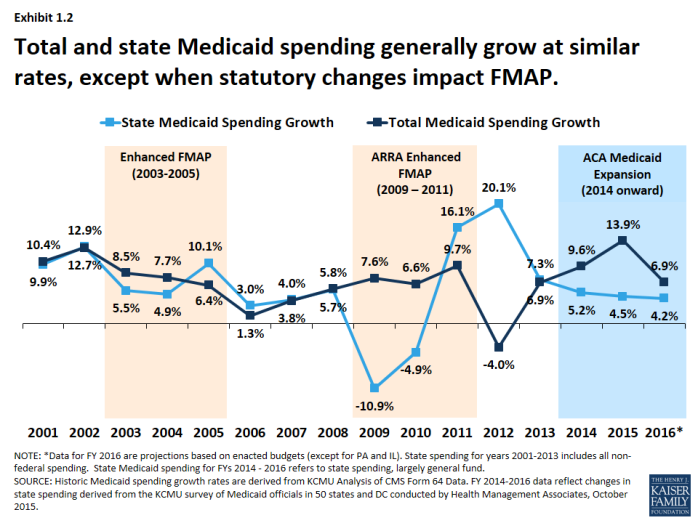
State spending generally follows the same pattern as total spending, except when there are federal changes to the match rate. (Exhibit 1.2) The Medicaid program is jointly funded by states and the federal government; the federal government guarantees matching funds to states for qualifying Medicaid expenditures. In 2016, the federal match rate ranged from a floor of 50% to 74% with poorer states receiving a higher match rate. Because of this structure, total spending growth and state spending on Medicaid tends to grow at similar rates. Exceptions occur when there are changes in federal law that affect matching rates. For example, the magnitude of the federal fiscal relief in ARRA resulted in historic declines in state spending for Medicaid in 2009 and 2010. However, the expiration of this relief resulted in higher state Medicaid spending growth in SFY 2012 compared to growth in federal Medicaid spending. More recently, the change in the Medicaid match rate tied to the ACA Medicaid expansion has resulted in a divergence in growth rates for total and state Medicaid spending.
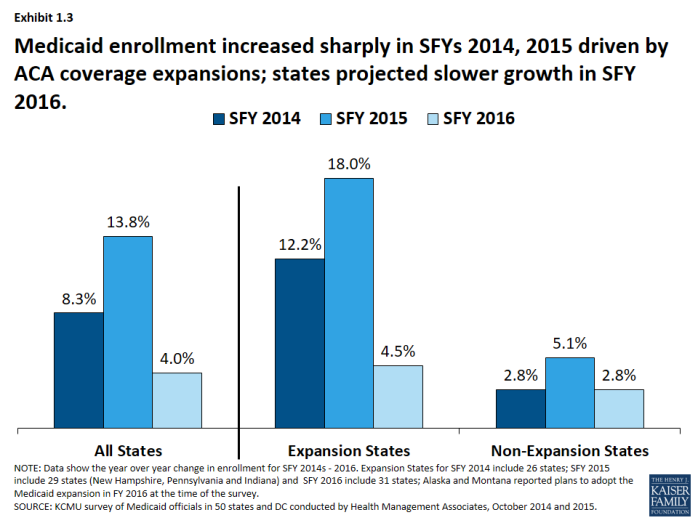
Implementation of the major ACA coverage expansions resulted in sharp increases in Medicaid enrollment in SFY 2014 and 2015. A second driver of Medicaid spending and enrollment trends is policy changes. Medicaid enrollment increased substantially in SFY 2014 and SFY 2015 as the major ACA coverage expansion went into effect. While virtually all states saw enrollment growth, differential effects occurred across states that adopted the Medicaid expansion and those that did not. Medicaid enrollment growth in expansion states far exceeded growth in non-expansion states. Across the 29 states that had expanded2 in SFY 2015, enrollment increased on average by 18 percent, driven by enrollment among adults qualifying under expansion which were fully federally funded. For SFY 2016, enrollment growth was projected to slow across all states, driven by projected slower growth in expansion states. (Exhibit 1.3)
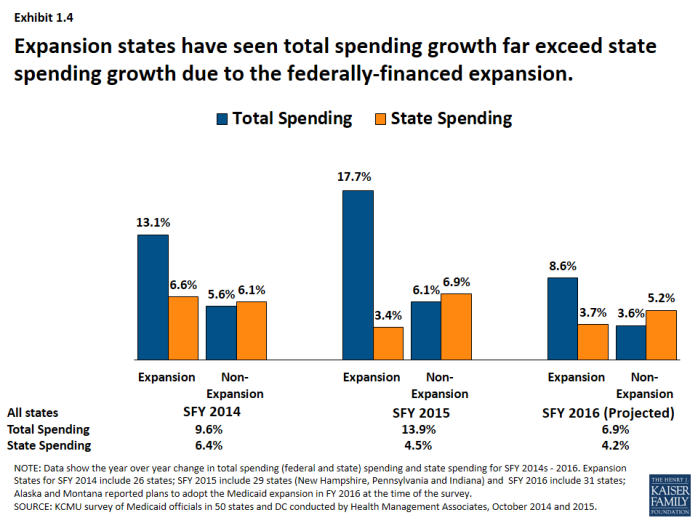
State spending on Medicaid grew at a much slower rate than total Medicaid spending driven by the influx of federal dollars for the ACA Medicaid expansion. (Exhibit 1.4) Total Medicaid spending grew in tandem with enrollment growth, increasing substantially in expansion states. However, state spending grew at a much slower rate than total spending in expansion states due to the higher match rate for the expansion population. For states that expand Medicaid, the federal government pays 100 percent of Medicaid costs of those newly eligible under the Medicaid expansion for calendar years 2014-2016. The federal share gradually phases down to 90 percent in 2020 and thereafter, well above traditional FMAP rates. In contrast, non-expansion states saw total spending and state spending grow in tandem.


