How Have Insurers Fared Under the Affordable Care Act?
The first full year of implementation of the Affordable Care Act (ACA) brought substantial changes to the individual insurance market. Beginning in 2014, insurers could no longer turn down applicants with pre-existing health conditions or charge them higher premiums. The so-called “individual mandate” required people to obtain coverage or pay a penalty, and federal subsidies available in the new health insurance Marketplaces made coverage more affordable for low and middle income enrollees. Overall, enrollment in the individual market grew by 46% in 2014.
Along with these changes came increased uncertainty for insurers. Carriers did not know how many new people would enroll, how many would be sick versus healthy, and how much pent up demand for health care there would be among those who were previously uninsured.
To mitigate this uncertainty, the ACA included three mechanisms (known as the “3Rs”) to stabilize the individual market: reinsurance, which reimburses insurers for some of the cost of high-cost patients; risk adjustment, which transfers money from insurers that attracted a healthier than average pool of enrollees to those with a sicker than average pool; and risk corridors, where insurers that overestimated expenses pay into a fund to cover a portion of the losses for those that underestimated their costs. The reinsurance and risk corridor programs last for three years, while the risk adjustment program is permanent.
How insurers performed financially with their individual market business as the ACA was implemented has important implications for the future. In particular, insurance regulators are currently reviewing proposed premiums for 2016, and this is the first time that insurers have access to a full year of claims under the ACA in order to project premiums.
Based on recently-filed data submitted to state insurance commissioners, we analyzed 2014 financial performance for insurers in the individual market (using data compiled by Mark Farrah Associates). We examined the trend in the medical loss ratio (MLR), which is calculated as claims divided by premiums adjusted for taxes and fees, and is a widely-accepted measure of financial performance.
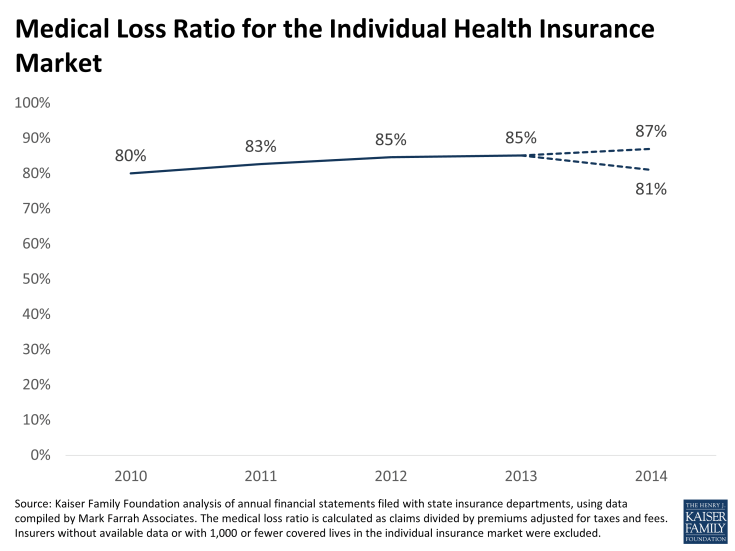
As shown in the chart below, the overall MLR in the individual market began climbing following passage of the ACA, increasing from 80% in 2010 to 85% in 2013, the year before the new insurance market rules and subsidies took effect. This increase is likely due in large part to a requirement in the ACA that insurers achieve an MLR of at least 80% beginning in 2011 or pay rebates to consumers. (Note that the MLR calculation we use here is somewhat different from that used to calculate rebates, which includes adjustments for spending on quality improvement and other factors.)
For 2014, financial results depend heavily on how much insurers will receive in reinsurance payments under the ACA, which will not be known until June 30, 2015. Insurers submit requests for reinsurance payments to the federal government based on expenses for high-cost patients. If total requested payments are less than the funding available, payments to insurers will be increased. Total reinsurance funding for 2014 was set at $10 billion for 2014 in the ACA statute, though the total amount available from reinsurance fees is now projected to be $9.7 billion. Insurers have reported $5.5 billion in expected reinsurance payments in filings to state insurance commissioners, though that figure does not include any adjustments upward the federal government may make or data from insurers in California, which file separate reports.
We estimate that the MLR in 2014 for the individual market – including coverage purchased since January 1, 2014 under new ACA rules as well as plans bought prior to then under pre-ACA insurance rules – will range from 81% to 87%. The high end of the range assumes that reinsurance payments to insurers will total (as a share of claims) what carriers with available data reported to state insurance departments. The low end of the range assumes that the full estimated amount of $9.7 billion will be paid out.
This would suggest insurers overall had roughly comparable financial performance as in recent years, and that performance likely ranged from somewhat better to somewhat worse than in in 2013. Even in the worst case, financial results were not substantially different from the years prior to when the ACA’s major changes in insurance market rules took place in 2014. (Financial performance, of course, varied substantially across insurers.)
These results suggest that actual experience in the first year of changes to the individual insurance market under the ACA may validate the need for somewhat higher premiums, but the effect is not likely to be dramatic across the market overall. While some insurers saw unexpectedly high health expenses relative to the premiums they set, others largely balanced that out with better experience than expected. In addition, some of the claims experience in 2014 likely included pent up demand among the newly insured that will not necessarily persist.
There are factors pushing premiums higher in 2016, including expectations for an upward trend in health care costs generally – particularly for prescription drugs — as well as the phasing out of the transitional reinsurance program (from $10 billion in 2014 to $4 billion in 2016). Other factors may push premiums down in the coming years, such as competitive forces in marketplaces in much of the country, as well as a possible influx of healthier enrollees as penalties under the individual mandate ramp up and so-called “grandmothered” insurance plans operating under transitional rules phase out. Insurers will continue to assess and balance these factors, as will the state insurance regulators who have the responsibility of judging whether premiums are justified and appropriate.

