Survey of Americans on Race
Section 2: Inequities in the Criminal Justice System and Recent Unrest
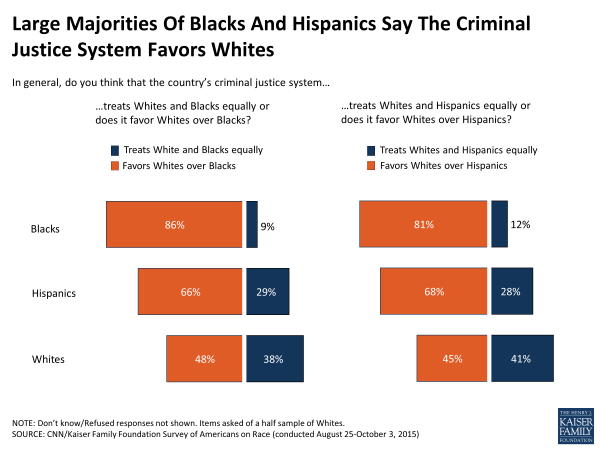
Many Black and Hispanic people in America say the U.S. criminal justice system is stacked against them. Over 8 in 10 Blacks (86 percent), including 83 percent of Black men, say the criminal justice system favors Whites over Blacks and two-thirds (66 percent) of Hispanics agree. Results are very similar when asking whether the system favors Whites over Hispanics – 68 percent of Hispanics say it does, and 81 percent of Blacks say the same. Whites on the other hand are more divided on whether the criminal justice system favors people of their race over each minority group. Some of these perceptions likely come from personal experience – as noted above, nearly one in five Hispanics and Blacks say they have been unfairly treated by police in the past 30 days, compared to just 3 percent of Whites.
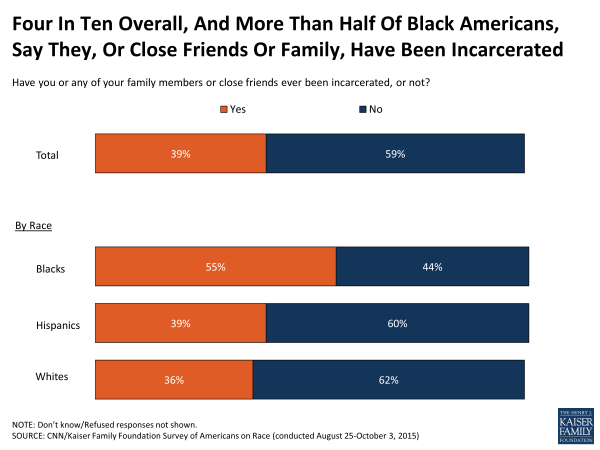
Blacks disproportionately bear the burden of a personal connection to the prison system as more than half of Black Americans (55 percent) say that they, or close friends or family, have been incarcerated. Black Americans living in urban areas are more likely to report a connection to the prison system (60 percent), but still nearly half of suburban and rural Blacks say the same (48 percent). Smaller, but still substantial shares of Hispanics (39 percent) and Whites (36 percent) report such a connection.
Looking at the demographic profile of those who either have been incarcerated themselves or have family members or close friends who have been, they are more likely to be younger, Black, lower income, have not completed college or say they are of a lower social class.
| Demographics of Those with Ties to Prison System | |||
| Among those who say they or a close friend/family member has been incarcerated | Among those who say they or a close friend/family member has NOT been incarcerated* | ||
| Race/Ethnicity | Hispanics | 15% | 15% |
| Whites | 60 | 68 | |
| Blacks | 16 | 9 | |
| Other | 9 | 8 | |
| Household Income | Less than $50,000 | 50 | 38 |
| $50,000 or more | 40 | 43 | |
| Don’t know/refused | 10 | 19 | |
| Reported Social Class | Lower/Lower-middle class | 47 | 32 |
| Middle class | 41 | 48 | |
| Upper/Upper-middle class | 11 | 19 | |
| Age | 18-34 | 33 | 25 |
| 35-64 | 53 | 51 | |
| 65+ | 12 | 24 | |
| Education | High School or Less | 45 | 40 |
| Some College | 30 | 26 | |
| College Grad or more | 25 | 33 | |
| Note: People who are currently incarcerated are not included in the survey sample, and therefore, are not reflected in the estimates above.
* Includes those who say they don’t know and those who refused to answer. |
|||
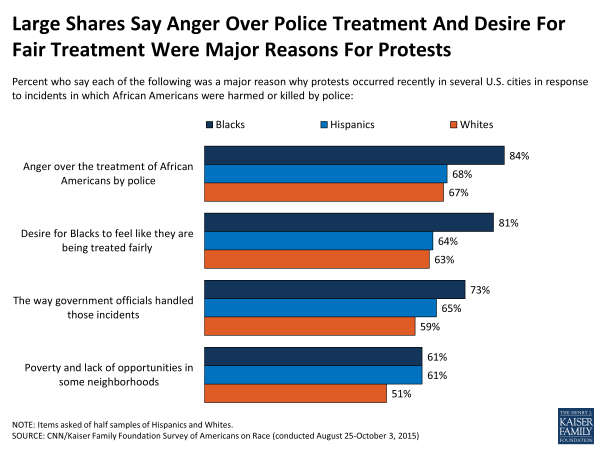
Recent incidents of police violence towards Black Americans have generated protests and civil unrest in cities across America. When asked about different reasons underlying these protests, large majorities of Black Americans say that “anger over the treatment of African Americans by police” (84 percent) and a “desire for Blacks to feel like they are being treated fairly” (81 percent) are major reasons for recent protests. More than 7 in 10 Blacks (73 percent) say that “the way government officials handled these incidents” was a major reason, and about six in ten (61 percent) cite “poverty and lack of opportunities in some neighborhoods.”
While majorities of Whites and Hispanics also say each factor was a major reason for protests, they are generally less likely than Blacks to identify each as a major reason, with the exception that the same share of Blacks and Hispanics (61 percent each) say poverty or lack of opportunities in some neighborhoods was a major reason for the protests – higher than the 51 percent of Whites who feel this is a major reason for the protests.
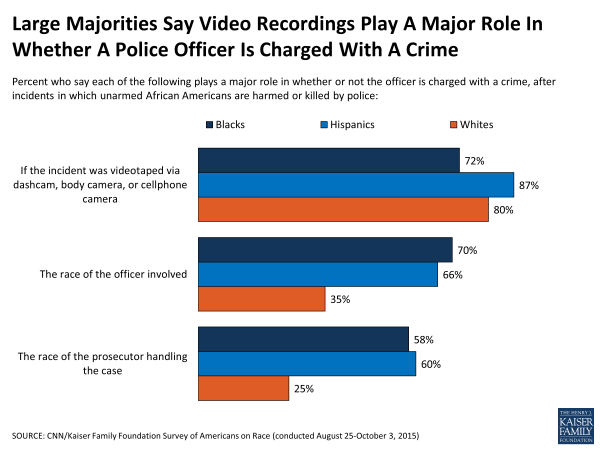
Many recent incidents of police violence towards African Americans have been caught on camera, allowing a rare opportunity for Americans across the country to witness these situations and draw their own conclusions about the use of force. Some have argued that these tapes provide an often-absent level of police accountability. When asked how much of a role an incident being videotaped plays in whether or not an officer is charged with a crime, a large majority of Blacks (72 percent) say it plays a major role; a view shared by majorities of Hispanics (87 percent) and Whites (80 percent) as well. Seven in 10 Blacks also say the race of the officer involved plays a major role (70 percent), followed by nearly 6 in 10 Blacks (58 percent) who say the race of the prosecutor handling the case plays a major role. Six in 10 or more Hispanics also report these two factors play a major role, however considerably smaller shares of Whites say the same.
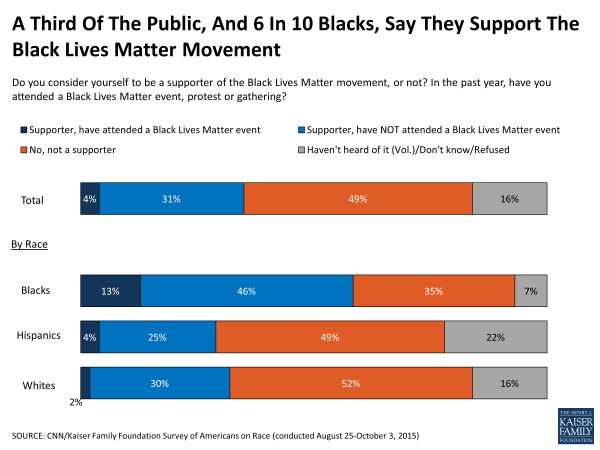
One outcome of these episodes over the past few years has been the establishment of the Black Lives Matter (BLM) movement. More than half of Blacks say they are supporters of Black Lives Matter (58 percent), including 13 percent who say they have attended a BLM event, protest or gathering in the past year. Among the general public overall, support is less wide-spread with 35 percent saying they support the movement, including 32 percent of Whites and 28 percent of Hispanics saying they support the cause, and few (4 percent overall) saying they have attended a BLM event in the past year.
There are some key demographic differences between supporters of the Black Lives Matter movement and those who don’t support the movement, either because they say they are not a supporter or because they haven’t heard of it or just aren’t sure. BLM supporters are more likely to be Black, Democrat, and younger and less likely to have lower levels of education, or identify as Republican, independent, and politically conservative.
| Demographics of Black Lives Matter Supporters | ||||
| Support (35%) |
Not support
BLM (49%)
|
Haven’t heard
of it/
Don’t know/
Refused
(16%)
|
||
| Race/Ethnicity | Hispanics | 12% | 15% | 21% |
| Whites | 58 | 69 | 66 | |
| Blacks | 19 | 8 | 5 | |
| Other | 10 | 8 | 8 | |
| Household Income | Less than $50,000 | 48 | 39 | 43 |
| $50,000 or more | 40 | 47 | 32 | |
| Don’t know/refused | 12 | 14 | 25 | |
| Age | 18-34 | 40 | 23 | 17 |
| 35-64 | 46 | 55 | 57 | |
| 65+ | 13 | 21 | 26 | |
| Education | High School or Less | 37 | 44 | 46 |
| Some College | 31 | 26 | 25 | |
| College Grad or more | 32 | 29 | 28 | |
| Party Identification | Republican | 11 | 27 | 22 |
| Independent | 26 | 42 | 39 | |
| Democrat | 51 | 22 | 24 | |
| Political Ideology | Liberal | 36 | 18 | 24 |
| Moderate | 37 | 35 | 33 | |
| Conservative | 22 | 43 | 34 | |

