The Uninsured and the ACA: A Primer - Key Facts about Health Insurance and the Uninsured amidst Changes to the Affordable Care Act
Who remains uninsured after the ACA and why do they lack coverage?
Despite coverage gains, groups with historically high uninsured rates continue to be at highest risk of being uninsured, including low-income individuals, adults, and people of color. Although most remaining uninsured people are in working families, cost continues to pose a major barrier to coverage with nearly half (45%) of uninsured nonelderly adults in 2017 saying that they lacked coverage because it was too expensive.1
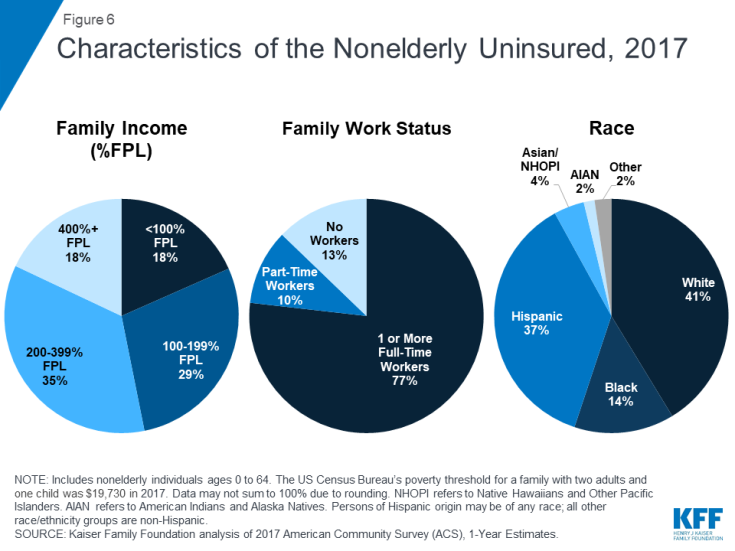
Though provisions in the ACA aim to make coverage more affordable for low and moderate-income families, these income groups still make up the vast majority of the uninsured. Low-income individuals are at the highest risk of being uninsured.2 Nearly half of the remaining uninsured population (47%) has family income below 200% of poverty ($19,730 for a family with two adults and one child in 2017)3 and another 35% has family income between 200 and 399% of poverty (Figure 6).
A majority of the remaining uninsured population is in a family with at least one worker, and many uninsured workers continue to lack access to coverage through their job. Not all workers have access to health coverage through their jobs or can afford the coverage offered to them. In 2017, more than three-quarters (77%) of the uninsured had at least one full-time worker in their family, and an additional 10% had a part-time worker in their family (Figure 6).4 As in the past, low-income workers and those who work in agriculture, construction, and service jobs are more likely than other workers to be uninsured.5 Moreover, not all workers have access to health coverage through their job. In 2017, 71% of nonelderly uninsured workers worked for an employer that did not offer health benefits to the worker.6
People of color are at higher risk of being uninsured than Whites. While a plurality (41%) of the uninsured are non-Hispanic Whites, people of color are disproportionately likely to be uninsured: they make up 42% of the overall nonelderly U.S. population but account for over half of the total nonelderly uninsured population (Figure 6). Hispanics and Blacks have significantly higher nonelderly uninsured rates (18.9% and 11.1%, respectively) than Whites (7.3%).7 Differences in coverage by race/ethnicity likely reflect a combination of factors, including language and immigration barriers, income and work status, and state of residence.
Adults are still more likely than children to be uninsured. Nonelderly adults were more than twice as likely as children (12% vs. 5%) to be uninsured in 2017.8 This disparity reflects ongoing differences in eligibility for public coverage. While the ACA has increased Medicaid eligibility levels for adults, states have expanded coverage for children even higher through CHIP, while adults without children are excluded from Medicaid in all but one non-expansion state.9
Uninsured rates for children are low, and most uninsured children are eligible for Medicaid or CHIP. Largely due to expanded eligibility for public coverage under Medicaid and CHIP, the uninsured rate for children is relatively low: in 2017, 5% of children nationwide were uninsured.10 Over three in five (64%) uninsured children are eligible for Medicaid, CHIP, or other public programs.11 Some of these children may be reached by covering their parents, as research has found that parent coverage in public programs is associated with higher enrollment of eligible children.12,13
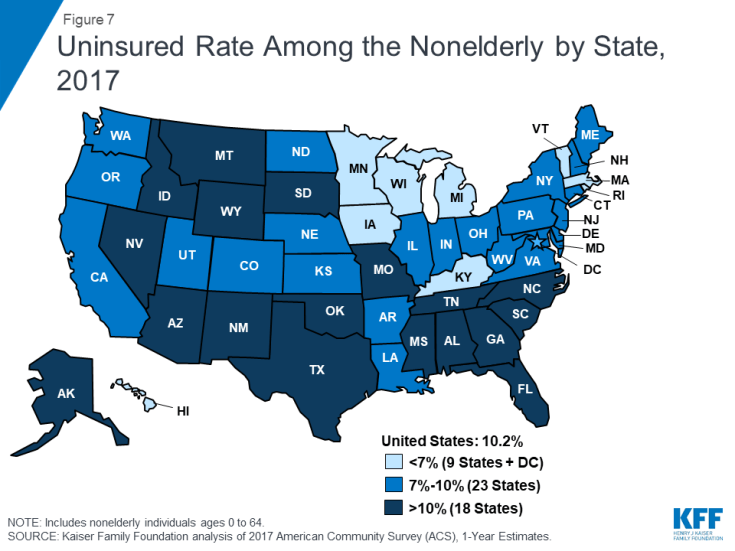
Insurance coverage continues to vary by state and region, with individuals living in non-expansion states being most likely to be uninsured (Figure 7). In 2017, thirteen out of the eighteen states with the highest uninsured rates were non-expansion states.14 Economic conditions, availability of employer-sponsored coverage, and demographics are other factors contributing to variation in uninsured rates across states.
While most of the uninsured are U.S. citizens, non-citizens continue to be at much higher risk of being uninsured. In 2017, three out of four (75%) uninsured nonelderly individuals were citizens. However, non-citizens (including those who are lawfully present and those who are undocumented) are more likely than citizens to be uninsured in 2017. Among citizens, 8% were uninsured in 2017, compared to 33% of non-citizens.15
Cost still poses a major barrier to coverage for the uninsured. Nearly half (45%) of uninsured adults in 2017 said that they lacked coverage was because of high cost.16 Though financial assistance is available to many of the remaining uninsured under the ACA,17 not everyone who is uninsured is eligible for free or subsidized coverage. In addition, some uninsured who are eligible for help may not be aware of coverage options or may face barriers to enrollment.18 Outreach and enrollment assistance was key to facilitating both initial and ongoing enrollment in ACA coverage, but these programs face challenges due to funding cuts and high demand.19,20
Access to health coverage changes as a person’s situation changes. In 2017, 22% of uninsured nonelderly adults said they were uninsured because the person who carried the health coverage in their family lost their job or changed employers.21 More than one in ten were uninsured because of a marital status change, the death of a spouse or parent, or loss of eligibility due to age or leaving school (11%), and some lost Medicaid because of a new job/increase in income or the plan stopping after pregnancy (11%).22
Most people who remained uninsured nonelderly adults in 2017 were uninsured for more than a year. Though the share of uninsured who lacked coverage for more than a year decreased from 81% in 2013 to 74% in 2017,23 the vast majority of uninsured people were still long-term uninsured. People who have been without coverage for long periods may be particularly hard to reach through outreach and enrollment efforts.


