Implementing the ACA: Medicaid Spending & Enrollment Growth for FY 2014 and FY 2015
Medicaid spending and enrollment growth are affected by both the economy and policy decisions determining who is covered under the program, the services provided and payments for care. For more than a decade, economic conditions, including two major recessions, were the primary driver of changes in Medicaid spending and enrollment. In FY 2014 and in budgets adopted for FY 2015, enrollment and spending have grown with implementation of the major coverage provisions in the Affordable Care Act (ACA), including the federally financed Medicaid expansion. This report provides an overview of Medicaid spending and enrollment growth with a focus on state fiscal years 2014 and 2015 (FY 2014 and FY 2015) and an overview of Medicaid financing. Findings are based on interviews and data provided by state Medicaid directors as part of the 14th annual survey of Medicaid directors in all 50 states and the District of Columbia conducted by the Kaiser Commission on Medicaid and the Uninsured (KCMU) with Health Management Associates (HMA). Findings examine changes in overall enrollment and spending growth and compare expansion and non-expansion states.
All States
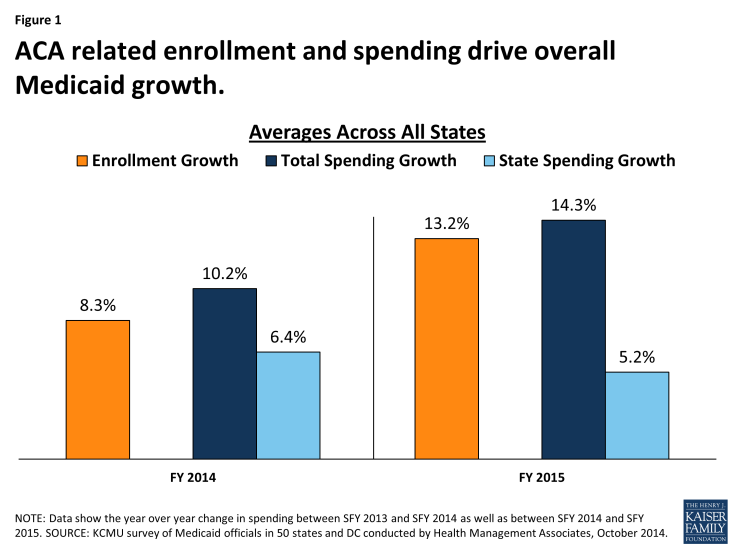
Implementation of the coverage expansions in the ACA are resulting in higher enrollment and total overall spending growth in Medicaid in FY 2014 and FY 2015. However, with full federal government financing of the Medicaid expansion population, state Medicaid spending is growing more slowly than total spending. In FY 2014, enrollment increased on average by 8.3 percent, faster than FY 2012 and FY 2013. Enrollment growth is due to the ACA expansions of coverage in states implementing the Medicaid expansion and increases in participation among individuals eligible under rules in place before the ACA across all states. Medicaid is jointly financed by states and the federal government. Based on a formula set in statute, the federal share ranges from a floor of 50 percent to a high of 73.6 percent in FFY 2015, with the federal government paying a higher share in poorer states. For states that implement the ACA Medicaid expansion up to 138 percent of poverty (a requirement that was effectively made optional by the Supreme Court decision) the federal government will pay 100 percent of the costs of those newly eligible from 2014-2016; that rate phases down to 90 percent in 2020 and beyond. In FY 2014, new coverage and spending at the enhanced match rate contributed to overall Medicaid spending growth of 10.2 percent, but resulted in slower state Medicaid spending across all states (6.4 percent). Total and state spending for Medicaid generally grow at similar rates when there are no changes in the federal match. The coverage provisions of the ACA went into effect in January 2014, mid-way through the state fiscal year which begins on July 1 in most states. The effect of the ACA is more pronounced in FY 2015 when the law is in effect for the entire state fiscal year. (Figure 1)
Expansion States
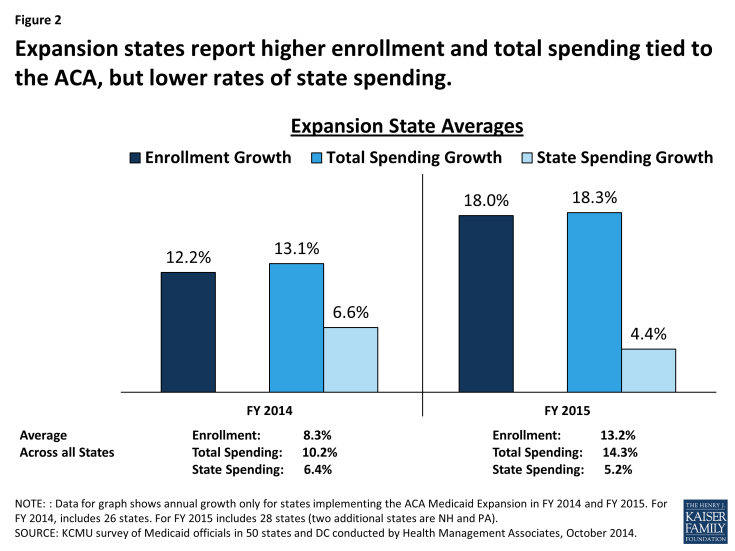
As anticipated, states implementing the Medicaid expansion are experiencing higher rates of enrollment growth and total spending growth in FY 2014 and FY 2015 due to higher coverage levels and access to enhanced federal matching funds. Across all states implementing the ACA Medicaid expansion in FY 2014 and FY 2015, enrollment growth averaged 12.2 percent and 18.0 percent, respectively, well above national averages. Expansion states also reported higher total spending growth relative to the national average in both years. The enhanced federal funds available to states implementing the Medicaid expansion results in large differences between total spending and state spending growth. The effects on enrollment and spending are more pronounced in FY 2015 when the ACA is in effect for the entire state fiscal year. In addition, the number of states implementing the Medicaid expansion increases from 26 to 28 as New Hampshire and Pennsylvania implement in FY 2015. (Figure 2)

Figure 2: Expansion states report higher enrollment and total spending tied to the ACA, but lower rates of state spending.
Non-Expansion States
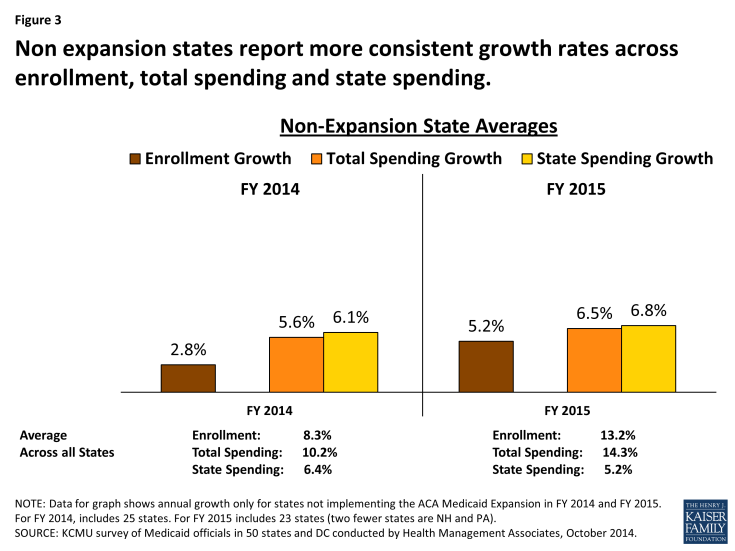
States not implementing the Medicaid expansion report lower enrollment growth compared to expansion states with total and state spending growing at similar rates. In FY 2014, across all states not implementing the ACA Medicaid expansion, enrollment growth averaged 2.8 percent. States reported that this relatively low rate of enrollment growth reflected an improving economy as well as processing backlogs due to problems with enrollment systems and account transfers. For FY 2015, enrollment growth is projected to average 5.2 percent across non-expansion states, as system issues are resolved and these states (like expansion states) experience increased participation among individuals eligible under pre-ACA rules. Without the effect of the enhanced ACA match rate, total and state spending on Medicaid are growing at similar rates in FY 2014 and FY 2015. (Figure 3)

Figure 3: Non expansion states report more consistent growth rates across enrollment, total spending and state spending.
Looking ahead beyond 2015. The economy, ACA implementation and other Medicaid policy changes (such as major payment and delivery system reform efforts) are expected to have a significant effect on Medicaid spending and enrollment trends across all states.


