Medicare Advantage 2014 Spotlight: Enrollment Market Update
Firms and Market Structure
Enrollment by Firm. As in prior years, Medicare Advantage enrollment in 2014 tends to be highly concentrated among a small number of firms (Exhibit 12 and Table A4). In 2014, six firms or affiliates accounted for 72 percent of the market: United Healthcare (20%), Humana (17%), Blue Cross Blue Shield (BCBS) affiliated plans (17%), Kaiser Permanente (8%), Aetna (7%), and Cigna (3%). Another 6 national firms account for 5 percent of the market, including Wellcare, HealthNet, Universal American, Munich American Holding Corporation, and Wellpoint not affiliated with BCBS. The remaining enrollees are in plans offered by more locally or regionally focused firms.
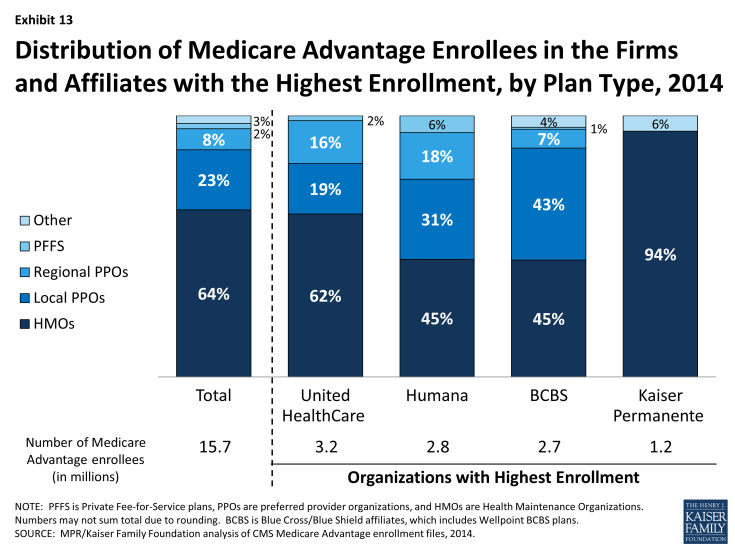
Firms differ in how they position themselves in the market, including the plan types they offer. As has been the case historically, almost all of Kaiser Permanente’s enrollees (94%) are in HMOs and the remainder are in similarly structured cost plans (Exhibit 13). In contrast, United Healthcare’s enrollment is in HMOs, local PPOs, regional PPOs, and PFFS plans, in proportions that are similar with the nationwide enrollment distribution. Compared to United Healthcare, Humana and BCBS affiliated plans have a smaller share of their enrollment in HMOs (45% for each versus 62% for United Healthcare). Humana’s distribution of enrollment across plan types continues the shift from earlier years when a much larger share of Humana’s enrollees were in PFFS plans.

Exhibit 13: Distribution of Medicare Advantage Enrollees in the Firms and Affiliates with the Highest Enrollment, by Plan Type, 2014
Each of the large national firms in the Medicare Advantage market now has a sizeable share of enrollees from group accounts. Enrollment in group plans now represents 47 percent of enrollment in Aetna, 39 percent of enrollment in Kaiser Permanente, 23 percent of enrollment in BCBS affiliated plans, 17 percent of enrollment in Humana, and 14 percent of enrollment in United Healthcare (Table A4).
Between 2013 and 2014, some firms appear to have grown their group enrollment particularly rapidly, suggesting that they had a change in employers contracting with them. Growth in the group market accounts for all of the net growth in United Healthcare’s enrollment over the past year. Wellpoint BCBS’s total Medicare Advantage enrollment would have declined in the absence of a large increase in group enrollment (from roughly 28,000 to 120,000). In contrast, enrollment in Kaiser Permanente’s individual plans grew more rapidly than its group enrollment.1 Most of the growth in Medicare Advantage enrollment is in the individual market, but enrollment through group plans increased particularly rapidly in 2014 and has been a major factor in the experience of some firms.
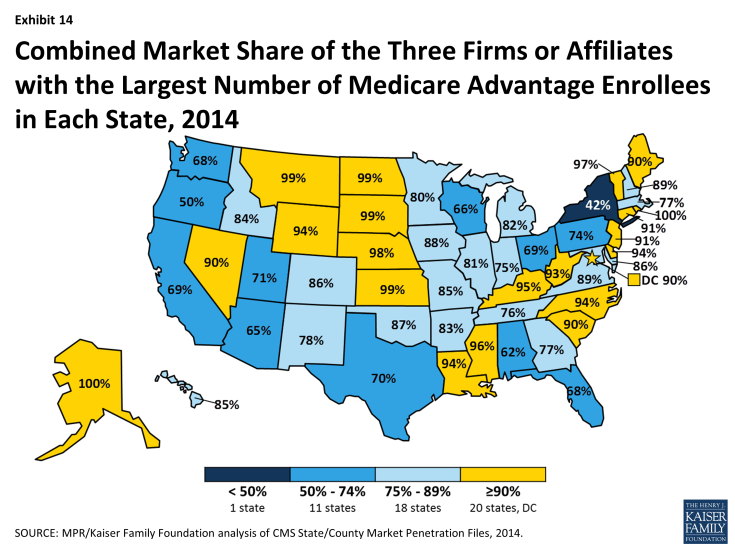
Market Concentration by State. As is the case nationally, a small number of firms also dominate Medicare Advantage enrollment in most states (Exhibit 14). In all but one state (NY), the three largest firms or affiliates account for 50 percent or more of enrollment. In 20 states and the District of Columbia, 90 percent of enrollment or more is in the three largest plans and in 18 states, 75 percent of enrollment is in the three largest plans. Some states with highly concentrated markets (three firms accounting for at least 90 percent of enrollment) have relatively low Medicare Advantage penetration rates (AK, DE, KS, MS, MT, ND, NE, SD, VT, WY), but several other such states do not (LA, NC, NV, RI).

Exhibit 14: Combined Market Share of the Three Firms or Affiliates with the Largest Number of Medicare Advantage Enrollees in Each State, 2014
In 15 states and the District of Columbia, one company has more than half of total Medicare Advantage enrollment (Table A5). United Healthcare has the largest share in 19 states and is among the top three firms in an additional 19 states and the District of Columbia. Humana has the largest enrollment in 11 states and is among the top 3 in another 18 states. Plans offered by BCBS affiliates have the most enrollees in 8 states and are among the top firms in another 16 states. Kaiser Permanente’s presence is more geographically focused than other major national firms, with a heavy concentration in California, Colorado, the District of Columbia and Maryland. Kaiser Permanente has more enrollees than any other firm in California, the District of Columbia and Maryland. Locally dominant plans, that is, those with the most Medicare Advantage enrollees in their state include EmblemHealth (CT), Martin’s Point Health are (ME), Tufts Associated HMO (MA), New West (MT), Presbyterian Healthcare Services (NM), and Medica Holding Company (ND and SD).
Enrollment Across Counties with High and Low Traditional Medicare Spending. Over the years, Congress and various Administrations have made a number of changes to payment and participation rules for private risk-bearing plans that provide Medicare benefits under contract with the federal government, now called Medicare Advantage plans. Many of these changes have revolved around plan payment levels, seeking to balance having more plans participate with parity in payments between traditional Medicare and Medicare Advantage. The latest of these changes, which is included in the ACA, varies payment policy with the level of traditional Medicare spending in counties, grouped evenly into four quartiles by cost. Payments to plans now depend on the relationship between their bids and the counties’ traditional Medicare spending and also are increased by any quality based bonus payments the plan may receive. After being frozen in 2011 at 2010 levels, benchmarks (the maximum Medicare will pay a plan) are being adjusted down so that once payments are fully phased in they will range from 95 percent of traditional Medicare spending for counties in the top quartile of spending (e.g., Miami-Dade, FL) to 115 percent of traditional Medicare spending in the bottom quartile of such spending (e.g., Boise, ID).
Despite the payment changes, enrollment continues to grow across counties in each of the four quartiles of traditional Medicare spending (Table A6). Between 2013 and 2014, enrollment grew at a relatively similar rate in aggregate across in highest quartile counties (8.3%) as in the lowest quartile counties (8.7%), and higher, but not very much differently, in the two quartiles in between (10.7% and 12.3%, respectively). In 2014, overall penetration also was not very different across quartiles (ranging from 27% to 34%). Thus, enrollment continues to grow across counties that differ in traditional Medicare spending, which is not surprising given that Medicare Advantage penetration rates have historically been high in several low cost counties (e.g., Multnomah, OR and Boise, ID) as well as high cost counties (Miami-Dade, FL and Los Angeles, CA).

