The Burden of Medical Debt: Results from the Kaiser Family Foundation/New York Times Medical Bills Survey
Section 3: Consequences of Medical Bill Problems
The impact of medical bills on families
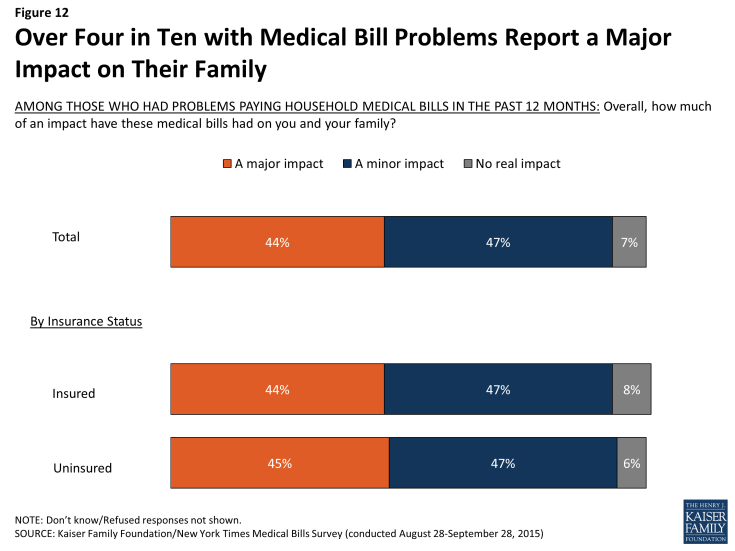
Among the roughly one-quarter of Americans ages 18-64 who report having problems paying medical bills, roughly equal shares say the impact of those bills on their families has been major (44 percent) and minor (47 percent). Relatively few (7 percent) say there has been no real impact. The survey shows that while insurance may protect people from having medical bills problems in the first place, once those problems occur the consequences are similar regardless of insurance status. Among those with medical bill problems, almost identical shares of the insured (44 percent) and uninsured (45 percent) say the bills have had a major impact on their families. Similarly, among those who had problems paying medical bills, those with higher incomes are just as likely to report that the bills had a major impact as those with lower incomes (though as noted above, people with lower incomes are more likely than those with higher incomes to report problems paying medical bills in the first place).
A few groups among those with medical bill problems are more likely to say the medical bills have had a major impact on their families, including people with bills amounting to $5,000 or more (66 percent), those who say the family member who generated the bills has a disability (57 percent), and those who describe their financial situation as not having enough to meet basic expenses (56 percent).
Among people with private health insurance, those in high-deductible plans are more likely than those in lower-deductible plans to say the bills had a major impact on their family (49 percent versus 35 percent), which may be related to the fact that high deductible plan enrollees report having higher bills on average. About two-thirds (64 percent) of those in high-deductible plans say their bills amounted to $2,500 or more, compared to four in ten with lower-deductible plans (40 percent).
Sacrifices made to pay medical bills
Even among those with health insurance, people who’ve faced medical bill problems report making various sacrifices in order to pay these bills, including significant changes to their employment, financial situation, or lifestyle. Overall, about seven in ten report cutting back or delaying vacations or major household purchases (72 percent) as well as reducing spending on food, clothing and basic household items (70 percent). About six in ten (59 percent) say they used up all or most of their savings in order to pay medical bills. Substantial shares say that someone in their household took on an extra job or worked more hours (41 percent), borrowed money from family and friends (37 percent), or increased their credit card debt (34 percent). Roughly a quarter (26 percent) say they took money out of a retirement, college, or other long-term savings account. Smaller – but not inconsequential – shares say they changed their living situation (17 percent), took out another type of loan (15 percent), borrowed from a payday lender (13 percent), or sought the aid of a charity or non-profit (12 percent) in order to pay medical bills. Very few (2 percent) report taking out a second mortgage on their home.
These sacrifices are reported by people in all walks of life, and not just the uninsured or those with precarious financial situations. In fact, people who have problems paying medical bills despite having health insurance are more likely than the uninsured with medical bill problems to say they’ve put off vacations or major household purchases (77 percent versus 64 percent), cut back spending on food, clothing, or basic household items (75 percent versus 62 percent), used up all or most of their savings (63 percent versus 51 percent), increased their credit card debt (38 percent versus 24 percent), or taken money out of long-term savings (31 percent versus 17 percent) in order to pay medical bills. The opposite is true in one case; the uninsured with medical bill problems are more likely than those with insurance to say they had to change their living situation in order to pay these bills (23 percent versus 14 percent).
| Table 3: Many Insured and Uninsured Report Taking Actions to Pay Medical Bills | |||
| Among those who had problems paying medical bills in past 12 months | |||
| Percent who say they or someone else in their household has done each of the following in the past 12 months in order to pay medical bills: | Total | Insured | Uninsured |
| Put off vacations or other major household purchases | 72% | 77% | 64% |
| Cut back spending on food, clothing, or basic household items | 70 | 75 | 62 |
| Used up all or most of savings | 59 | 63 | 51 |
| Taken an extra job or worked more hours | 41 | 42 | 40 |
| Borrowed money from friends or family | 37 | 37 | 38 |
| Increased credit card debt | 34 | 38 | 24 |
| Taken money out of retirement, college, or other long-term savings accounts | 26 | 31 | 17 |
| Changed your living situation | 17 | 14 | 23 |
| Taken out another type of loan | 15 | 17 | 11 |
| Borrowed money from a payday lender | 13 | 15 | 12 |
| Sought the aid of a charity or non-profit organization | 12 | 11 | 15 |
| Taken out another mortgage on home | 2 | 1 | 2 |
| Made other significant changes to way of life | 15 | 15 | 16 |
In addition to the sacrifices listed above, fifteen percent of people who had problems paying medical bills report making other significant changes to their way of life in order to pay these bills.
In their own words: What other significant changes did you make in your way of life in order to pay these medical bills?
- “Apartment instead of house. Not getting groceries some weeks to get by.”
- “Charges for my insulin exceeded $1200 a month (3 times the amount of my house payment). I had to reduce the amount of insulin I took based on what I could afford; my health was negatively impacted as a result.”
- “Cold showers, can’t fix plumbing. Other needed repairs have been patched as best as possible but not fixed.”
- “Medical Insurance / bills was the deciding factor in a job change. I gave up other benefits to choose a job that had the best medical coverage.”
- “Sold everything we could spare.”
- “Can’t take the kids anywhere. Wish I could do more for my kids!”
- “I need physical therapy after shoulder repair but I couldn’t afford to finish it. I wish I could have.”
- “I am losing my house.”
- “I’ve cut back on just about everything for my family and the way we live.”
Effects of medical bills on ability to get needed health care
For many, problems paying household medical bills can impact their ability to get (or continue getting) the health care services they need. Overall, about three in ten (31 percent) of those who faced problems paying medical bills say they had problems getting other health care they needed directly as a result of these problems. While the problem is worse for those without insurance – among whom 41 percent say they had trouble getting needed care because of medical bills – it is also reported by about a quarter (26 percent) of those who had insurance when their medical bill problems occurred.
More broadly, many of those with medical bill problems report delaying or skipping health care over the past 12 months because of the cost – at rates 2 to 3 times those of their counterparts who did not have problems paying medical bills, regardless of their insurance status. For example, among those with health insurance, 43 percent of those with medical bill problems say there was a time in the past year when they or a family member did not get a recommended medical test or treatment because of the cost, compared with just 13 percent of those without such medical bill problems. Similarly, 41 percent of the insured who faced medical bill problems say they did not fill a prescription in the past 12 months because of the cost, compared with 14 percent of those with health insurance who did not have bill problems. Access to dental care can be affected, too; among those with health insurance, 62 percent of those with medical bill problems report postponing dental care in the previous year due to cost, compared with 29 percent of those without such problems.
| Table 4: Those with Medical Bill Problems More Likely to Report Skipping or Delaying Care | ||||||
| Total | Insured | Uninsured | ||||
| Percent who say they or another family member living in their household have done each of the following in the past 12 months because of the COST: | Medical bill problems | No medical bill problems | Medical bill problems | No medical bill problems | Medical bill problems | No medical bill problems |
| Put off/postponed getting dental care/check-ups | 65% | 31% | 62% | 29% | 72% | 42% |
| Relied on home remedies/over the counter drugs instead of going to see a doctor | 62 | 32 | 58 | 30 | 71 | 44 |
| Put off/postponed getting health care you needed | 60 | 22 | 58 | 21 | 65 | 37 |
| Not filled a prescription for medicine | 43 | 14 | 41 | 14 | 45 | 13 |
| Not gotten a medical test/treatment that was recommended by a doctor | 43 | 13 | 43 | 13 | 43 | 13 |
| Chosen a less expensive treatment than the one your doctor recommended | 40 | 15 | 38 | 14 | 47 | 26 |
| Cut pills in half/skipped doses of medicine | 34 | 9 | 32 | 9 | 39 | 13 |
| Skipped/postponed rehabilitation care that your doctor recommended | 22 | 5 | 20 | 5 | 28 | 6 |
Effects of medical bills on household finances and ability to afford basic needs
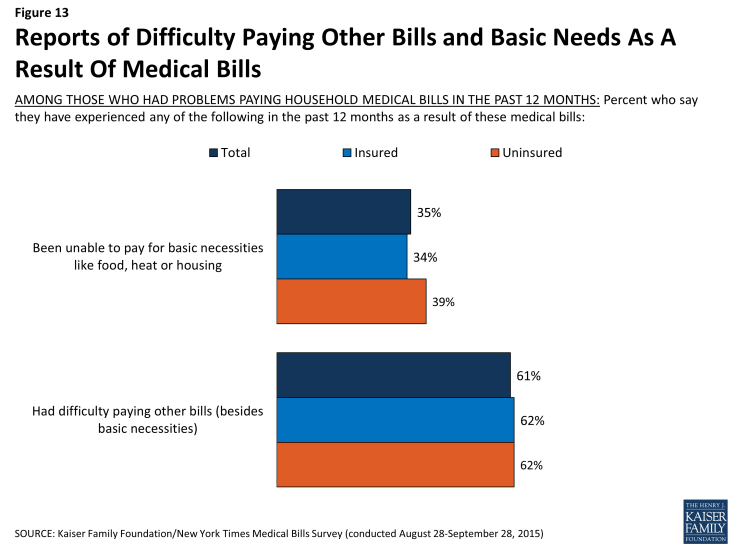
Medical bills can also lead to problems meeting other financial obligations and paying for basic necessities. Among those with medical bill problems, about six in ten of both the insured (62 percent) and the uninsured (62 percent) say they’ve had difficulty paying other bills as a result of medical debt. Over a third in each group (34 percent of the insured and 39 percent of the uninsured) say they were unable to pay for basic necessities like food, heat, or housing as a result of medical bills.
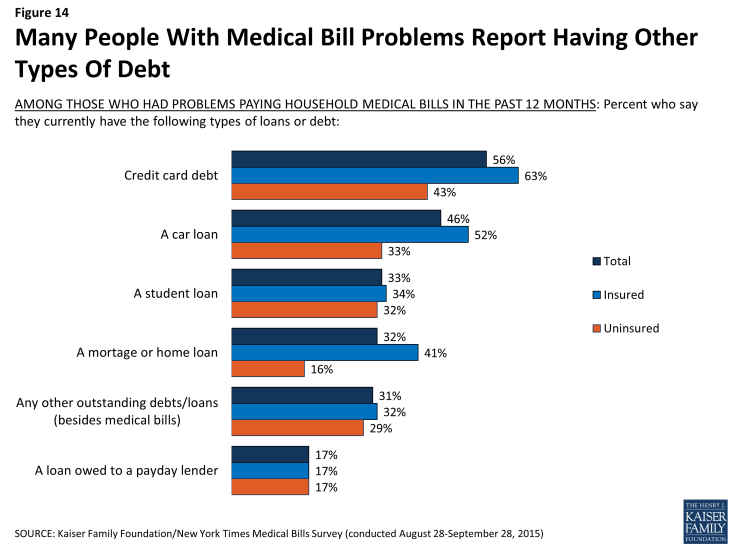
Although this survey focuses on the problems Americans face in paying medical bills, for many, medical bills represent just one source of bills or debt. Most of those with medical bill problems report having other kinds of debt, including credit card debt (56 percent), car loans (46 percent), student loans (33 percent), mortgages (32 percent), payday loans (17 percent), and other outstanding loans (31 percent). Among those with medical bill problems, those with health insurance are more likely than those without insurance to report having credit card debt (63 percent versus 43 percent), a car loan (52 percent versus 33 percent), or a mortgage (41 percent vs. 16 percent), which may reflect better access to these types of credit among the insured group. However, similar shares of the insured and uninsured report having a student loan (34 percent of the insured and 32 percent of the uninsured) and a loan owed to a payday lender (17 percent each).
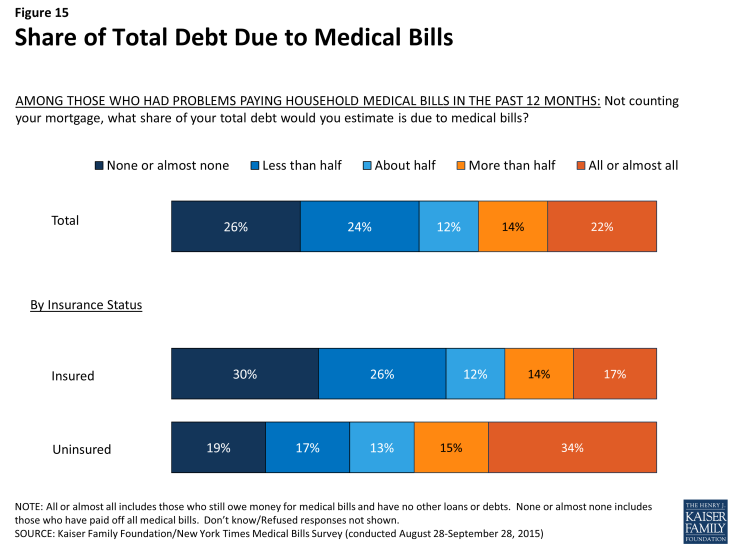
For some of those with problems paying medical bills, medical debt makes up a large share of their total debt. About one in five (22 percent, including 17 percent of the insured and 34 percent of the uninsured) say their medical bills represent all or almost all of their total non-mortgage debt. By contrast, just over half (56 percent) of the insured and about a third (36 percent) of the uninsured say they have either paid off all their medical bills, or that medical debt makes up less than half of their total debt.
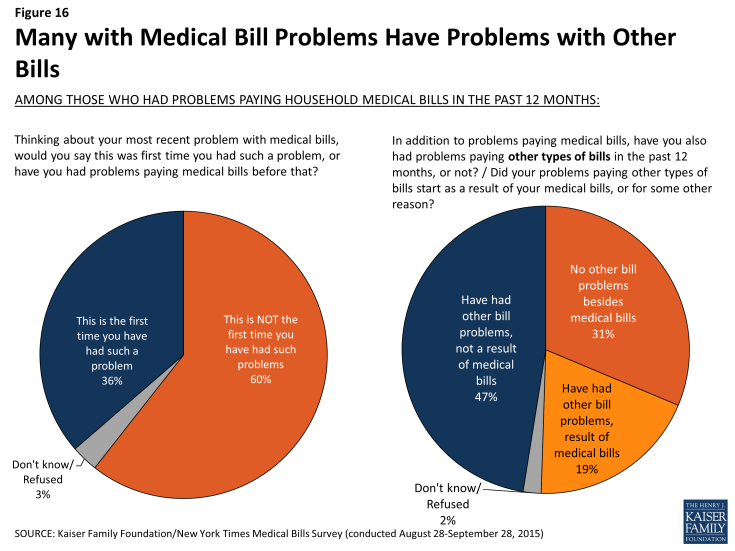
The survey also finds that once medical bill problems start, it can be difficult to make them stop, and that for some, medical bills can start a cascade of other bill problems. Six in ten (60 percent) say this is not the first time they’ve faced medical bill problems, a share that is even higher among those who say their bills are the result of an ongoing health problem (67 percent) and those who say the family member who generated the bills has a disability (69 percent).
Further, while almost half (47 percent) say they’ve also had problems paying other unrelated bills in the past year, medical bills appear to be either the sole problem or the main trigger of bill problems for the other half, including 31 percent who say they’ve only had problems with medical bills, not other types of bills, and 19 percent who say their problems paying other bills started as a result of their medical bills.
Financial consequences of struggling to make payments
Many of those who’ve faced household medical bill problems report struggling to make payments, both for their medical bills and for other bills. Six in ten (61 percent) say they have been late on a payment for a medical bill, and almost as many (56 percent) say they’ve missed a payment. Similar shares report being late or missing payments for other (non-medical) bills (56 percent and 46 percent, respectively). Once a person has problems paying medical bills, their insurance status appears to make little difference in their ability to pay bills on time. Among those with medical bill problems, similar shares of the insured and uninsured say they’ve been late on a payment (62 percent and 63 percent, respectively) or missed a payment (55 percent and 61 percent) for a medical bill in the past year.
Far fewer, though still roughly two in ten, say they’ve defaulted on a loan for a medical bill (17 percent), including a somewhat higher share of the uninsured (23 percent) compared to those with insurance (15 percent).
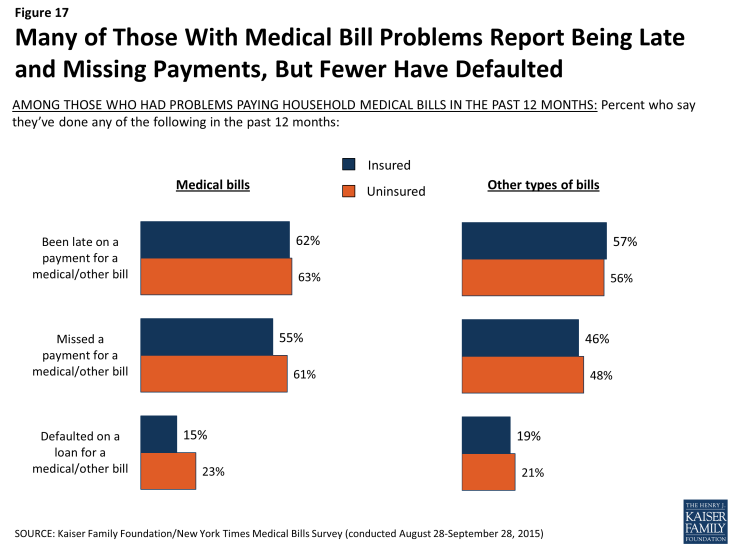
Figure 17: Many of Those With Medical Bill Problems Report Being Late and Missing Payments, But Fewer Have Defaulted
Likely as a result of missed or late payments, almost six in ten (58 percent) of those with medical bill problems say they’ve been contacted by a collection agency in the past year, mostly because of medical bills alone (25 percent) or a combination of medical bills and some other type of debt (20 percent). Again, once medical bill problems start, insurance offers little protection against such follow-up, with similar shares of the insured (56 percent) and uninsured (63 percent) saying they’ve been contacted by a collections agency in the past 12 months.
| Table 5: Many With Medical Bill Problems Report Being Contacted by Collection Agency | |||
| Among those who had problems paying medical bills in past 12 months | |||
| Have you or someone else in your household been contacted by a collection agency in the past 12 months for any reason, or not? Was that because of medical bills, some other type of bills, or both? | Total | Insured | Uninsured |
| Yes, contacted by collection agency | 58% | 56% | 63% |
| Because of medical bills | 25 | 26 | 22 |
| Because of some other type of bills | 12 | 10 | 15 |
| Because of both | 20 | 19 | 24 |
| No, not contacted by collection agency | 41 | 44 | 34 |
| NOTE: Don’t know/Refused responses not shown. | |||
An indication of more serious financial problems, a small share (2 percent) of those with household medical bill problems say they’ve declared personal bankruptcy in the past year, and another 16 percent report declaring bankruptcy longer than 12 months ago. Overall, 11 percent say they’ve declared bankruptcy at some point and that medical bills were at least a partial contributor to their bankruptcy. Among those with medical bill problems, reports of having declared bankruptcy are similar among the insured (21 percent) and those without health insurance (14 percent).
| Table 6; Almost One-Fifth With Medical Bills Problems Have Declared Bankruptcy | |||
| Among those who had problems paying medical bills in past 12 months | |||
| Have you ever declared personal bankruptcy, or not? Did you declare bankruptcy mainly because of medical bills, mainly because of some other type of debt, or both? | Total | Insured | Uninsured |
| Declared bankruptcy in the past 12 months | 2% | 3% | 1% |
| Declared bankruptcy more than 12 months ago | 16 | 18 | 12 |
| Total declared bankruptcy (NET) | 18 | 21 | 14 |
| Because of medical bills | 3 | 3 | 3 |
| Because of some other type of bills | 7 | 9 | 4 |
| Because of both | 8 | 10 | 7 |
| Never declared bankruptcy | 82 | 79 | 86 |
| NOTE: Don’t know/Refused responses not shown. | |||

