Economic and Fiscal Trends in Expansion and Non-Expansion States: What We Know Leading Up to 2014
Medicaid is the nation’s primary health insurance program for low-income and high-need Americans. Because of the program’s joint federal-state financing structure, Medicaid has a unique role in state budgets because it is both an expenditure item and a source of federal revenue for states. States have significant flexibility within broad federal rules to administer their Medicaid programs. Policy decisions, as well as other factors such as the economy, demographics and state tax capacity are key factors in determining the types and amounts of revenue that states collect as well as how they budget those funds across programs.
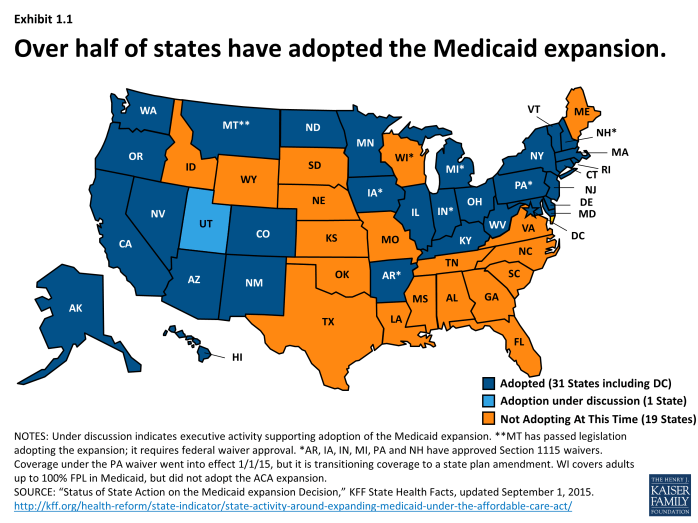
Under the Affordable Care Act (ACA), Medicaid was expanded to nearly all adults with incomes at or below 138 percent FPL. However, the June 2012 Supreme Court decision effectively made the Medicaid expansion optional for states. As of September 1, 2015, 31 states including DC have adopted the Medicaid expansion.1 (Exhibit 1.1) For those that expand, the federal government pays 100 percent of the Medicaid costs for those newly eligible from January 2014 through December 2016. The federal share then phases down gradually to 90 percent in 2020 and remains at that level thereafter, well above traditional rates. The effects of the Medicaid expansion on state budgets and economies have been key issues for policy makers.
This brief, prepared with the Rockefeller Institute of Government, the public policy research arm of the State University of New York, is designed to provide some insight into the underlying economic and fiscal conditions in expansion and non-expansion states leading up to 2014. Analysis focuses on the typical (i.e. median) state for each group. This analysis will provide a framework against which to measure the impact of expansion decisions going forward. The sections focus on: demographics, tax capacity and revenue, state budgets and employment. Key findings include:
- The typical expansion state was in a better position across the factors analyzed leading up to the ACA Medicaid expansion in 2014.
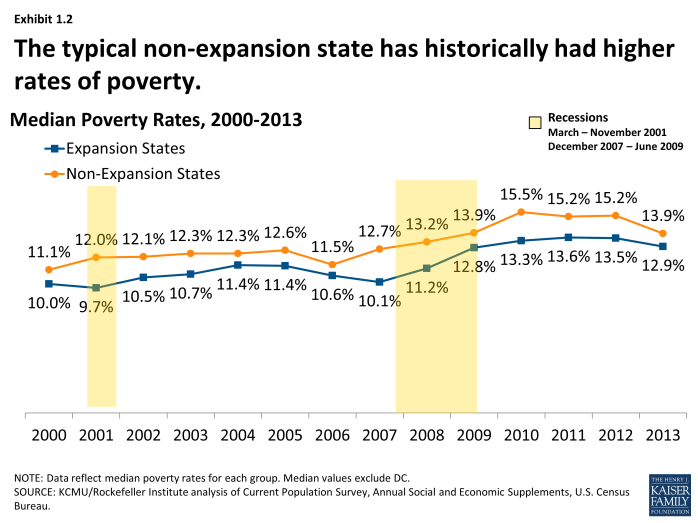
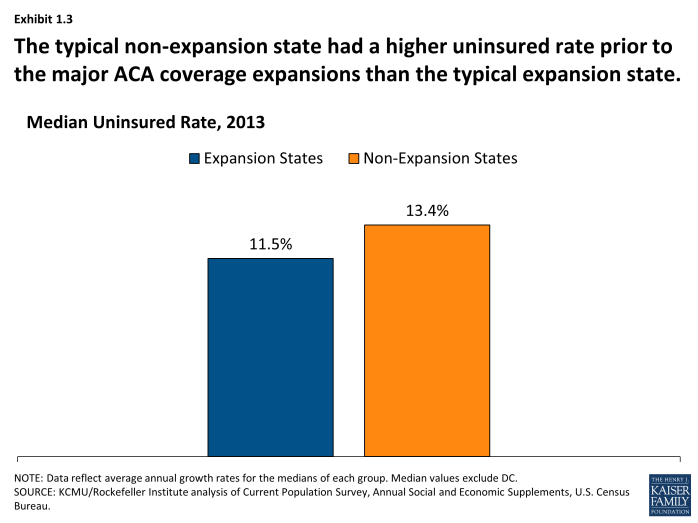
- Median poverty and uninsured rates were higher in non-expansion states. (Exhibit 1.2), (Exhibit 1.3)
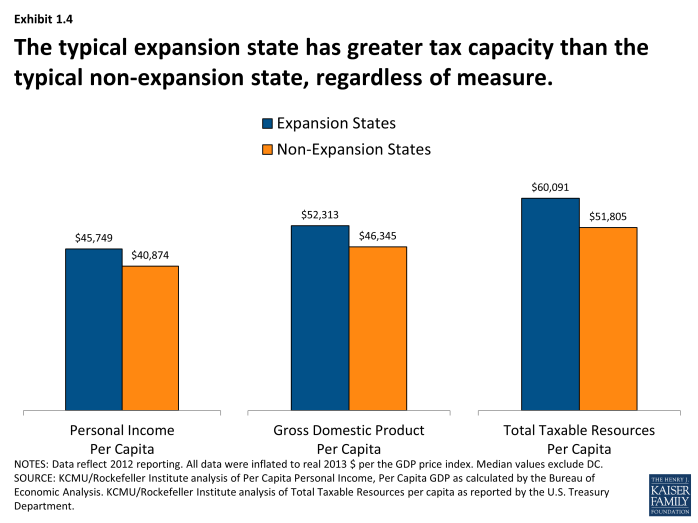
- Across different measures, the median tax capacity for expansion states has been higher. (Exhibit 1.4)
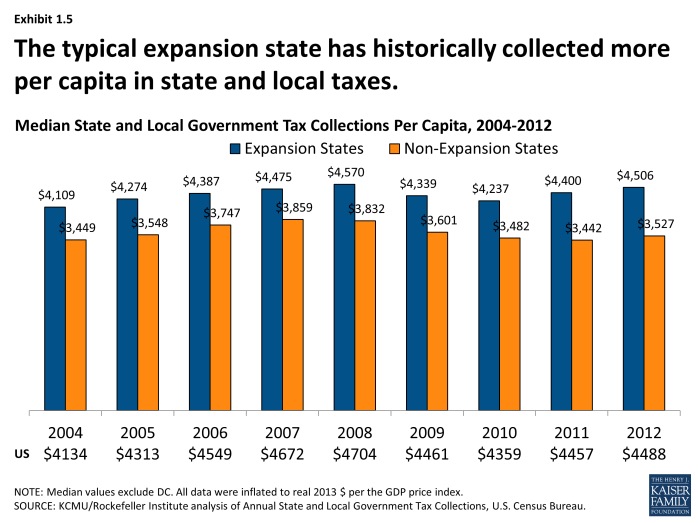
- Median tax collections per capita have historically been higher in expansion states. (Exhibit 1.5)
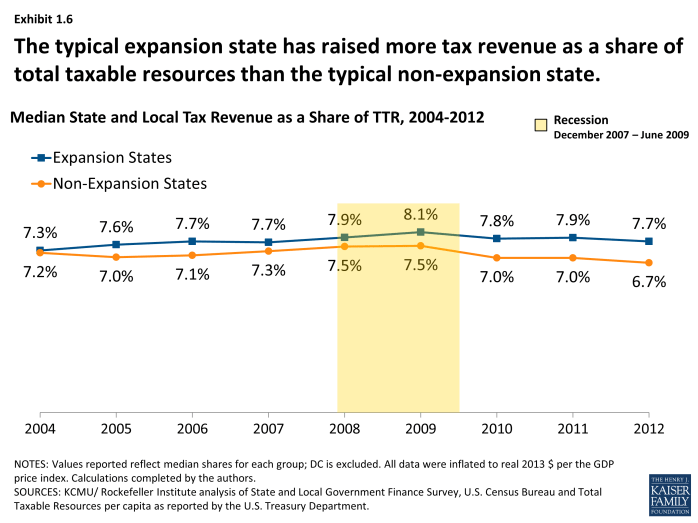
- The typical expansion state has historically raised more tax revenue as a share of available resources; the gap between these two groups has increased over time. (Exhibit 1.6)
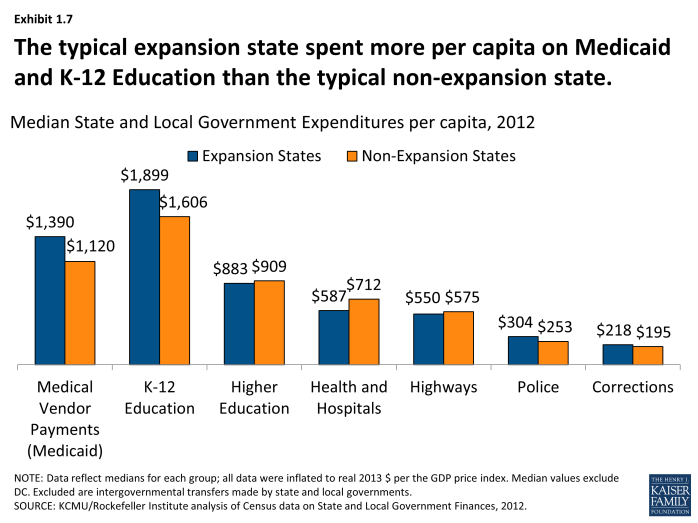
- The typical expansion state spent more per capita on Medicaid and K-12 education prior to the major ACA coverage expansions. (Exhibit 1.7)
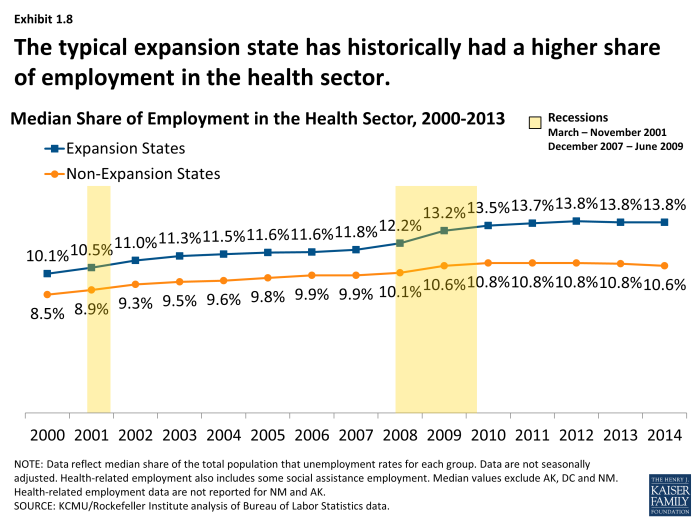
- Health-related employment remained strong during the recession for both groups of states; the typical expansion state has historically had a higher share of employment coming from the health sector. (Exhibit 1.8)


