THE UNINSURED A PRIMER 2013 – 1: How Did Most Americans Obtain Health Insurance in 2012?
More than half (56%) of people in the United States under age 65 receive health insurance coverage as an employer benefit. While Medicare covers virtually all those who are 65 years or older, the nonelderly who do not have access to or cannot afford private insurance now go without health coverage unless they qualify for insurance through the Medicaid program, Children’s Health Insurance Program (CHIP), or a state-subsidized program. The gaps in our private and public health insurance systems leave over 47 million nonelderly people in the country—18% of those under age 65—without health coverage. The risk of being uninsured is greatest for those with the lowest incomes (Figure 2). Health reform targets this population through federal subsidies to help purchase private insurance coverage and expanded eligibility for Medicaid.
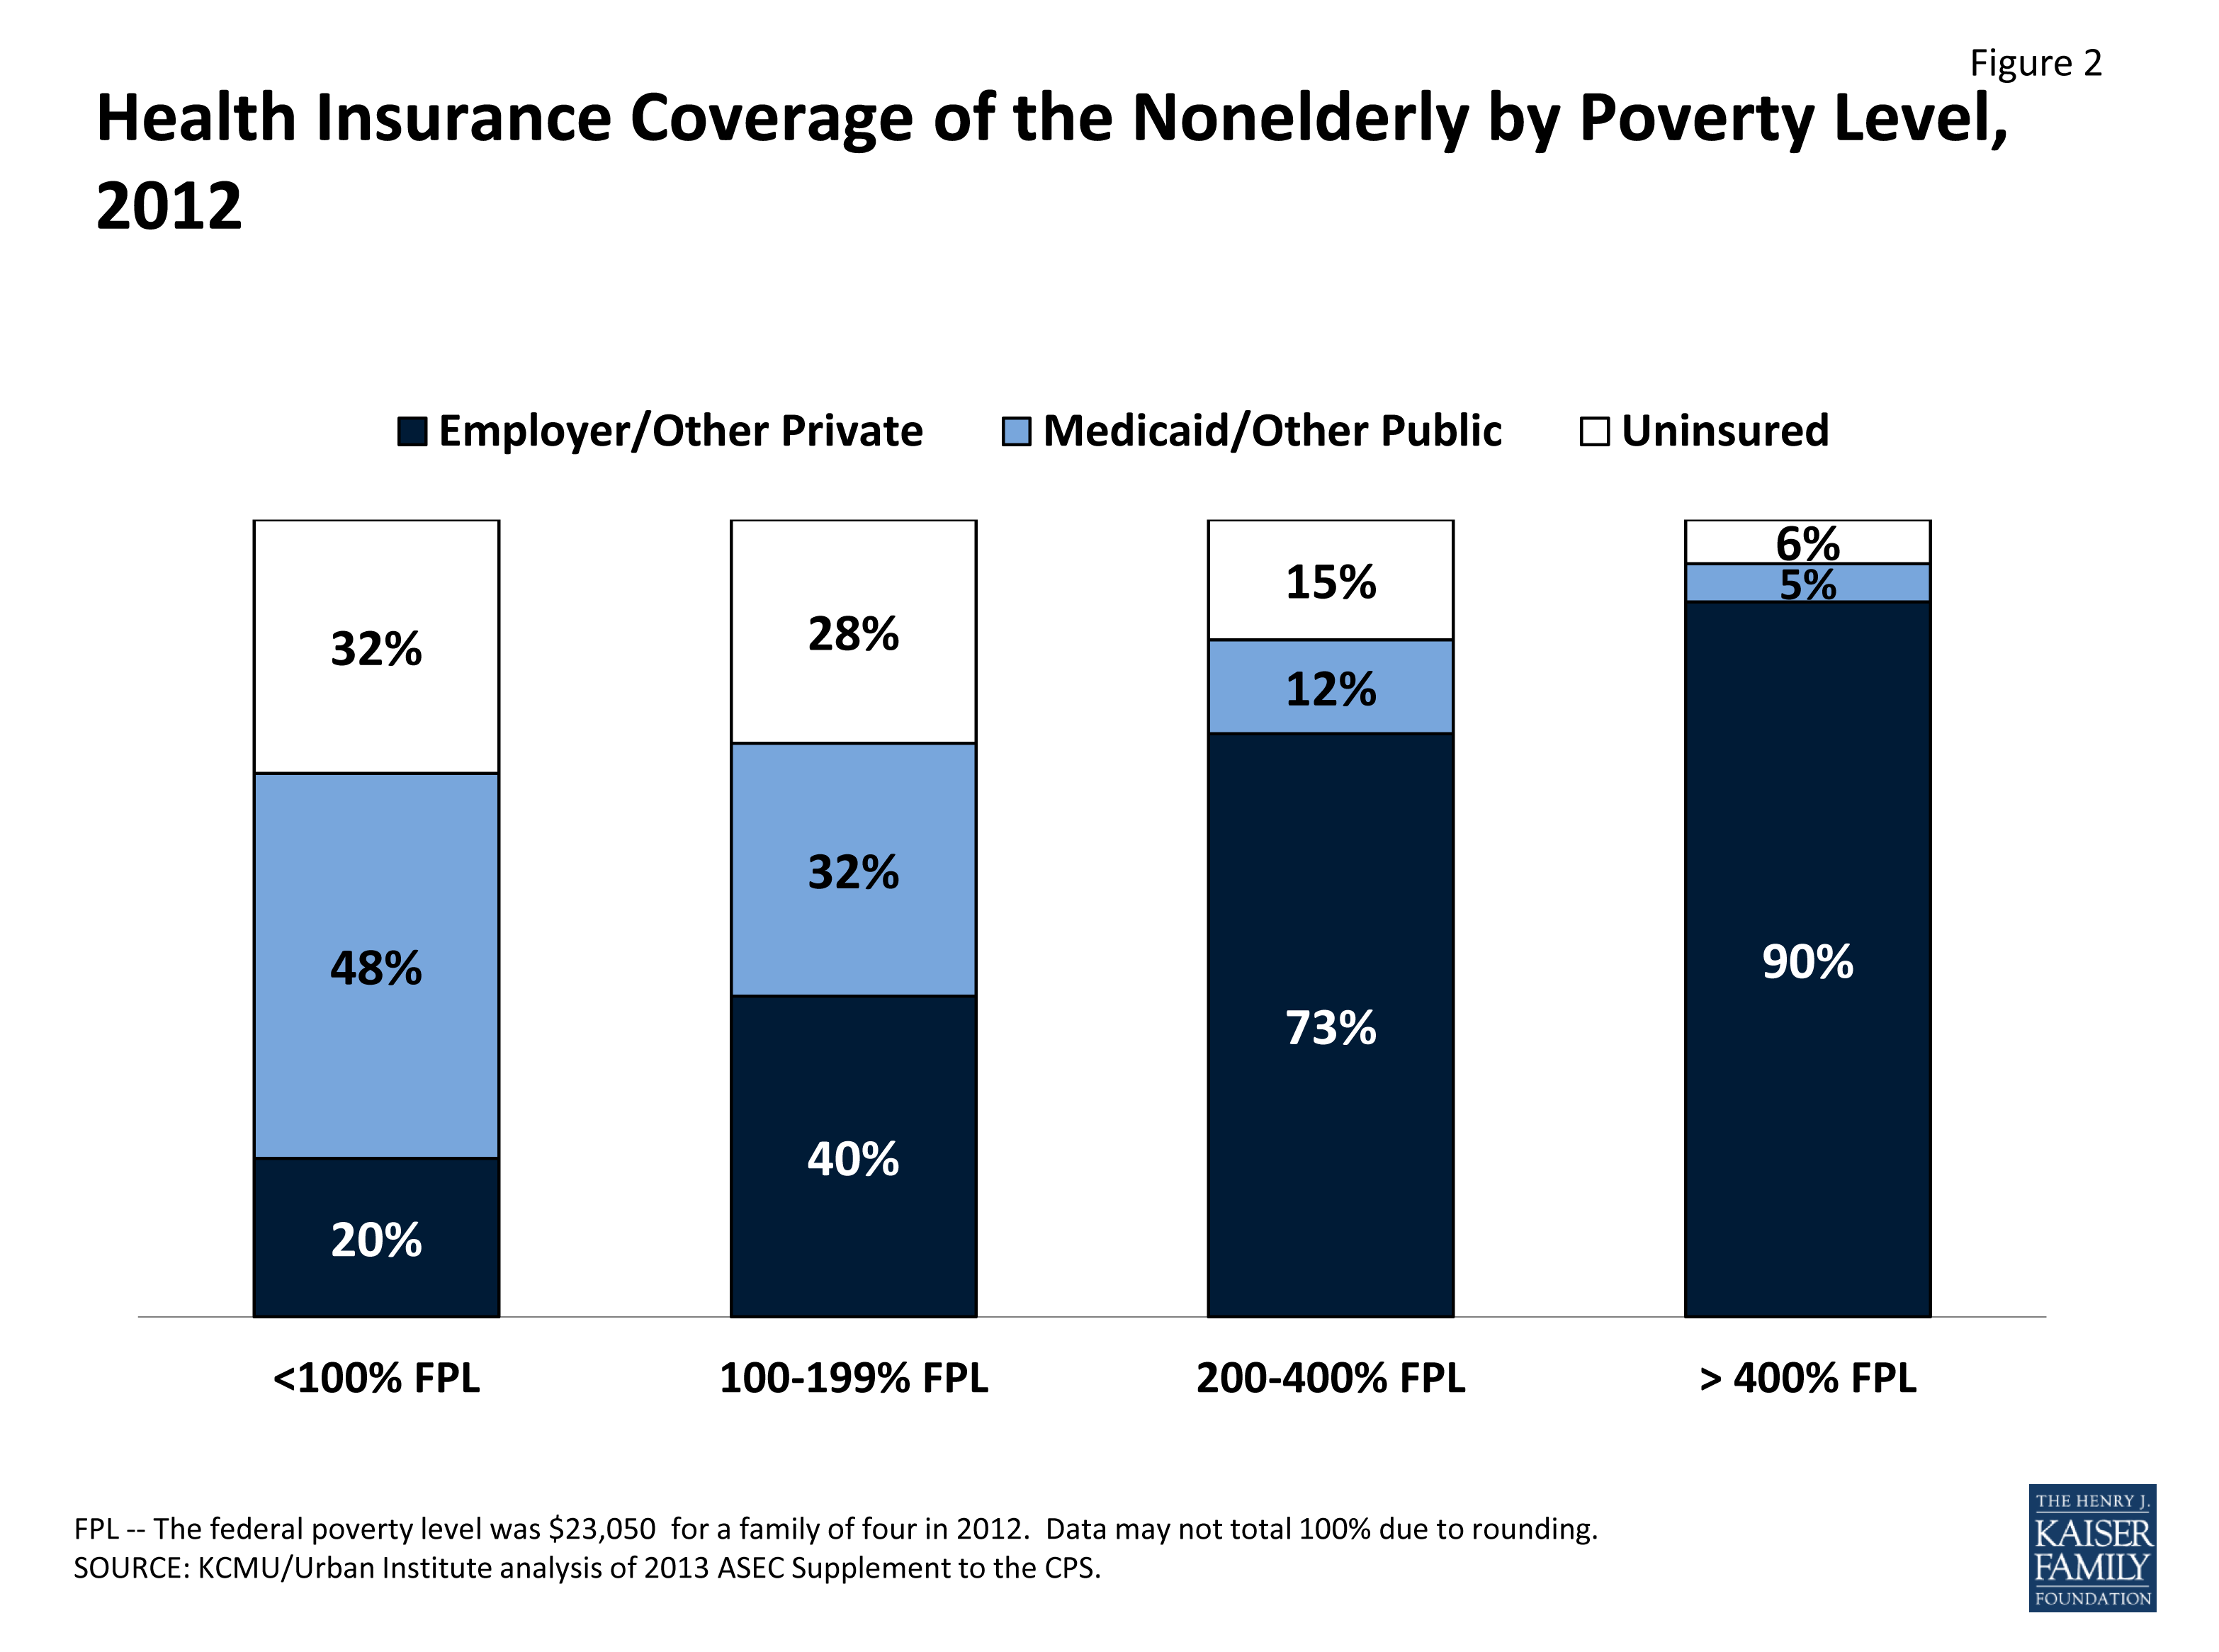
Figure 2: Health Insurance Coverage of the Nonelderly by Poverty Level, 2012
Employer-Sponsored Health Insurance Coverage
The majority of employers offer group health insurance policies to their employees and to their employees’ families. In 2013, 57% of firms offer coverage to their employees.1 Among individuals with employer-sponsored coverage, half are covered by their own employer and half are covered as an employee’s dependent.2 Health insurance offer rates vary among businesses, with large firms and those with more high-wage workers being more likely to offer coverage.
However, many workers do not have access to employer-sponsored insurance. Currently, businesses are not legally required to offer a health benefit. The majority of uninsured workers are not offered health insurance by their employer.3 Some people work in firms that cover some employees but are not themselves eligible for coverage, often because they have not worked for their employer for a sufficient amount of time or because they do not work enough hours. Among firms that offer health benefits in 2013, an average of 77% of their workers are eligible for coverage.4
The cost of employer-sponsored coverage is the most common reason employers cite for not offering health coverage.5 In 2013, annual employer-sponsored premiums averaged $5,884 for individual coverage and $16,351 for family coverage. Total family premiums, as well as the employee’s share of those premiums, have risen by over 70% in the last ten years.
Firms with many low-wage workers are less likely to offer coverage than firms with fewer low-wage workers. In 2013, only 23% of firms that had a high proportion (>35%) of low-wage employees offered health insurance.6 By comparison, 60% of firms with a low proportion of low-wage employees offered health insurance. However, when offered coverage, the majority of all employees choose to enroll.
Small firms are less likely to offer coverage than large firms. Nearly all businesses (99%) with at least 200 workers offer health benefits to their workers in 2013, but only 57% of firms with less than 200 workers offer these benefits.7 On average, small firms ask employees to contribute a lower amount annually towards their own health benefits compared to large firms ($862 vs. $1,065 per year). However, small firms ask for larger annual contributions for family coverage ($5,284 vs. $4,226).
The majority of employees participate in their employer’s health plan when they are offered coverage. Even when businesses offer health benefits, some employees do not sign up because of difficulty affording the required employee share of the premium. Approximately three-quarters of employees eligible for employer-sponsored insurance enrolled in 2008 and 2009, though the take-up rate of employer-sponsored coverage decreased slightly over the last ten years.8
Employer-sponsored coverage is unaffordable for many families. Even when workers can afford coverage for themselves, the cost of health insurance for their families is often prohibitive. Employees in firms with many low-wage workers are typically asked to contribute a larger share of the insurance premium for family coverage than employees of firms with fewer low-wage workers (39% vs. 29% of the premium costs for family coverage).9 Dependents account for about half of enrollees in employer-sponsored coverage, and the number of people with dependent coverage has declined over time with the decline in employer-sponsored coverage.10
Health coverage varies both by industry and by type of occupation. Across industries, uninsured rates for workers range from 39% in agriculture to just 7% in public administration.11 But even in industries where uninsured rates are lower, the gap in health coverage between blue and white-collar workers is often two-fold or greater (Figure 3). More than 80% of uninsured workers are in blue-collar jobs.
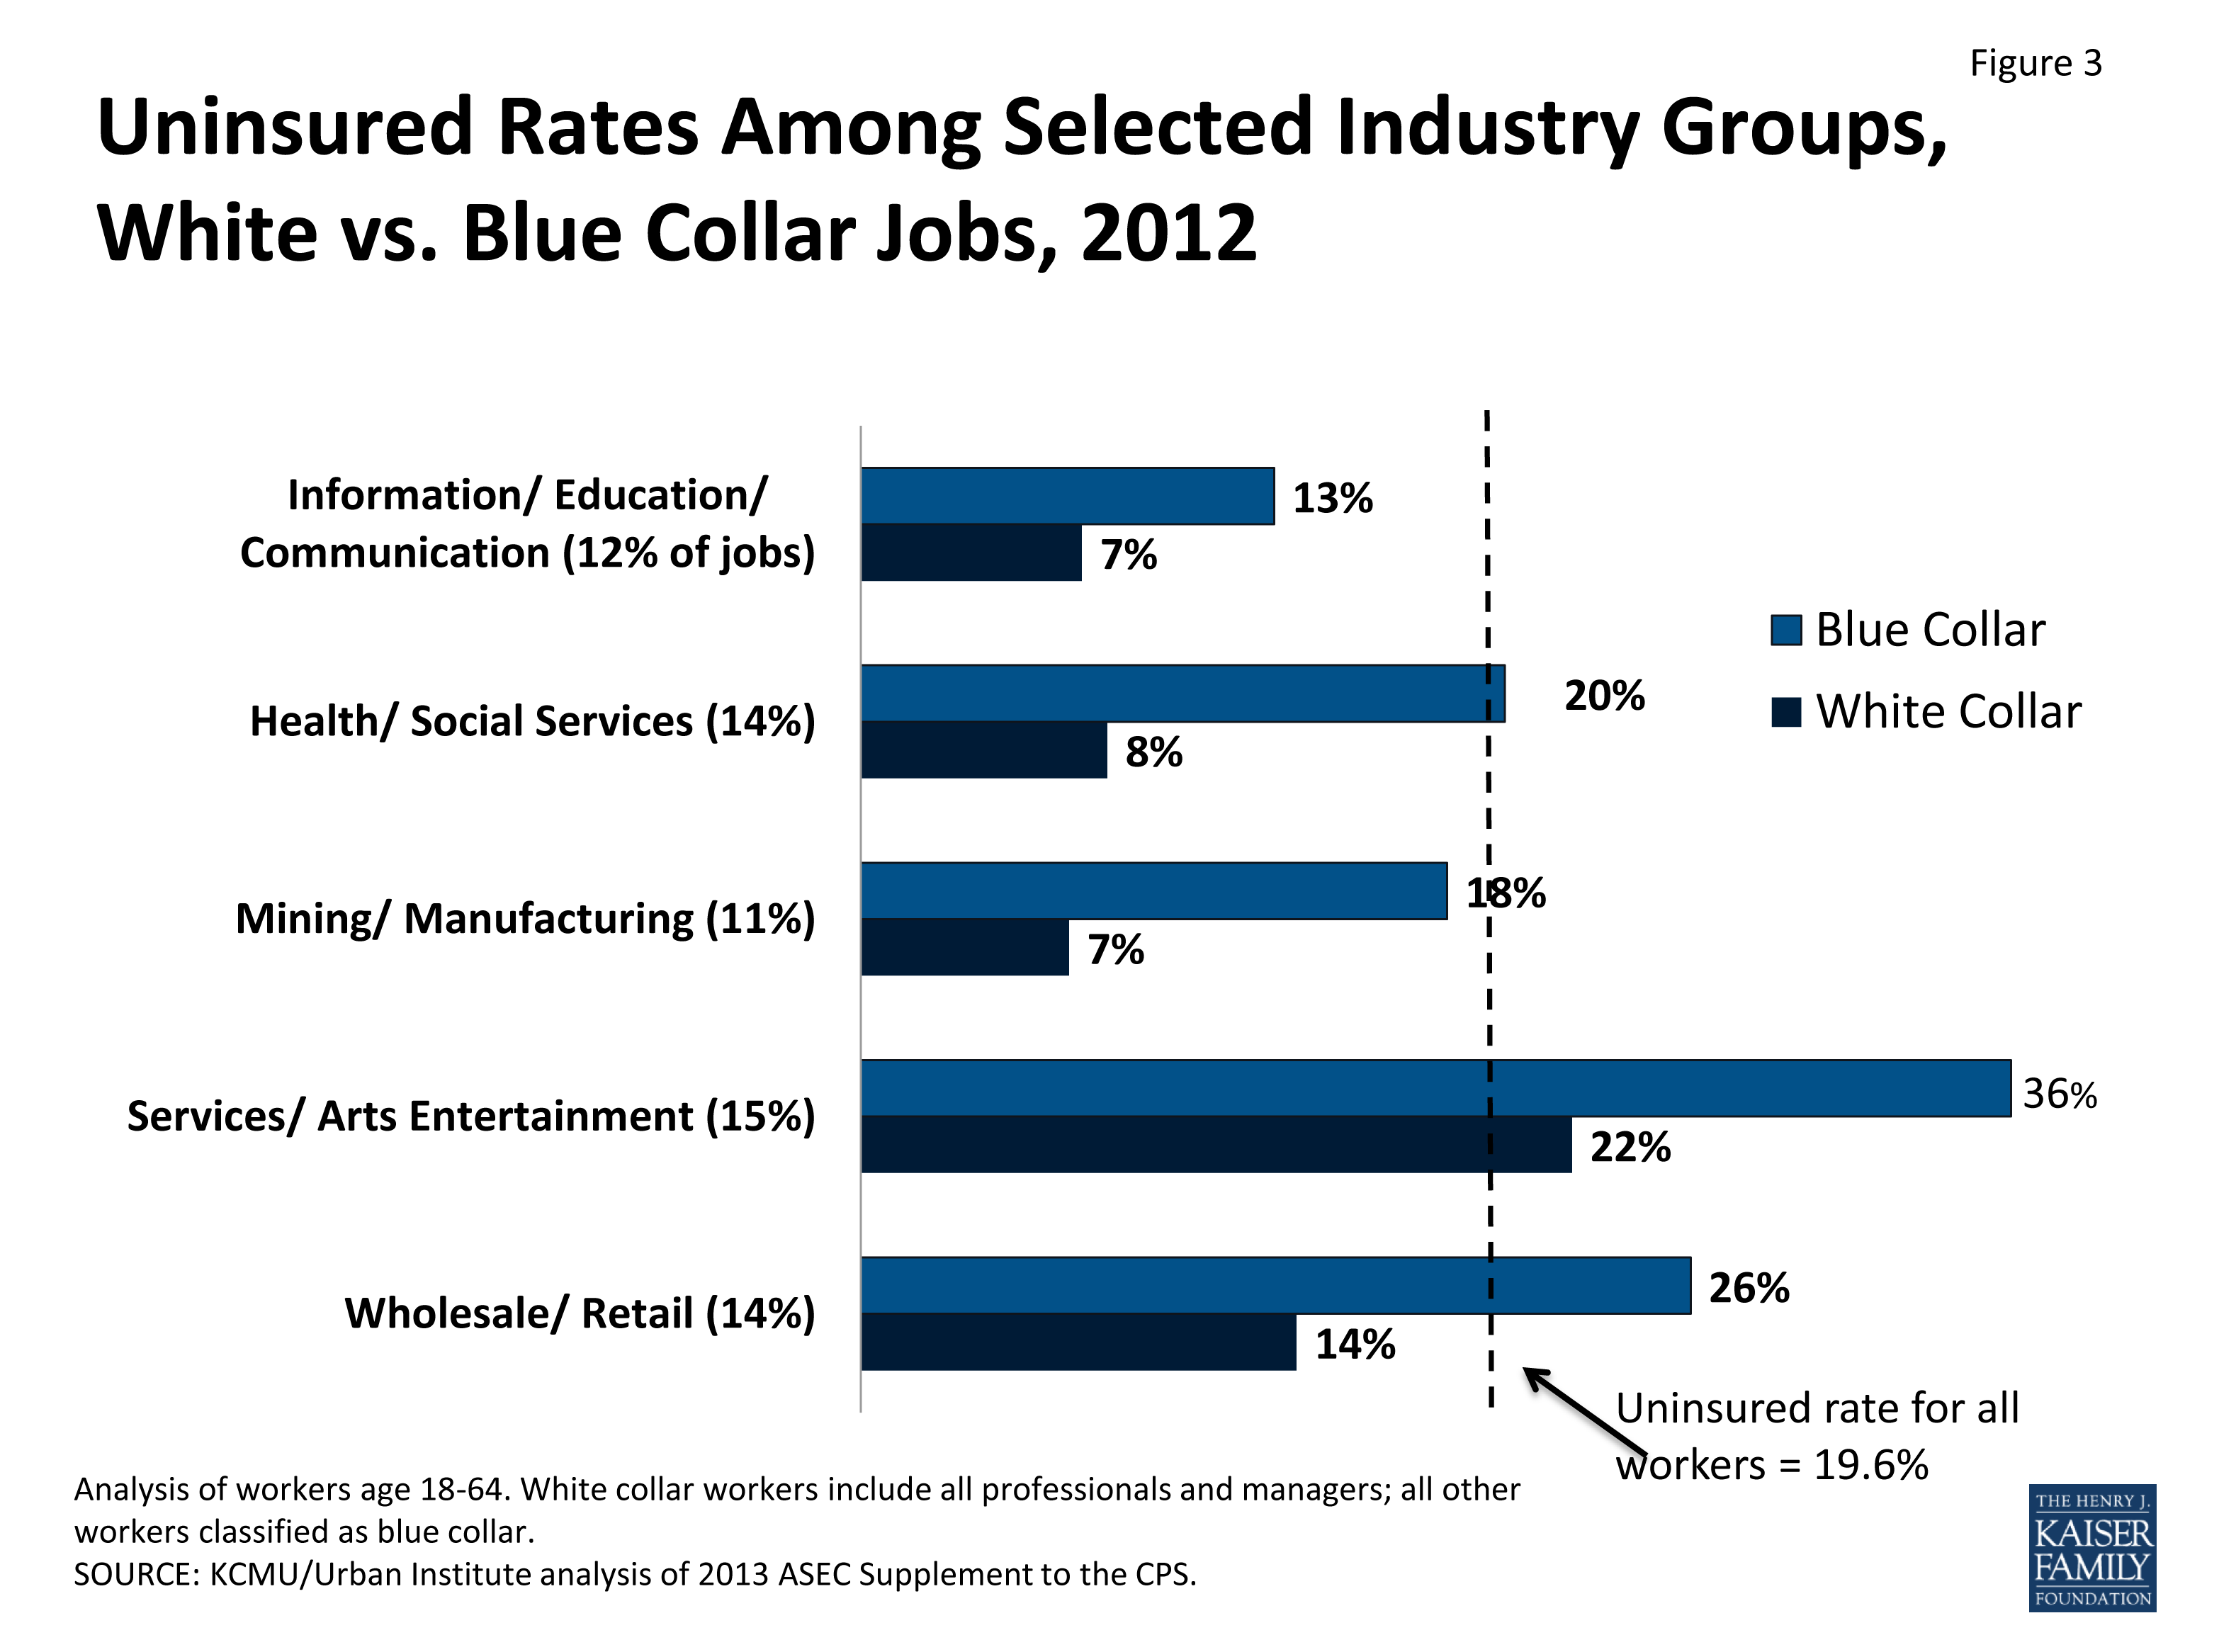
Figure 3: Uninsured Rates Among Selected Industry Groups, White vs. Blue Collar Jobs, 2012
Non-Group Health Insurance Coverage
Private policies directly purchased in the non-group or individual market (i.e., outside of employer-sponsored benefits) cover only 5.8% of people under age 65. The share of the nonelderly population with private non-group insurance has changed very little over time. However, after 2014, state based Marketplaces and premium tax credits will increase access to non-group coverage for many uninsured individuals and families.
Non-group insurance premiums can be more expensive for the enrollee than group plans purchased by employers. Though, on average, non-group insurance premiums are lower than those for employer-sponsored coverage, enrollees pay 100% of the cost because they cannot share that premium expense with an employer. Nationwide, the average monthly premium per person in the non-group market in 2010 was $215, with substantial variation by state.12 Vermont and Massachusetts both had average per member per month premiums over $400, compared to less than $160 in Alabama and California. In addition, deductibles and other cost sharing in non-group plans are often higher than in employer-sponsored coverage. Beginning in 2014, most people with incomes from above 138% to 400% of the federal poverty level who cannot access affordable employer-sponsored insurance will receive financial assistance to purchase coverage through Health Insurance Marketplaces.
Obtaining coverage in the individual market can be difficult, particularly for those who are older or have had health problems. Historically, premiums in the non-group market could vary by age or health status, and people with health problems or at risk for health problems could be charged high rates, offered only limited coverage, or denied coverage altogether. In 2008, 29% of individuals age 60 to 64 who applied for non-group insurance were denied coverage based on their health status.13 Starting in 2014, insurers will be barred from taking pre-existing conditions into account when issuing policies for adults. Beginning in September 2010, the ACA prohibited individual and group health plans from denying children coverage based on pre-existing medical conditions and from containing pre-existing condition benefit exclusions for children.
Public Health Insurance Coverage
Medicaid and CHIP currently provide coverage to some, but not all, low-income individuals and people with disabilities. Medicaid and CHIP cover 17.9% of the nonelderly population by primarily covering four main categories of low-income individuals: children, their parents, pregnant women, and individuals with disabilities. Individuals who do not fall into one of the categorical groups—most notably adults without dependent children—have generally been ineligible for public coverage regardless of their income.
Medicaid and CHIP are particularly important sources of coverage for children. Currently, federal law requires state Medicaid programs to cover school age children up to 100% of the poverty level (133% for preschool children), and states have expanded coverage for children in families with slightly higher incomes through the Children’s Health Insurance Program (CHIP). Medicaid and CHIP are the largest source of health insurance for children in the U.S., covering 71% of poor children and almost half (49%) of near-poor children (Figure 4). Still, as of 2011, over half (53%) of uninsured children were eligible for Medicaid or CHIP but not enrolled.14 There are multiple possible reasons for children who are eligible but are not enrolled. Some families are not aware of the availability of the programs or their eligibility. For others, burdensome enrollment and renewal requirements pose major obstacles to participation, despite major improvements made over the past decade.
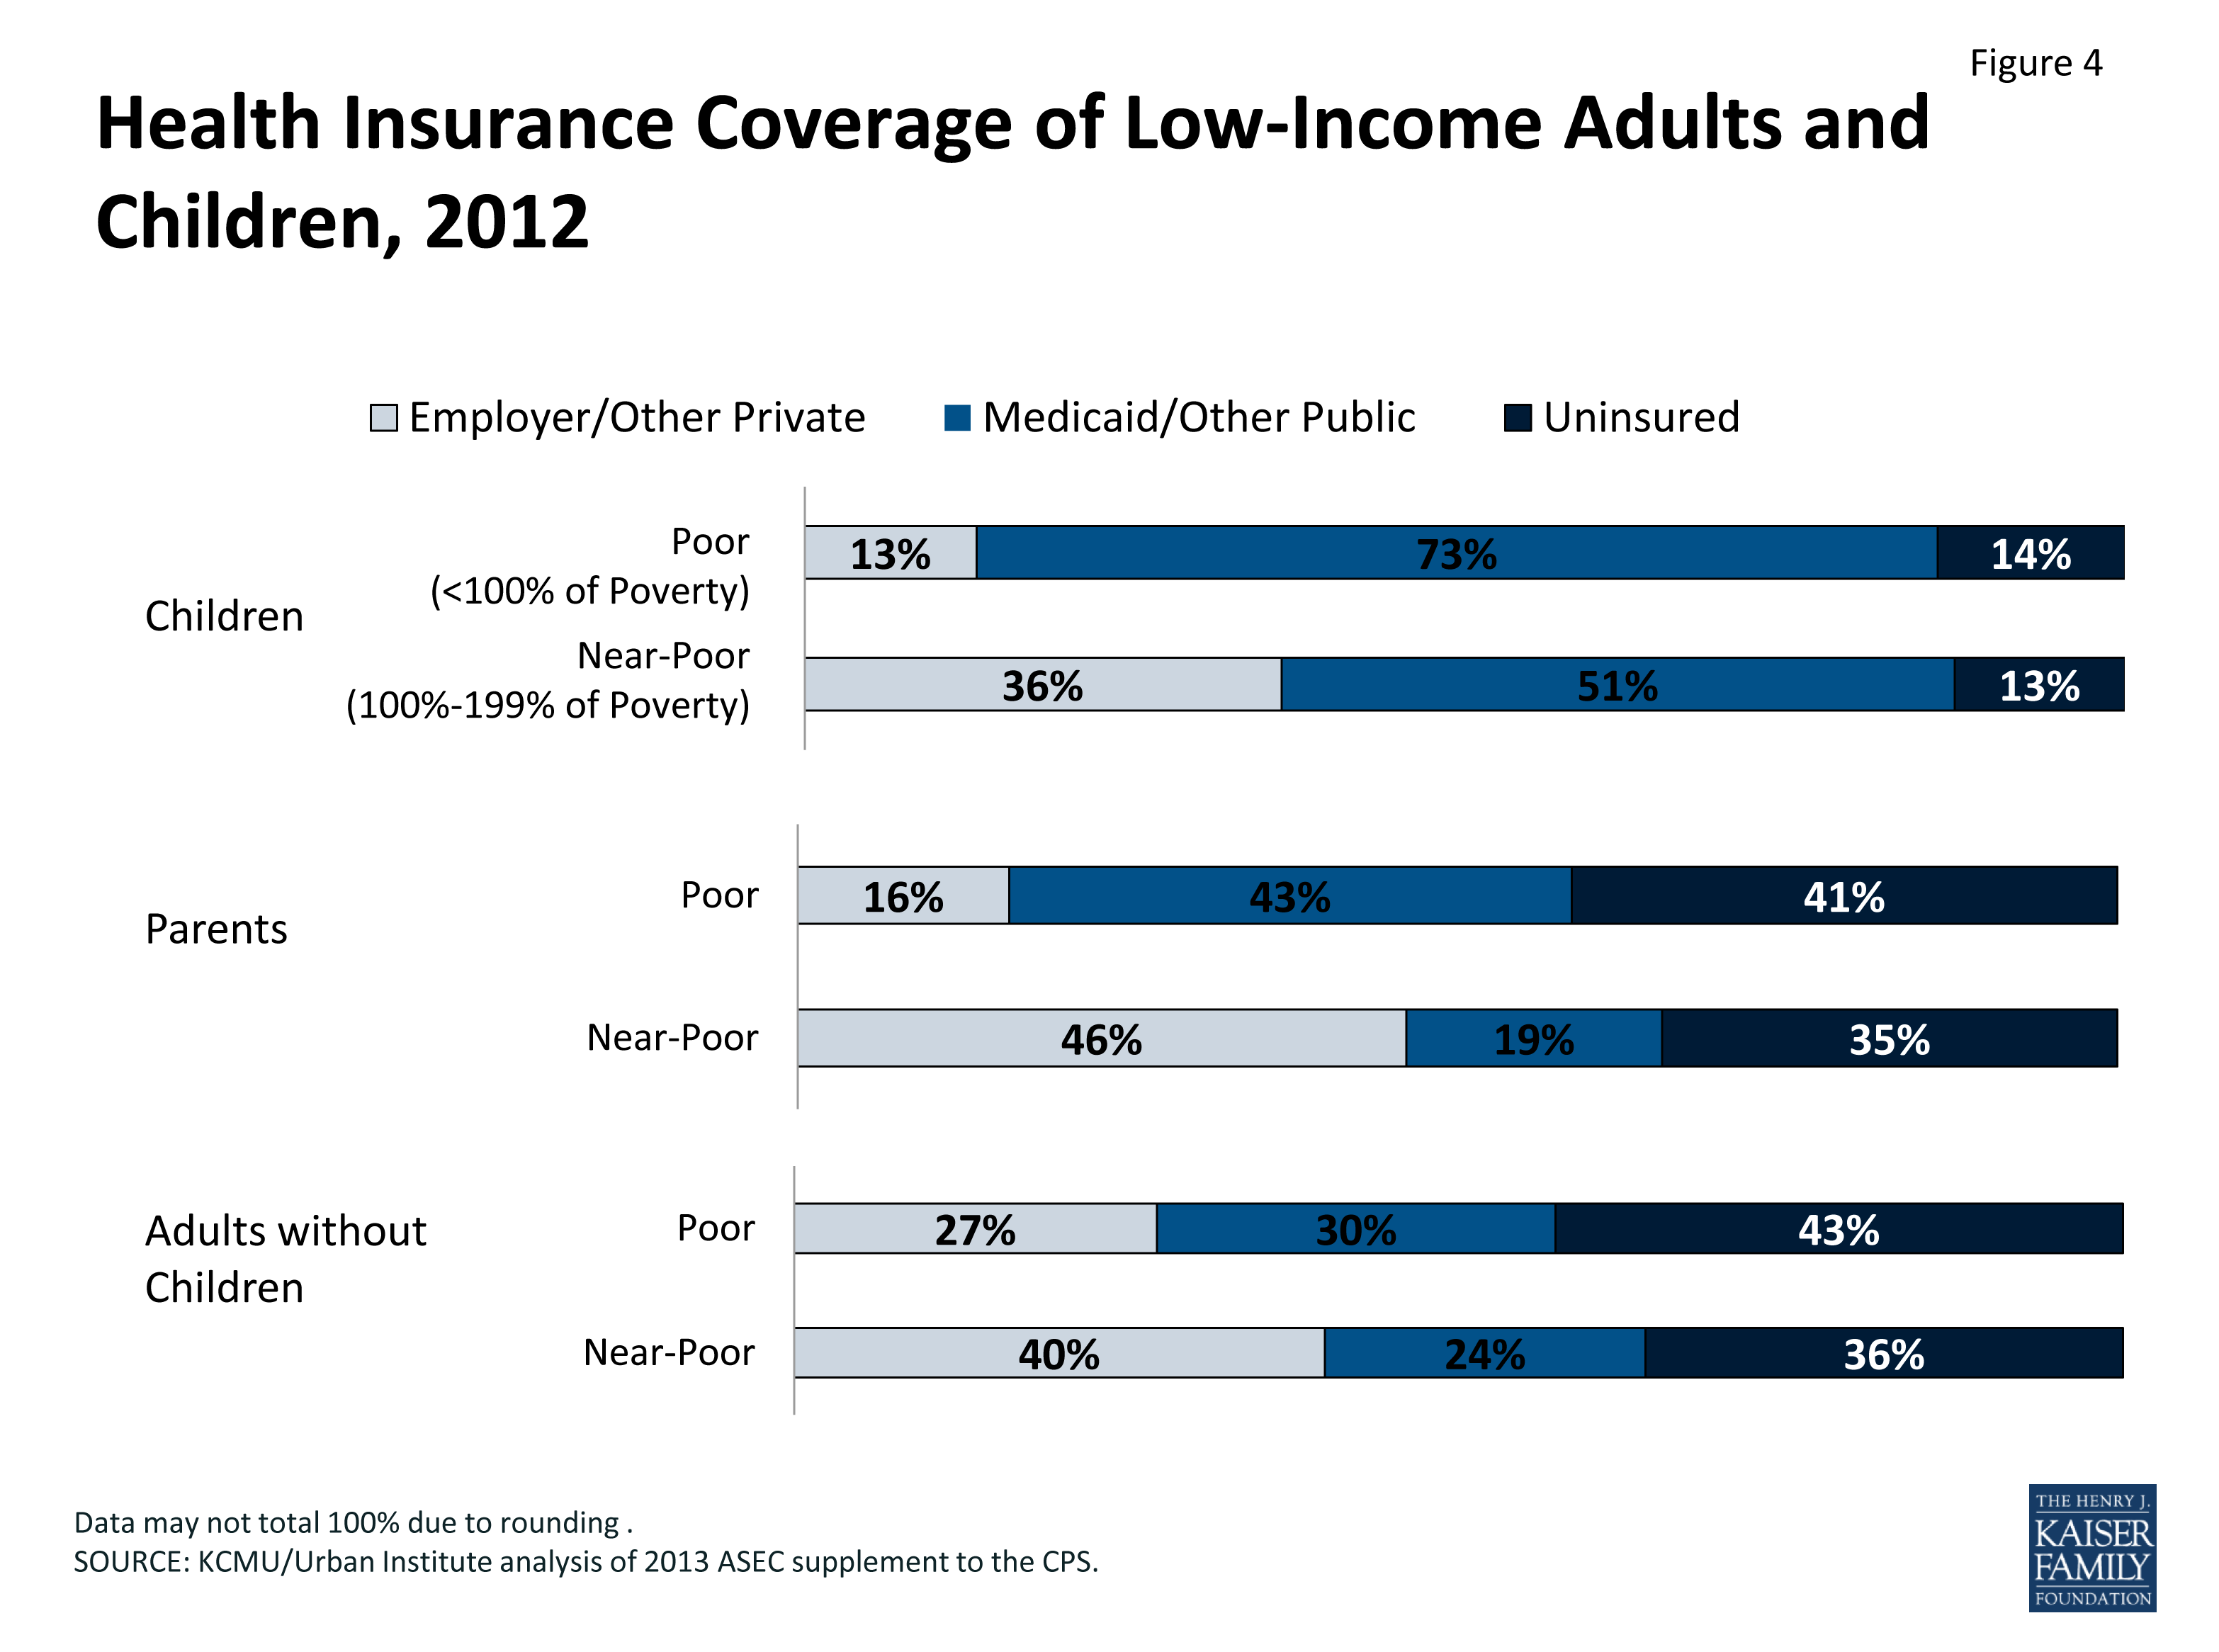
Figure 4: Health Insurance Coverage of Low-Income Adults and Children, 2012
Medicaid finances health and long-term care coverage for 9.7 million nonelderly people with disabilities (2010 estimates).15 Its role is especially important for people with certain conditions, such as HIV/AIDS. However, Medicaid eligibility for people with disabilities is limited to those with very low incomes and few assets. Medicaid coverage is particularly crucial to this population because it provides more comprehensive coverage than most private insurers. For example, Medicaid commonly pays for medical equipment as well as rehabilitation, speech therapy, and other services that people with disabilities may need.
In contrast to coverage for children, the role of Medicaid for nonelderly adults is more limited. State Medicaid programs are only required to cover parents below states’ 1996 welfare eligibility levels (often below 50% of the federal poverty level). Most states have much lower income eligibility for parents than for children. In addition, although Medicaid covers some parents and low-income individuals with disabilities, most adults without dependent children—regardless of how poor—are ineligible for Medicaid. As a result, four out of ten (41%) of poor parents and 43% of adults without children are uninsured. The Medicaid expansion in the ACA provides a new coverage pathway for millions of currently uninsured adults.
Some states have expanded Medicaid eligibility to cover more poor and near-poor parents. About one-third of states currently use the flexibility available to them under federal law to extend Medicaid eligibility for parents to 100% of the poverty level or higher. However, in the remaining states, parents still must have income below the poverty level in order to qualify for Medicaid. As of January 2013, a total of 33 states limit parent eligibility for Medicaid to less than the federal poverty level, including 16 states that limit eligibility to parents earning less than 50 percent of the federal poverty level.16 As a result, millions of poor parents are ineligible for Medicaid.
The ACA will extend Medicaid to many individuals at or below 138% of poverty starting in 2014.17 The ACA will expand Medicaid to adults without dependent children as well as parents who were previously ineligible because of low eligibility thresholds for parents. The June 2012 Supreme Court decision effectively made the Medicaid expansion optional for states, and as of September 30, 2013, 24 states and the District of Columbia have indicated they are moving forward with the expansion.18 Undocumented immigrants and lawfully present immigrants who have been in the U.S. for less than five years will continue to be ineligible for Medicaid.19
Endnotes
Kaiser Family Foundation and Health Research & Educational Trust. 2013. 2013 Kaiser/HRET Employer Health Benefits Survey. Available at: http://www.kff.org/private-insurance/report/2013-employer-health-benefits/
KCMU/Urban Institute analysis of 2013 ASEC Supplement to the CPS.
Kaiser Family Foundation Analysis of April – July 2010, SIPP 2008 Panel Data.
Kaiser Family Foundation and Health Research and Educational Trust, 2013.
Kaiser Family Foundation and Health Research and Educational Trust, 2013.
Kaiser Family Foundation and Health Research and Educational Trust, 2013.
Kaiser Family Foundation and Health Research and Educational Trust, 2013.
State Health Access Data Assistance Center (SHADAC). 2011. State Level Trends in Employer Sponsored Health Insurance: A State-by-State Analysis. Available at: http://www.shadac.org/files/shadac/publications/ESI_Trends_Jun2011.pdf
Kaiser Family Foundation and Health Research and Educational Trust, 2013.
State Health Access Data Assistance Center. 2013. “State-Level Trends in Employer-Sponsored Health Insurance: A State-by-State Analysis.” Available at: http://www.shadac.org/files/shadac/publications/ESI_Report_2013.pdf
KCMU/Urban Institute analysis of 2013 ASEC Supplement to the CPS.
Cox C, Levitt L, Damico A, and Claxton G. 2011. “Mapping Premium Variation in the Individual Market.” Kaiser Family Foundation. Available at: http://www.kff.org/health-reform/issue-brief/mapping-premium-variation-in-the-individual-market/
America’s Health Insurance Plans. 2009 “Individual Health Insurance 2009: A Comprehensive Survey of Premiums, Availability and Benefits.”
Kenney G, et al. 2013. Medicaid/CHIP Participation Rates among Children: an Update, Available at: http://www.urban.org/uploadedpdf/412901-%20Medicaid-CHIP-Participation-Rates-Among-Children-An-Update.pdf
Kaiser Commission on Medicaid and the Uninsured and Urban Institute estimates based on data from FY 2010 MSIS. 2009 MSIS data was used for Colorado, Idaho, Missouri, and West Virginia, because 2010 data was unavailable
Heberlein M, et al. 2013.
The Patient Protection and Affordable Care Act extends Medicaid eligibility to 133% of poverty, but a special income deduction equal to five percentage points of the poverty level effectively raises the eligibility level to 138% of poverty.
“Status of State Action on the Medicaid Expansion Decision, as of September 30, 2013,” Kaiser Family Foundation. Retrieved October 17, 2013 from http://www.kff.org/medicaid/state-indicator/state-activity-around-expanding-medicaid-under-the-affordable-care-act/
States have the option to provide Medicaid coverage to immigrant children and pregnant women who have legally been in the United States for less than five years.