Women and Health Care in the Early Years of the ACA: Key Findings from the 2013 Kaiser Women's Health Survey
For women, health care has long been a priority issue for reasons stemming from their own health needs and their central roles in managing their families’ health. As such, many of the reforms in the Affordable Care Act (ACA) were developed to address the perceived shortcomings that were part of health insurance design before the passage of the law. The ACA includes a ban on gender rating, a policy that permitted plans in the individual insurance market to charge women more than men for the same coverage. The law eliminates pre-existing condition exclusions that affected women who were pregnant or victims of intimate partner violence or who had chronic medical conditions. It provides coverage without cost sharing for a wide range of recommended preventive services. These preventive benefits ultimately required coverage of contraceptives as well as seven other services specifically for women including well woman visits, screening for intimate partner violence, and breastfeeding support.
The impact of the law on women’s access to coverage and care will take many years to assess. Will it make coverage and care more affordable for women? Will access be improved? Will the new coverage requirements improve the use of preventive services? How will contraceptive coverage affect the contraceptive choices that women make and where they get that care? And ultimately, will the changes in coverage improve health and provide stability of coverage for women? These questions will take time and will be difficult to answer.
While it is too early even to begin to answer these and other questions about the ACA, this survey was conducted to get a window into women’s health care and coverage experiences at the early stage of the ACA’s implementation. This survey builds on prior Kaiser Family Foundation surveys on women’s health, conducted in 2001, 2004, and most recently in 2008 in the early days of the Great Recession. The survey was conducted in the fall and early winter of 2013 and reports on experiences related to health care coverage, access, affordability, providers, and preventive care among a nationally representative sample of women ages 18 to 64. It also reports on women’s access to reproductive and sexual health services among a nationally representative sample of women ages 15 to 44. While most of the report presents findings for women ages 18 to 64, a shorter survey of men ages 18 to 64 was also conducted and key findings are included in the text for the purposes of comparison. All women and men were interviewed by telephone (landline and cell phone).
This report provides new data on women’s health insurance coverage, their access to care and use of health care services, as well as health care affordability. This survey addresses topics that affect women across their lifespans, including the importance of the ACA for women’s reproductive and sexual health care and establishes a useful baseline to help us understand and measure changes in women’s health care experiences as health reform implementation moves forward over the coming years. We hope that these data will provide a useful lens through which to begin to gauge the impact of the ACA on women’s health and their care.
Profile of Demographic and Health Characteristics of Women in the U.S.
Health care is shaped by and intertwined with many aspects of women’s lives. It is, therefore important to assess the demographic characteristics of the survey populations, non-elderly adult women ages 18 to 64 as well as reproductive age women, 15 to 44 years old.
Nonelderly adult women ages 18 to 64
Not surprisingly, the nation’s women are a diverse population in many respects. Fifteen percent of women are in their early adult years, ages 18 to 25. Another 38% are ages 26 to 44 and almost half (47%) are in their middle years, ages 45 to 64. Almost two-thirds of women are White, non-Hispanic (referred to as White throughout this report), 13% are Black, non-Hispanic (referred to as Black throughout this report), 14% are Hispanic, and 9% are of another racial or ethnic group, including Asian, Pacific Islander, and other groups (Exhibit 1.1). Throughout this report, data are presented for White, Black, and Hispanic women. Data by other racial/ethnic groups are not presented because the sample sizes for these subgroups were not sufficient to provide reliable national estimates. The authors recognize that women of other races and ethnicities have important health needs and distinct health concerns; however, we were not able to report on these in this report. Half of women ages 18 to 64 are married (50%), nearly one in ten live with a partner (8%), 17% are widowed, divorced, or separated, and a quarter of women never married (25%).
Many women face challenging economic circumstances (Exhibit 1.2). Fifteen percent live below the poverty line, which was just under $20,000 for a family of three in 2013, when this survey was conducted. Another 16% of women have incomes between 100 and 199% of poverty. Together, 31% of women ages 18 to 64 have incomes under 200% of the federal poverty level, referred to as “low income,” throughout this report. Almost six in ten women (58%) have incomes above this level and data are not available for 10% of women. About a third (36%) have a high school degree or less education. Most women work outside the home, either full-time (45%) or part-time (15%). About a third are not employed for pay (19%), students (8%), or retired (6%).
Reproductive age women ages 15 to 44
The survey also includes a sample of teen girls ages 15 to 17 as part of the reproductive age group. Although most females ages 15 to 17 are not yet sexually active, many are dating and reproductive and sexual health services are an important component of health care for this age group. (Exhibit 1.3) and (Exhibit 1.4) present demographic characteristics of women ages 15 to 44, the population discussed in the section on reproductive and sexual health. About a third (35%) of this group are young adults through age 25 and the rest are 26 to 44. Almost six in ten are White (58%) and about four in ten (41%) are women of color. Not surprisingly, this group has a lower marriage rate (38%) than women 18 to 64, and more than a third (36%) have never been married. More than a third (37%) of reproductive age women are low-income, with incomes less than 200% of the poverty line, 18% are students or do not have a high school degree, and over half (56%) are working full or part time.
Throughout this report, data are presented to highlight the range of experiences that different subpopulations of women face when they use health care, particularly the challenges facing those who are at risk for poor access to care, those who are low-income, and women of color. These are the women who are most likely to benefit from the insurance and benefit reforms that are part of the ACA.
Women’s health status
In addition to diversity in demographic characteristics, women have a wide range of health needs, which set the framework for the care they need and seek. How women assess their health status is an important gauge of their overall health and medical care needs. Women who rate their health as “fair” or “poor” typically need and use more health care services than women reporting better health (“excellent,” “very good” or “good”). In addition to the global measure of self-reported health status, the rates of chronic conditions and the impact of those conditions on women’s ability to lead productive lives are important measures of women’s health status and provide a window into their health needs over their lifetimes.
Overall, 15% of non-elderly adult women ages 18 to 64 rate their health as fair or poor (Table 1). This rate increases with age, from 12% of adult women in their reproductive years (ages 18 to 44) to nearly one in five women (19%) ages 45 to 64. Among Hispanic women, 28% report fair or poor health, also 12% of White and 16% of Black women. Fourteen percent of women report that they have a disability or chronic condition that limits their daily activities. This is the case among 8% of women ages 18 to 44, but is reported by more than twice as many middle-aged and older women ages 45 to 64 (21%).
| Table 1: Health problems reported by women, by age and race/ethnicity | ||||||
| All Women | Age Group | Race/Ethnicity | ||||
| Share of women reporting: | Ages 18-44 | Ages 45-64 | White | Black | Hispanic | |
| Fair/poor health | 15% | 12% | 19% | 12% | 16% | 28%* |
| Have disability, handicap, or chronic disease that limits activity | 14% | 8% | 21%* | 15% | 15% | 14% |
| Have ongoing condition that requires regular monitoring, care, or medication | 43% | 32% | 55%* | 48% | 38%* | 35%* |
|
NOTE: Among women ages 18-64. *Indicates a statistically significant difference from Ages 18-44, White, p<.05.
SOURCE: Kaiser Family Foundation, 2013 Kaiser Women’s Health Survey.
|
||||||
A sizable minority of women (43%) say that they have an ongoing condition that requires regular monitoring, treatment, or medication. This is reported by about one-third of women ages 18 to 44 (32%) and rises to over half of older women (55%). In contrast to self-reported health status, White women (48%) report ongoing health conditions that require monitoring, care or medication at higher rates than both Black (38%) and Hispanic women (35%). This difference could be attributable, in part, to poorer access to care experienced by women of color. Women with more limited access may be more likely to have undiagnosed conditions that require care, but they are unaware of their presence.
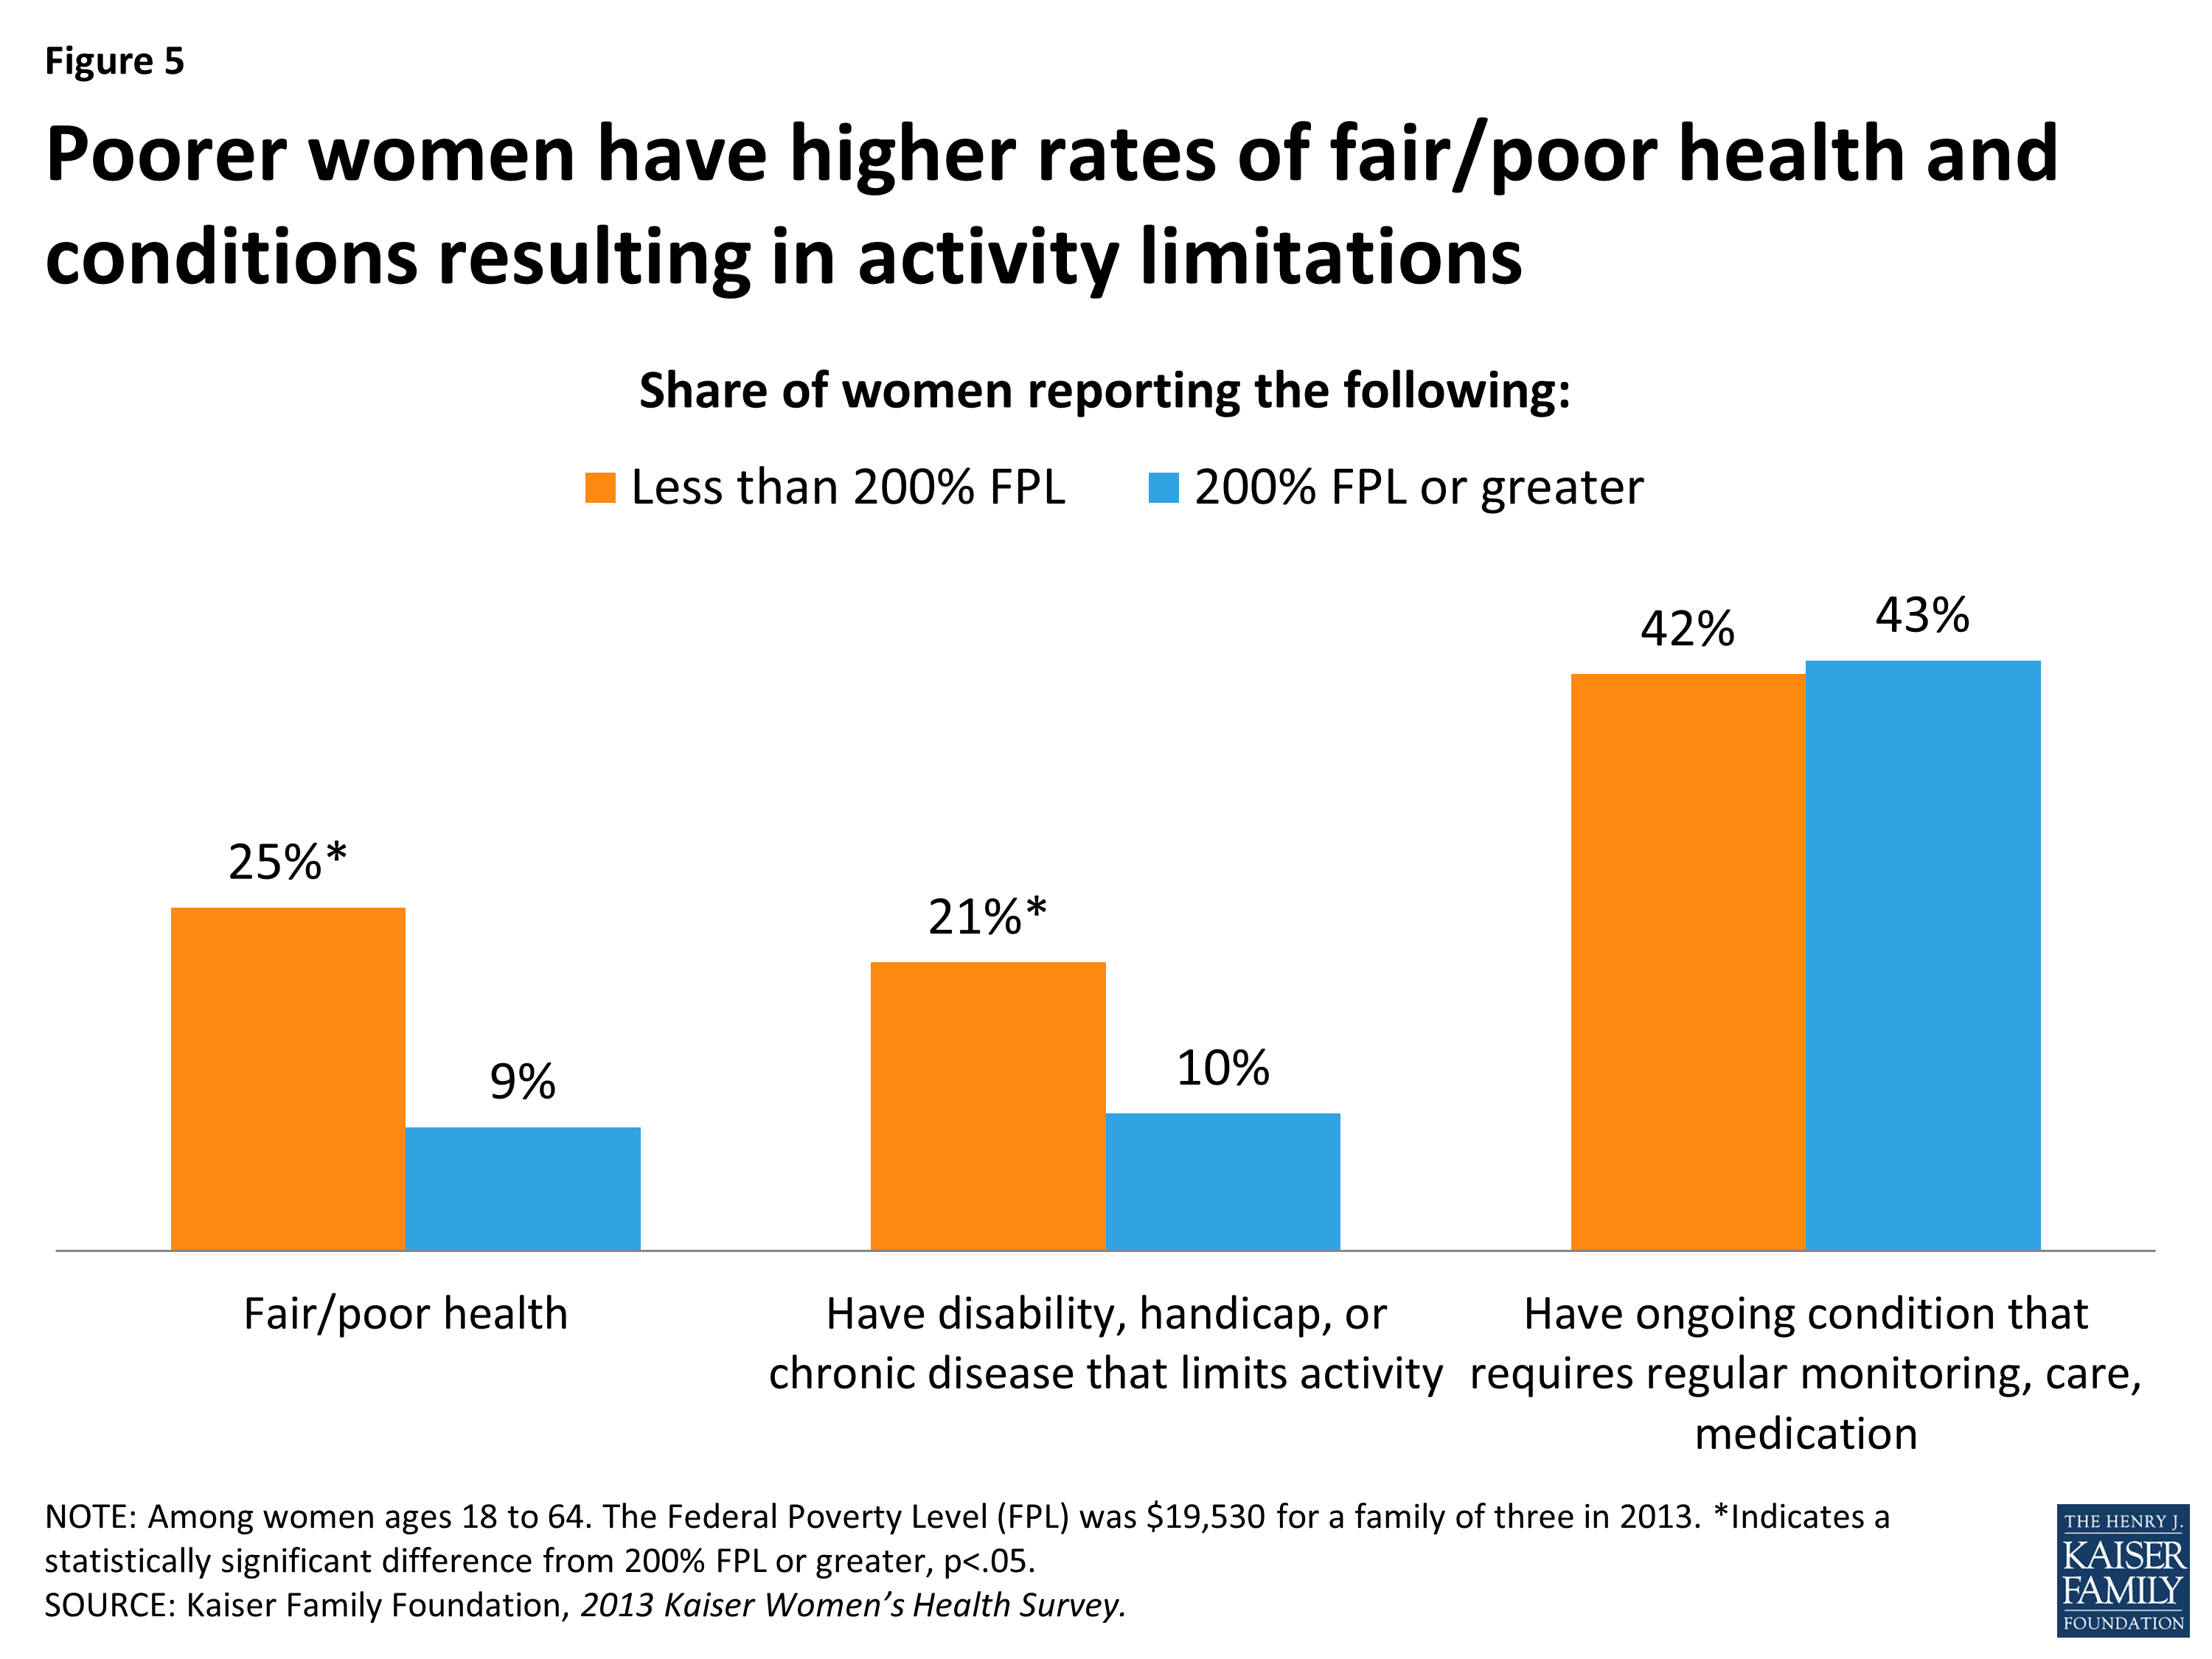
The difference in health status between women of different poverty levels is also notable and of particular relevance, given the ACA’s focus on health care costs and spending in addition to coverage. Low-income women report higher rates of health problems than more affluent women (Exhibit 1.5). One in four low-income women rate their health as fair or poor, which is over twice the rate of higher-income women (9%). Similarly, the rate of women reporting an activity-limiting disability or chronic disease is twice as high among low-income women (21%) than their higher income counterparts (10%). The lack of differences in the share reporting that they have a medical condition that requires ongoing care could be attributable to the poorer health care access experienced by many low-income women.
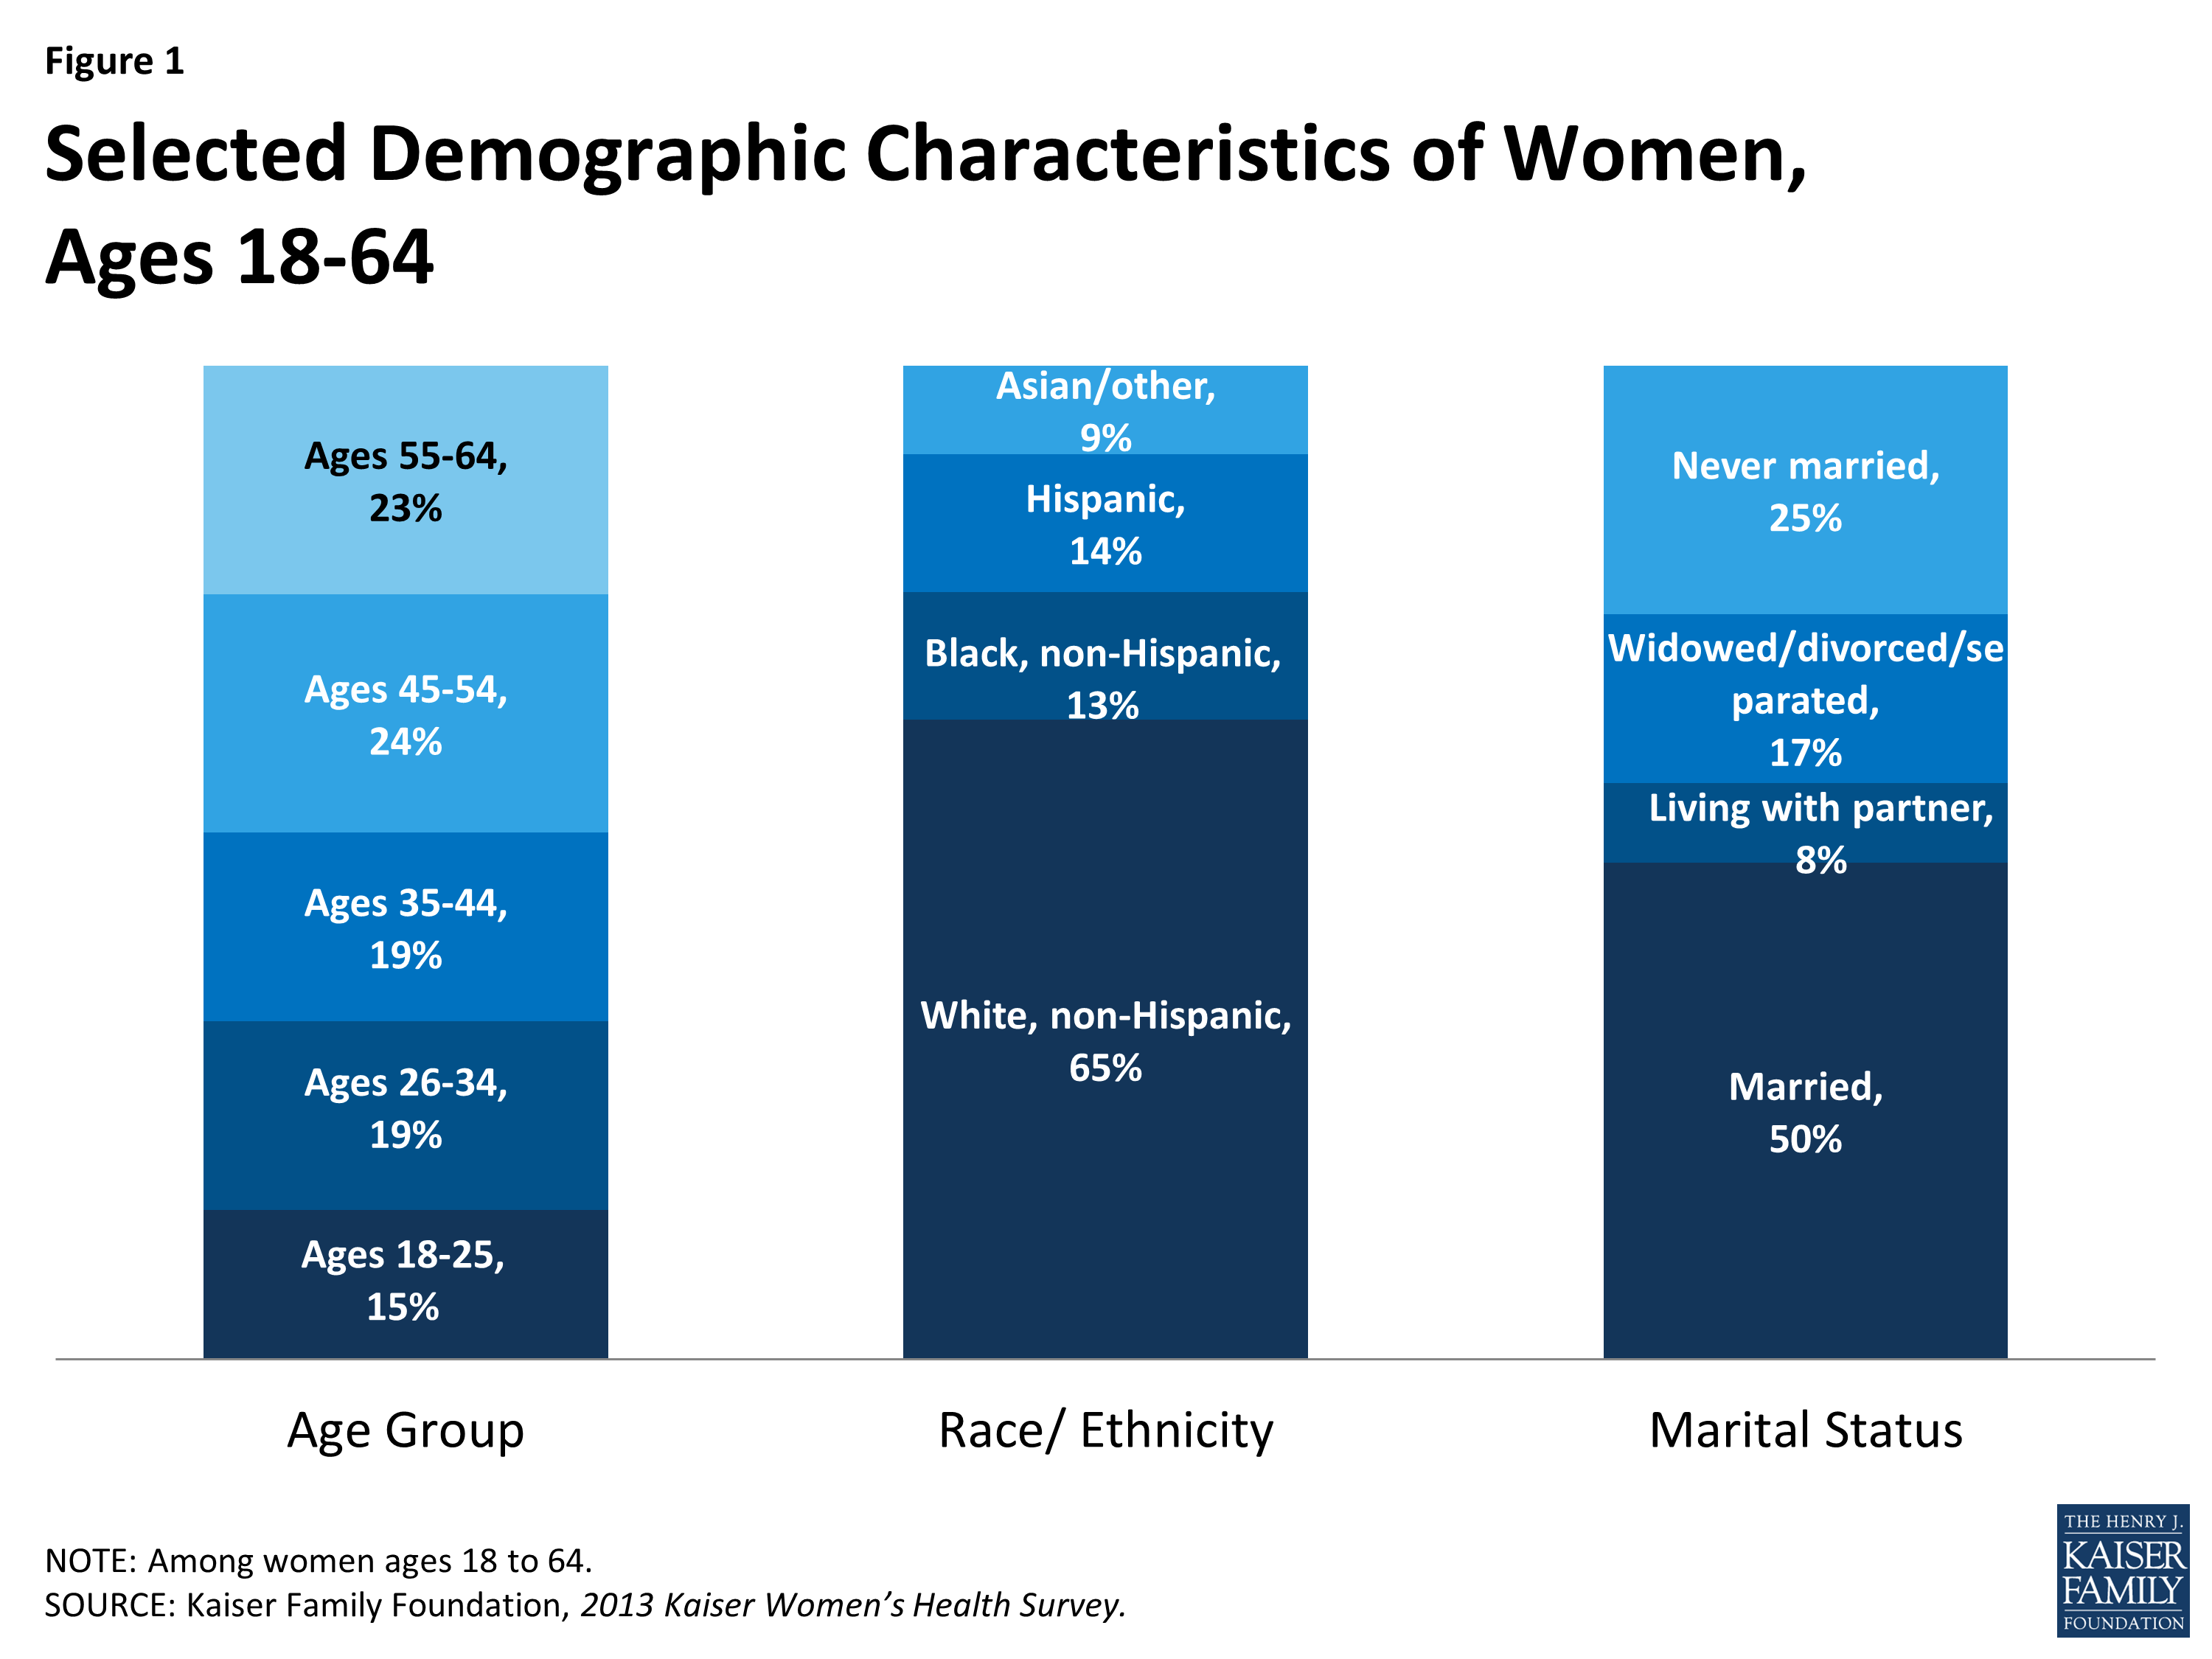
Selected Demographic Characteristics of Women, Ages 18-64
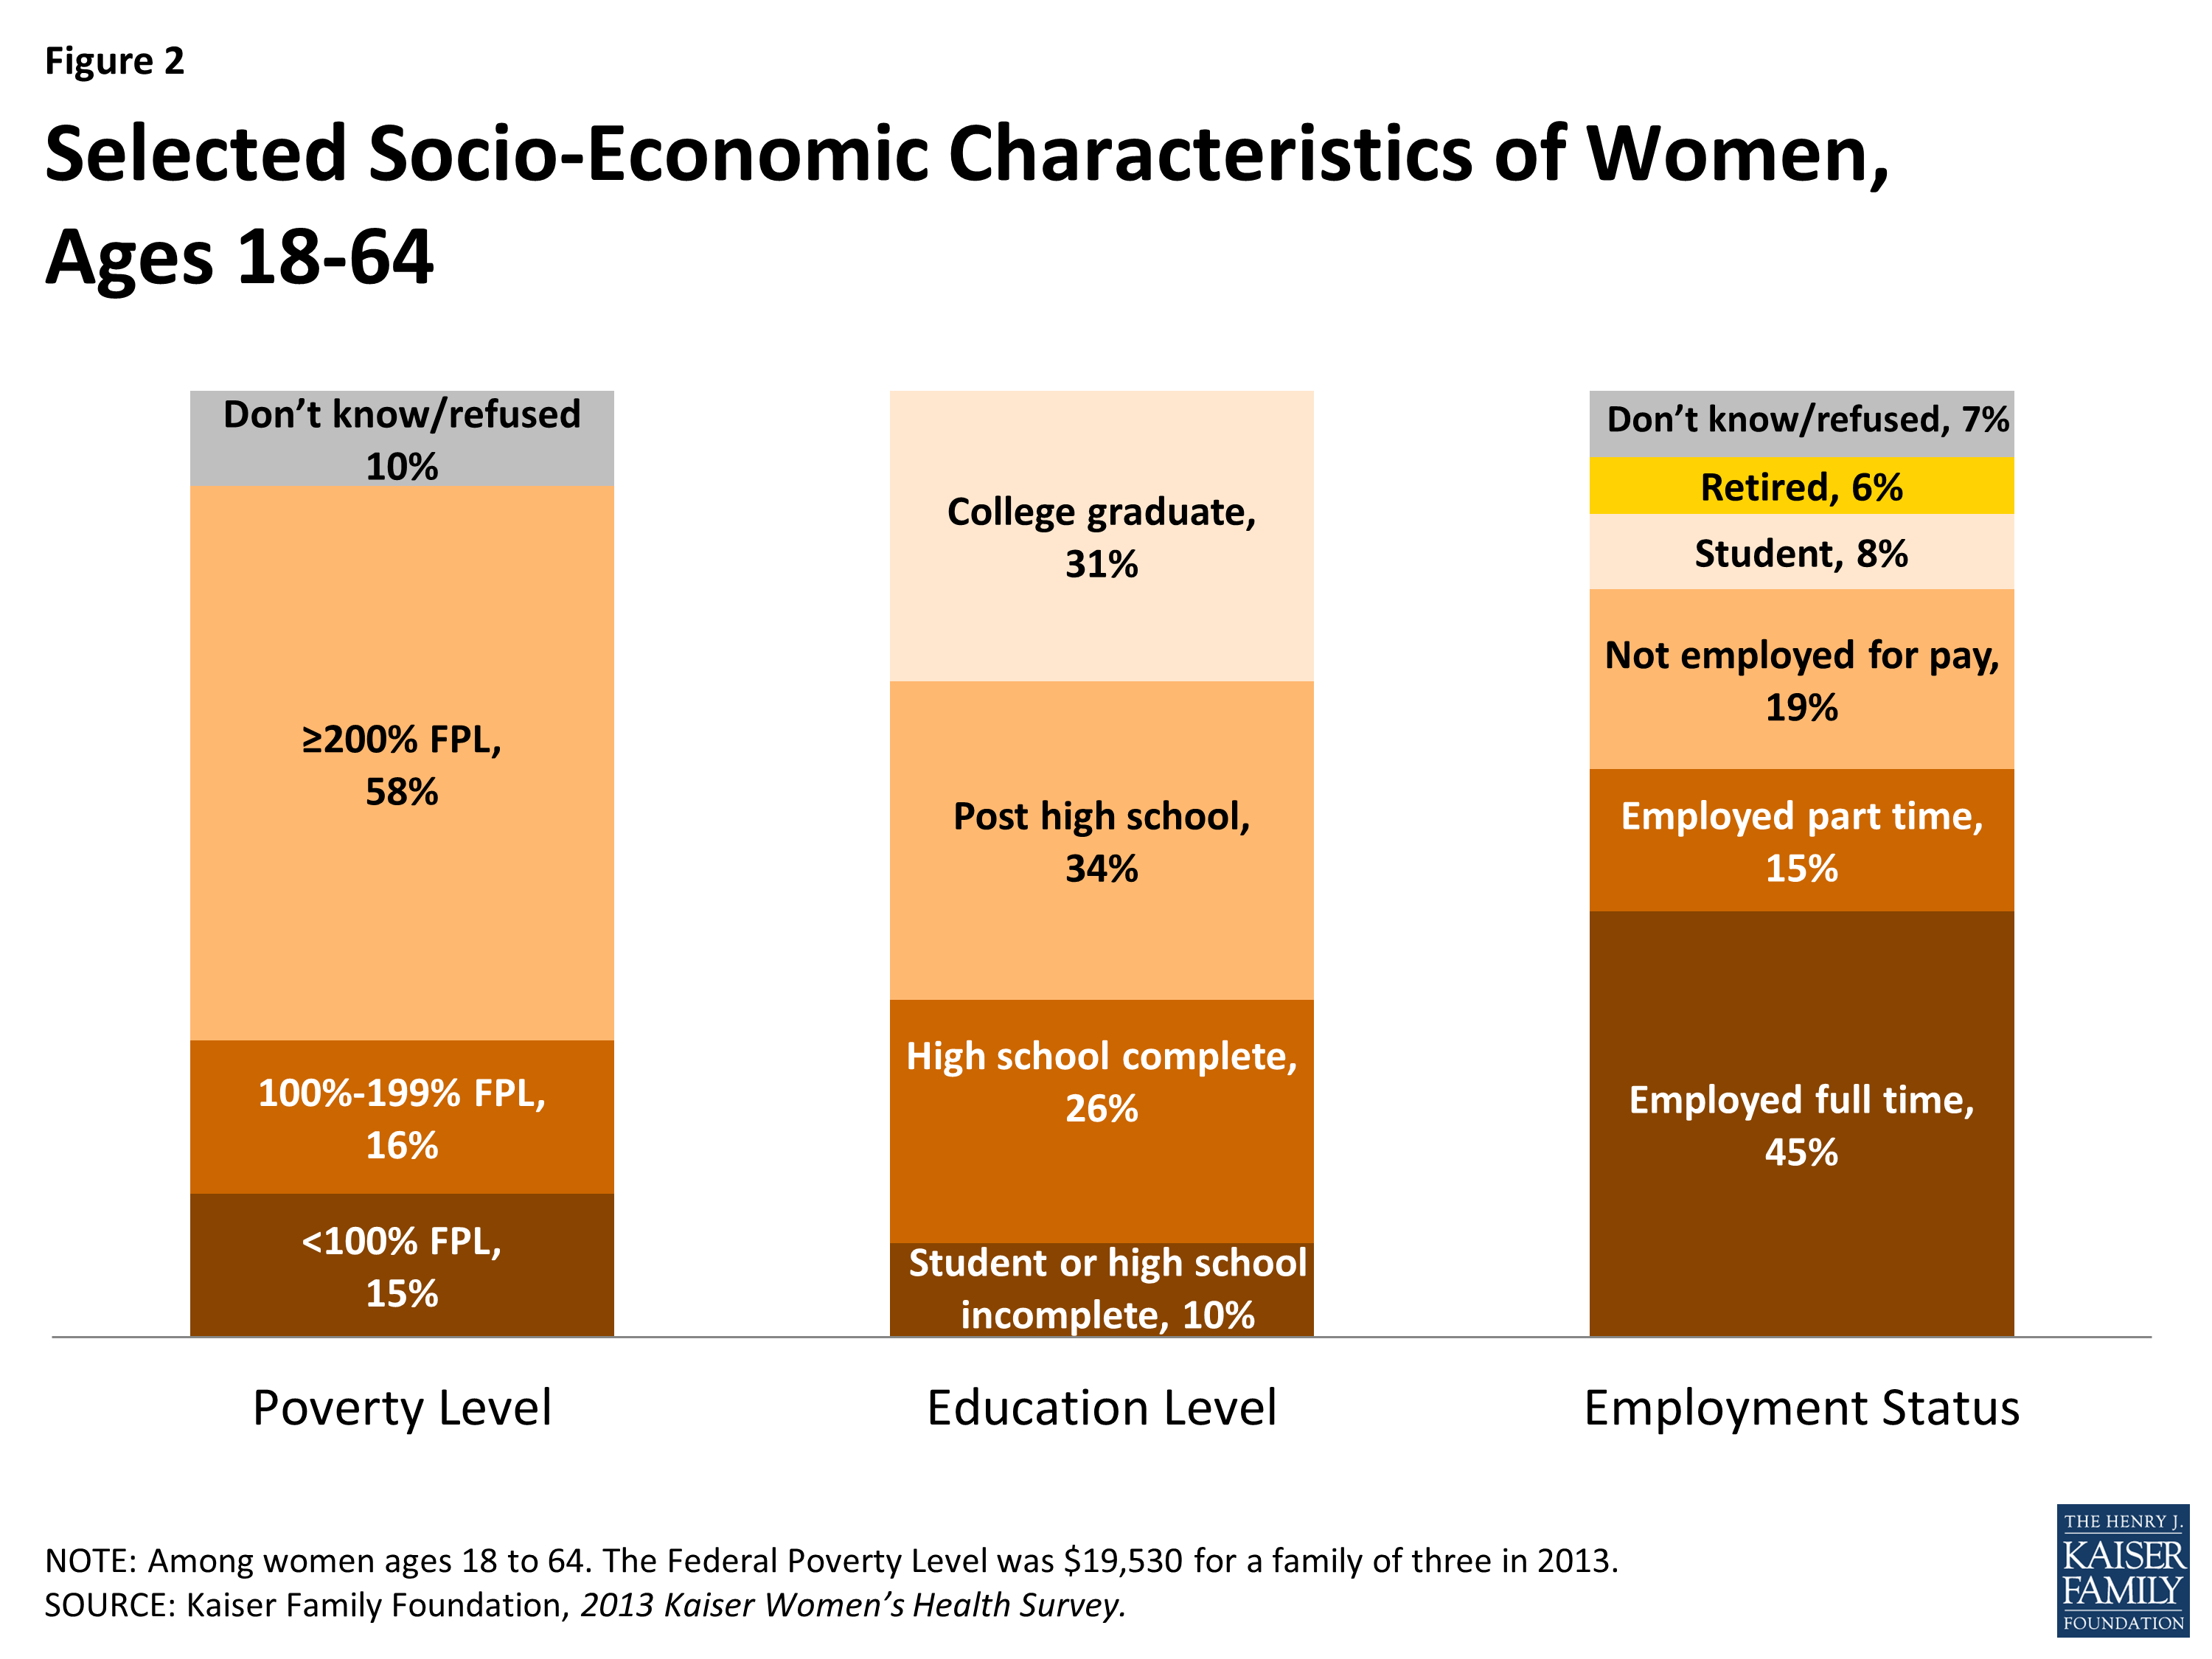
Selected Socio-Economic Characteristics of Women, Ages 18-64
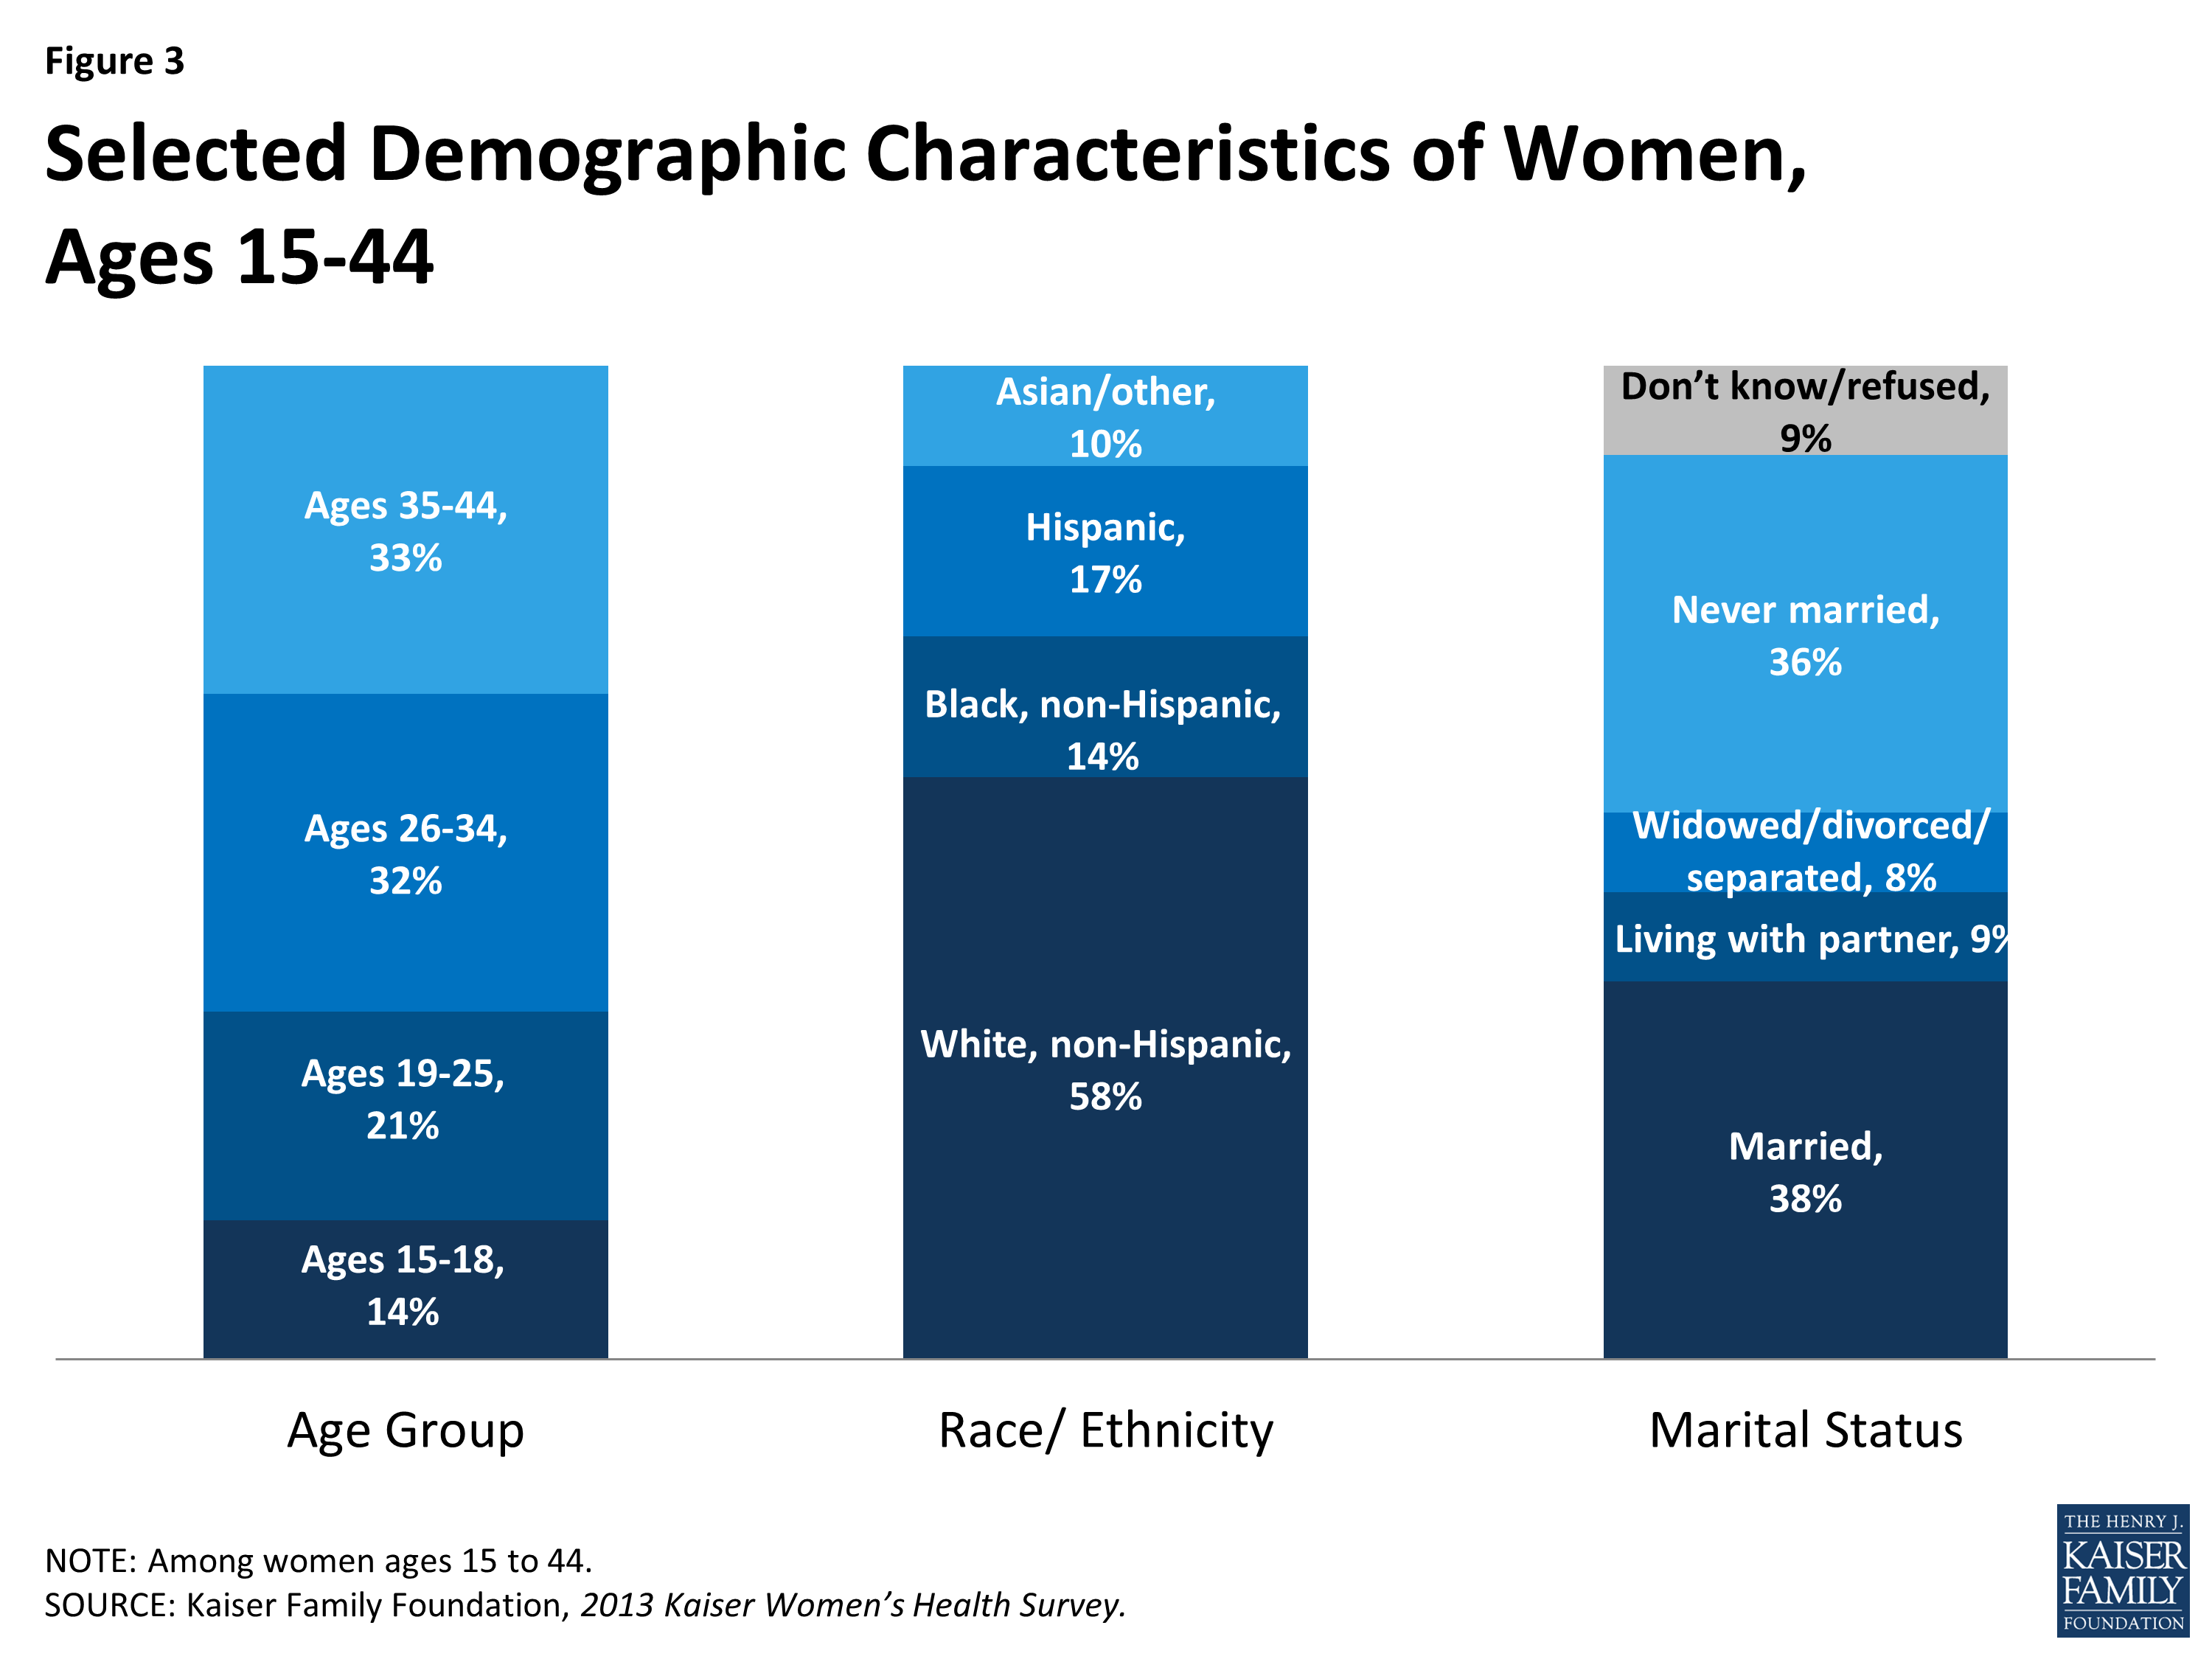
Selected Demographic Characteristics of Women, Ages 15-44
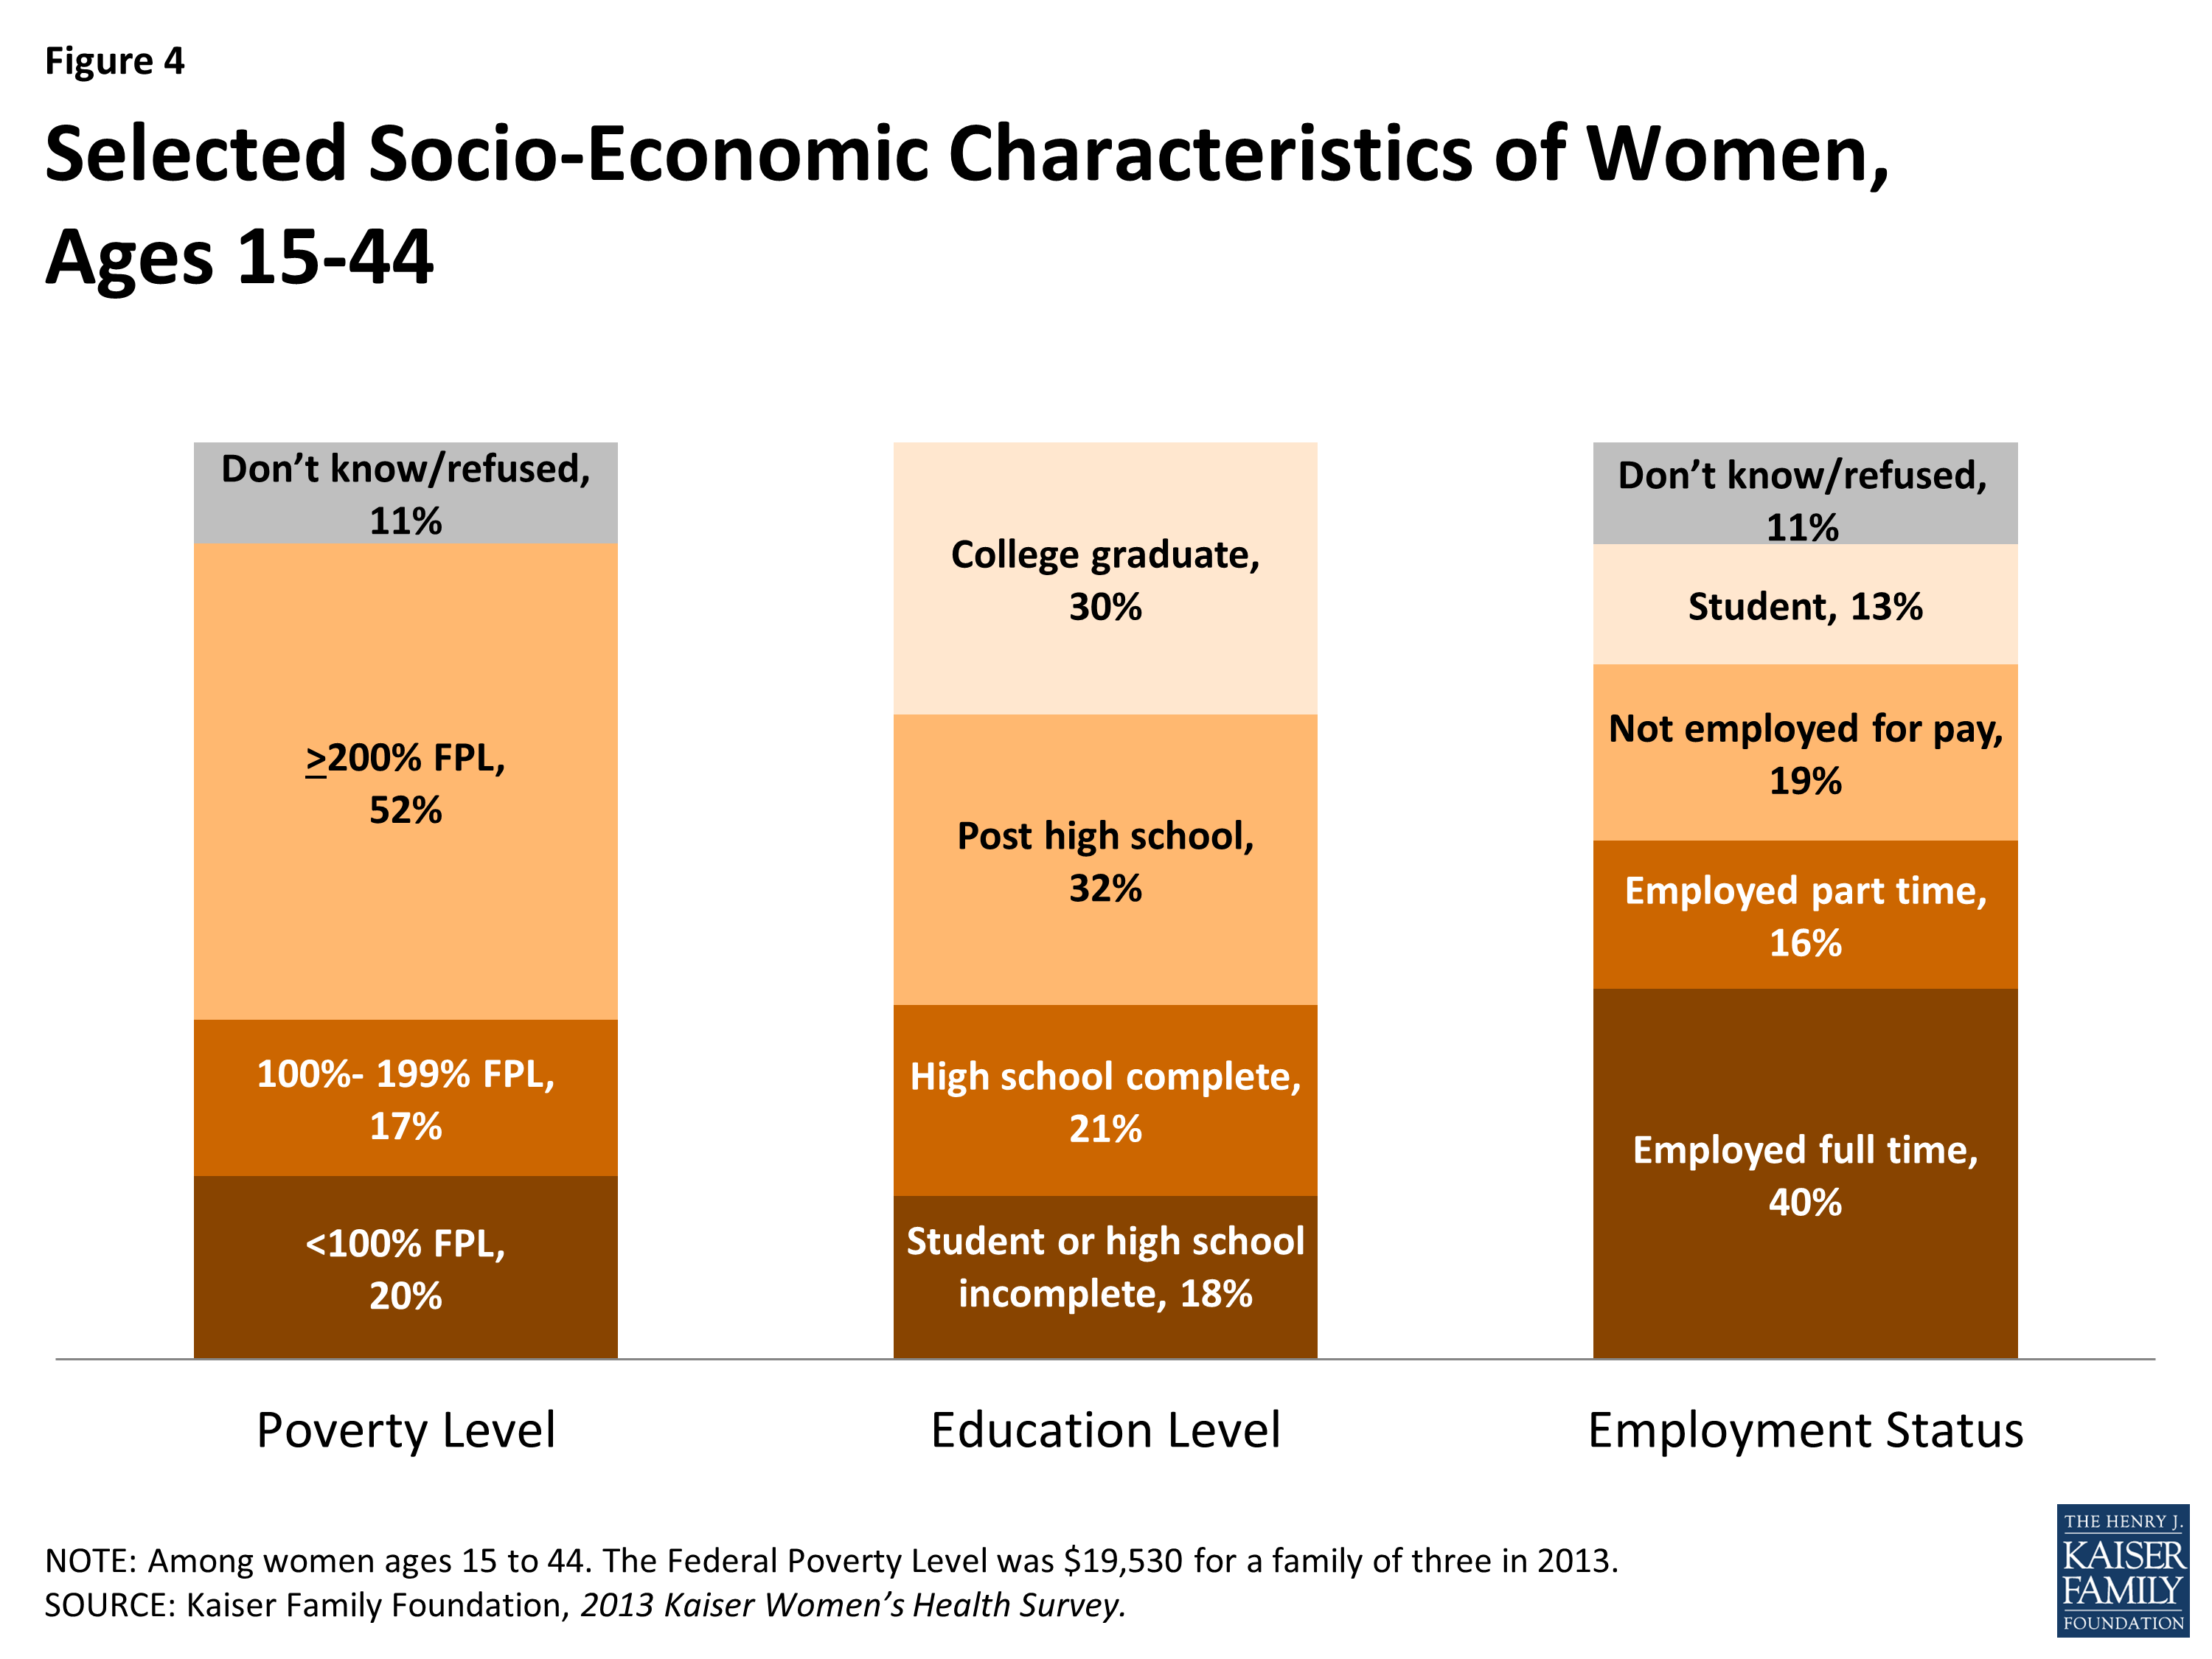
Selected Socio-Economic Characteristics of Women, Ages 15-44