THE UNINSURED A PRIMER 2013 – 3: How and Why Has the Number of Uninsured People Changed?
The recent recession and ongoing weak job market led to a steep rise in the number of uninsured people between 2007 and 2010 (Figure 9). This trend was driven by a decline in employer-sponsored coverage that resulted from the high jobless rate. This trend was reversed in 2011 and continued into 2012 as the employment rate increased and employer-sponsored insurance rates continued to stabilize. Further, Medicaid and CHIP coverage—which provide a safety net to many low-income people who lose coverage during economic downturns—grew each year between 2007 and 2011 and continued into 2012. Public coverage helped prevent the number of uninsured from being even higher during the recession and contributed to gains in coverage in recent years.
In the years preceding the 2007 recession, the uninsured rate for adults rose due to a decrease in employer-sponsored coverage. The share of the nonelderly population with employer-sponsored coverage declined steadily beginning in 2000, even during years when the economy was stronger and growth in health insurance premiums was slowing. The share of adults on Medicaid remained relatively steady and did not compensate for the drop in employer-sponsored coverage.
Recent trends in coverage are closely linked to trends in unemployment. When people lose their jobs, they frequently lose health coverage. Two-thirds of uninsured adults that lost employer-sponsored coverage in the previous year stated that this was because they or their spouse had lost or changed jobs or started working part-time.1 Some of the newly unemployed have the option to switch to a spouse’s employer-sponsored insurance. Others may qualify for public coverage, but many do not meet current eligibility requirements. Unemployed individuals who had employer-based insurance while employed may be able to continue this coverage under the Consolidated Omnibus Budget Reconciliation Act of 1985 (COBRA), though premium requirements for this coverage is often high. Purchasing coverage in the non-group market is another option, but high premiums make this option unattainable for those who also struggling with reduced income.
As unemployment spiked in the recent recession (2007-2010), the uninsured rate for adults increased, resulting in 5.8 million more nonelderly adults without coverage (Figure 9). This increase in uninsured adults was largely driven by a decrease in the share of adults with employer-sponsored coverage and an increase in the number of people living in poverty.2 Over this period, the unemployment rate nearly doubled from 5.0% in December 2007, when the recession began, to 9.4% in December 2010.3 While a partial federal subsidy for individuals maintaining their previous employer-sponsored coverage was in place for those laid-off between September 2008 and May 2010, uptake of the subsidy was lower than predicted.4
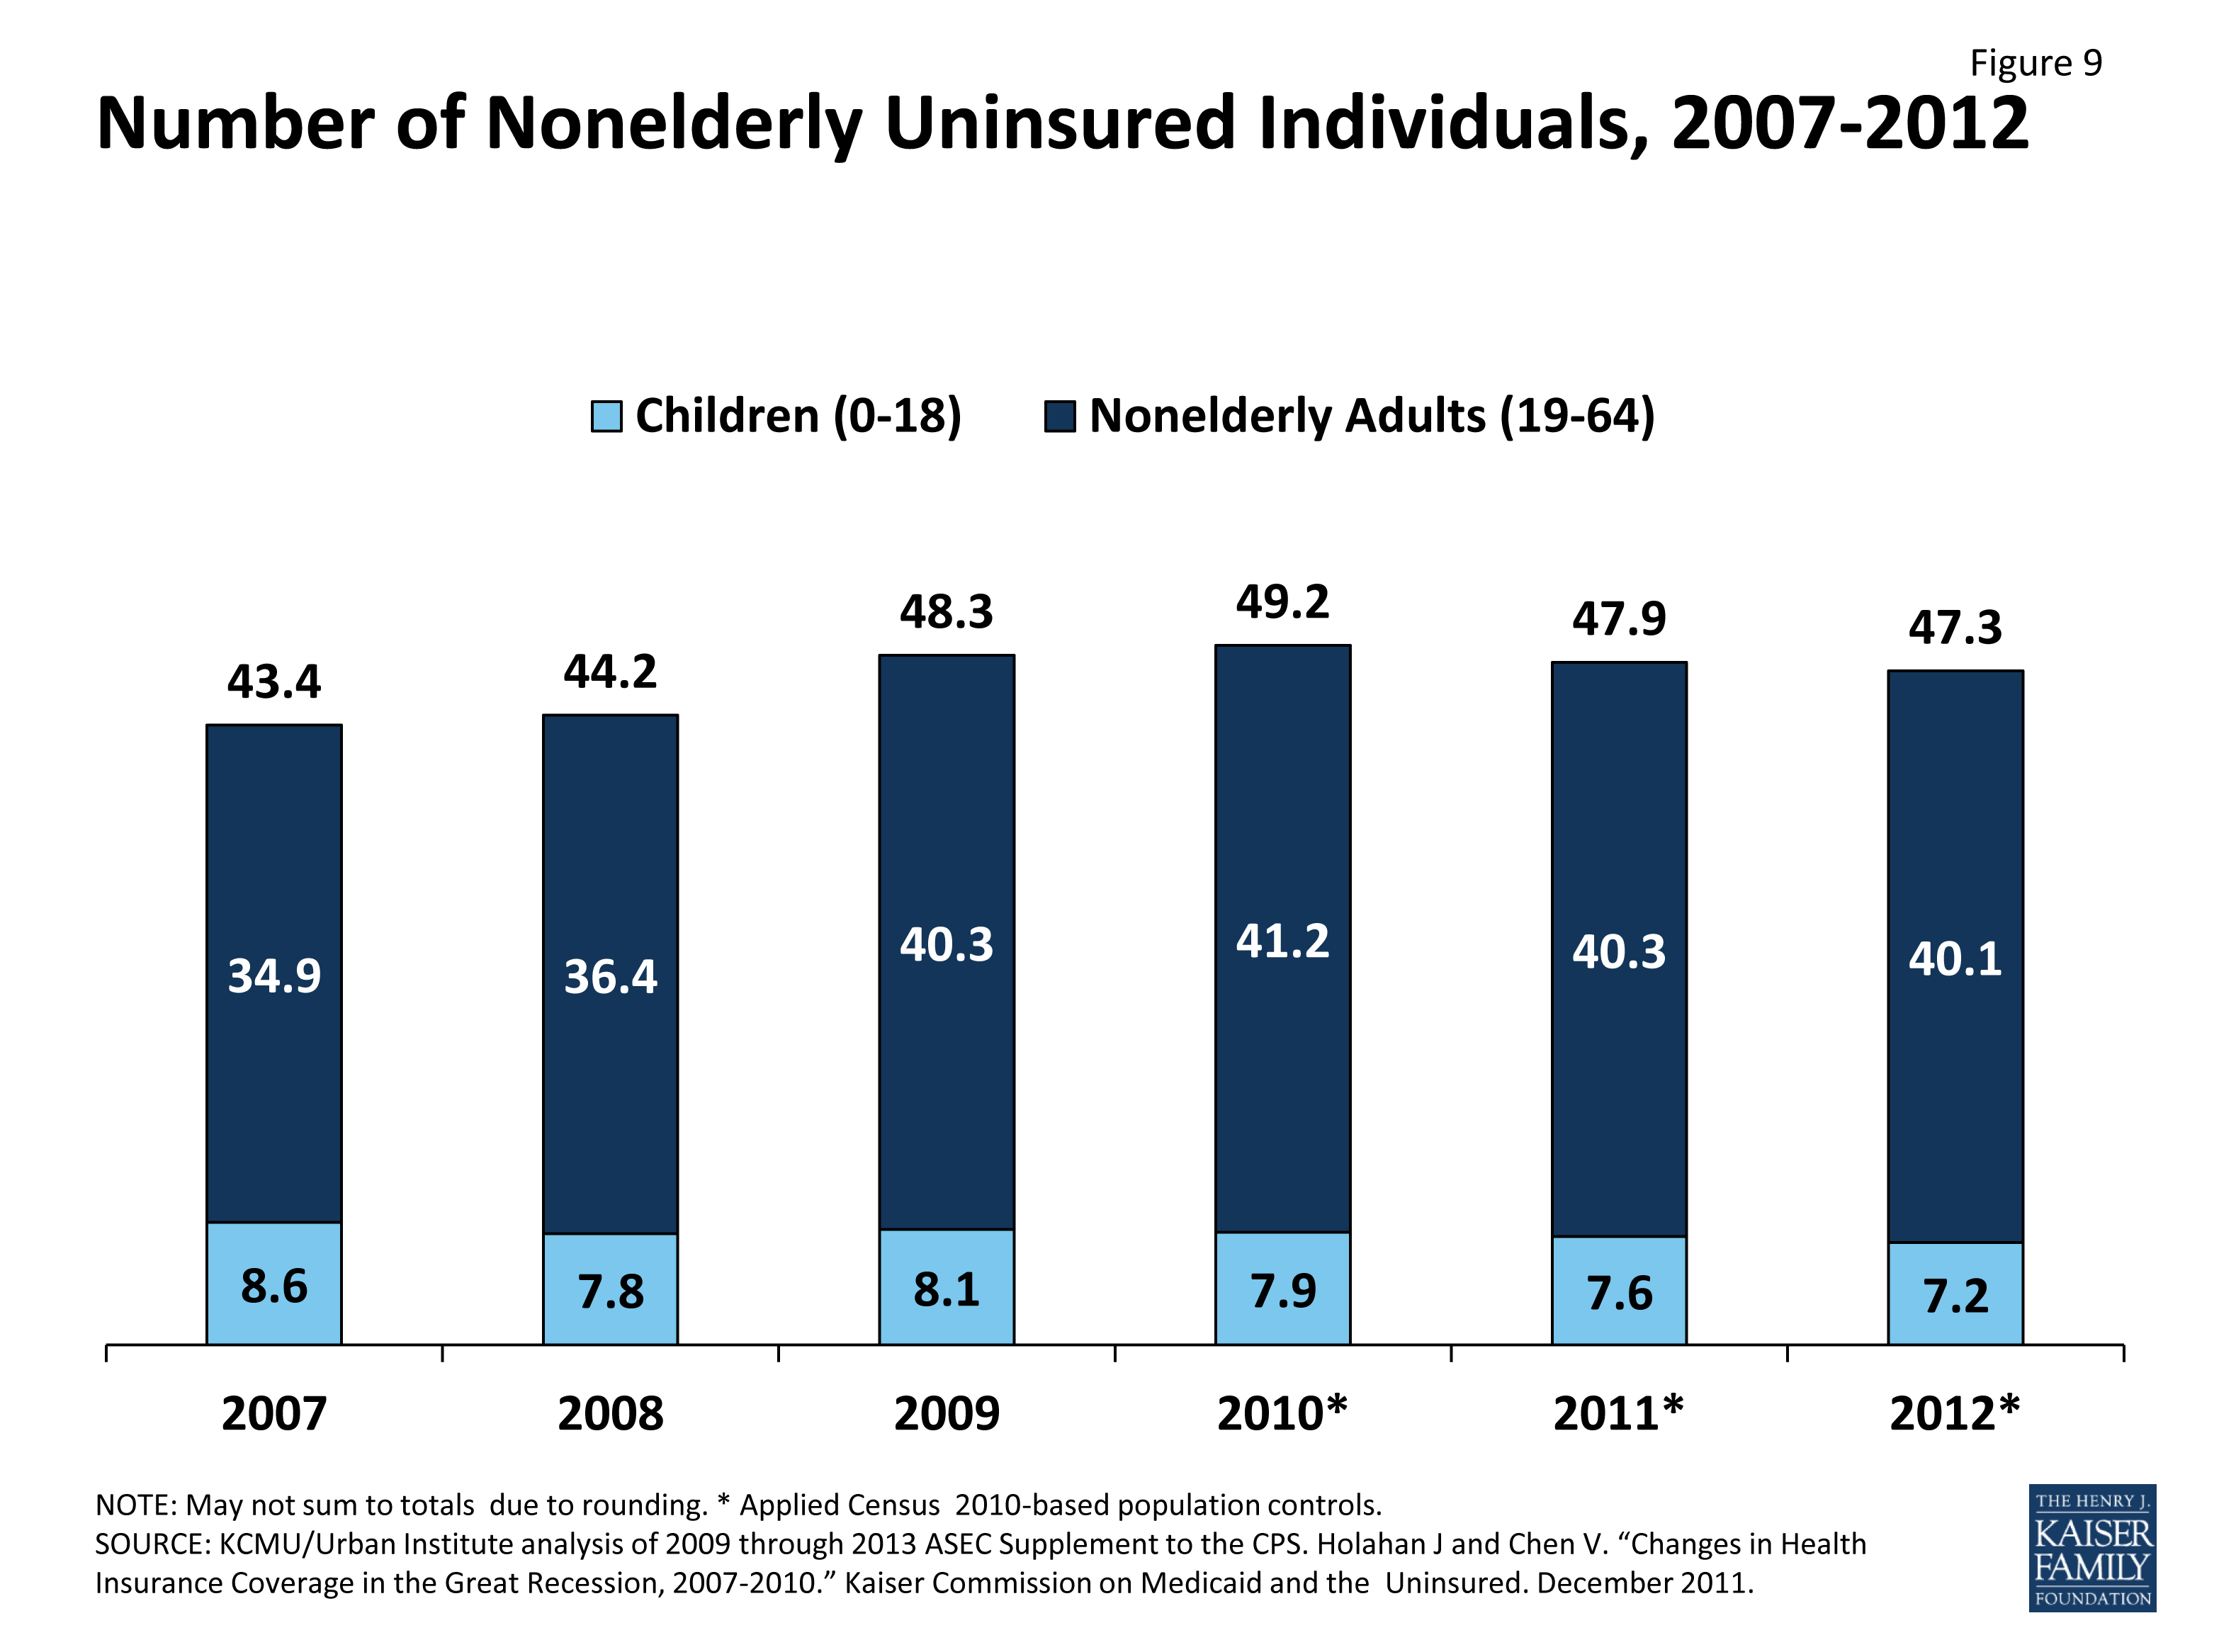
Figure 9 : Number of Nonelderly Uninsured Individuals, 2007-2012
In 2011, the uninsured rate for the nonelderly decreased for the first time since the start of the recession in 2007. From 2010 to 2011, the uninsured rate decreased from 18.5 percent to 18.0 percent, a decrease of 1.2 million people. The reversal of the trend in rising uninsured rates was surprising due to the continued high levels of unemployment and the lingering effects of the recession. The rate of employer-sponsored insurance (ESI) in 2011 remained unchanged from 2010. The decrease in the uninsured rate was driven primarily by increases in Medicaid and CHIP among adults, while coverage for children remained unchanged.5
In 2012, over 47 million nonelderly Americans were uninsured, a decrease of 0.6 million people from the previous year. The change in the number of uninsured people represents the second decrease since 2007, before the recession began. However, this change does not represent a statistically significant decrease in either the share or number of uninsured from 2011 to 2012.
Recent increases in Medicaid and CHIP enrollment helped to offset declines in private coverage during the economic downturn and slow recovery, particularly for children. During the recent economic recession and slow recovery, the share of children who were uninsured actually declined slightly as more children gained coverage through Medicaid or CHIP. Medicaid and CHIP coverage among children increased significantly from 34.9% in 2011 to 35.5% in 2012. Between 2007 and 2012, the uninsured rate for children dropped from 10.9% to 9.2% (Figure 10). This decline occurred despite a decrease in the share of children with employer-sponsored coverage. As the weakening economy caused more children to lose the coverage they had through a parent’s employer and incomes dropped, many became eligible for public insurance. In comparison, because Medicaid eligibility for adults is more limited than for children, public coverage did not offset the decline in employer-sponsored coverage for adults.
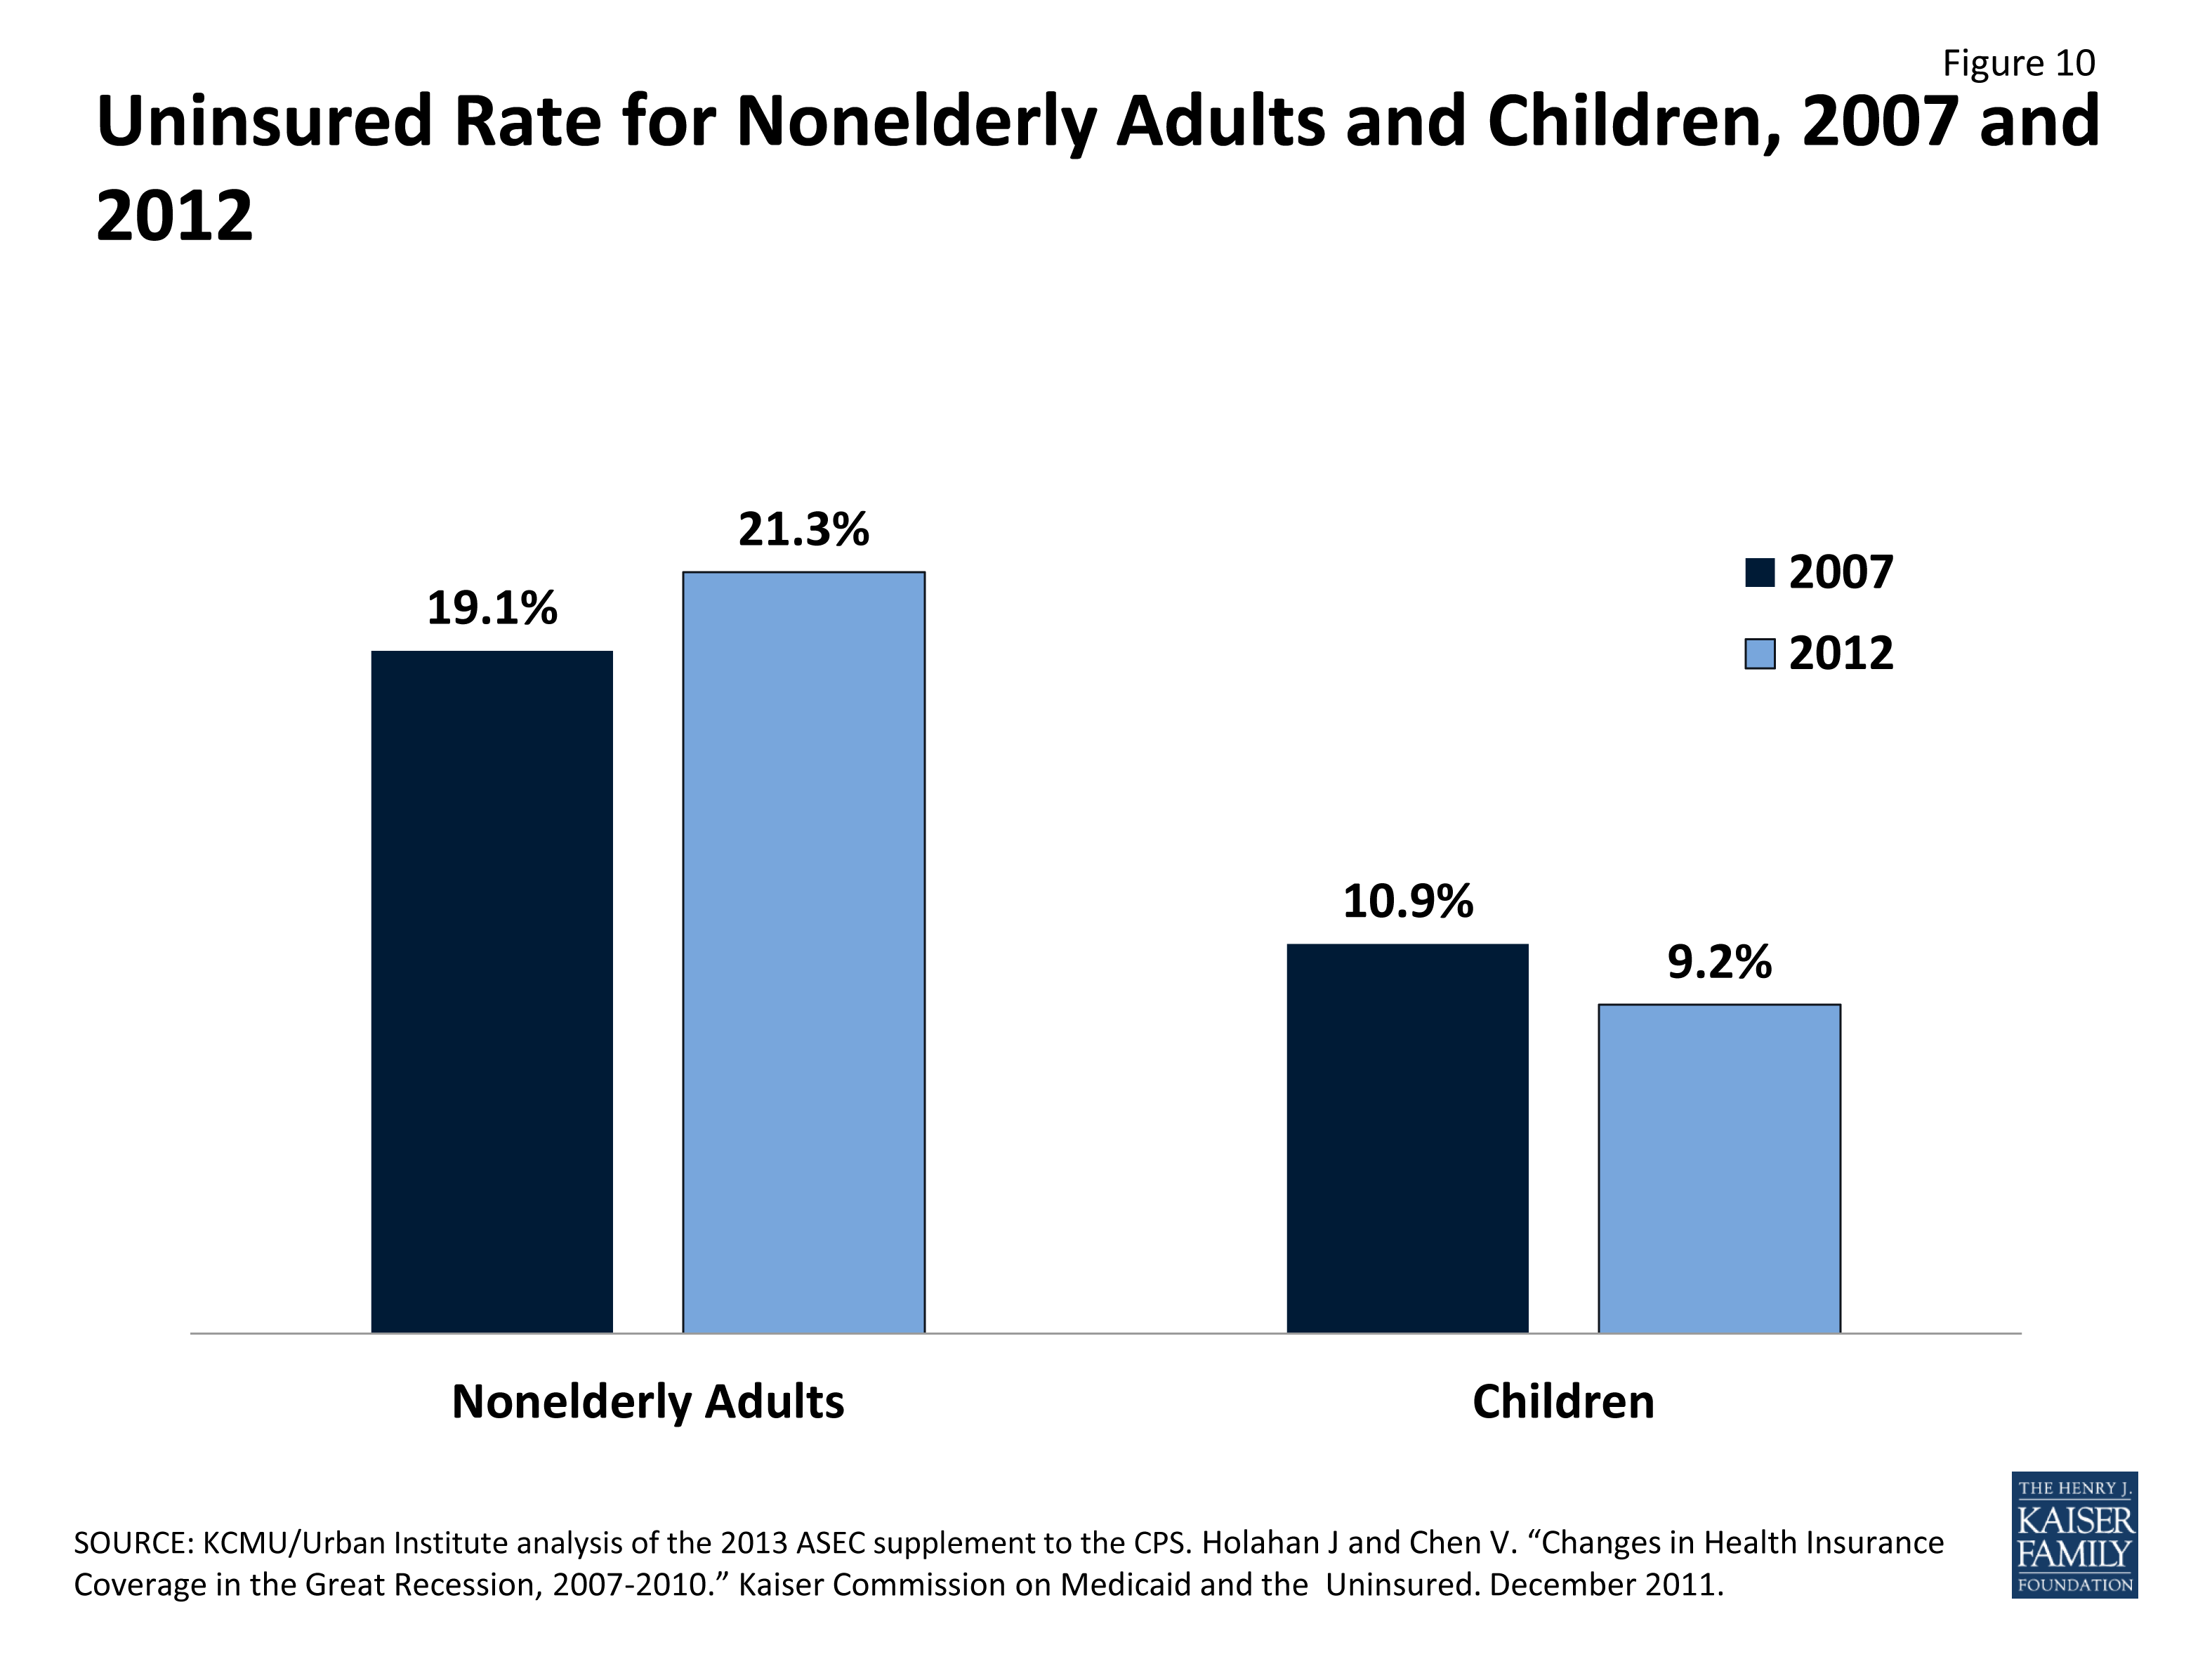
Figure 10: Uninsured Rate for Nonelderly Adults and Children, 2007 and 2012
In recent years, many states have used their Medicaid and CHIP programs as a foundation for broader health care coverage expansions. States have built on these public programs to leverage existing delivery and administrative systems. Between Fiscal Years (FY) 2009 and 2011, funding from ARRA through the enhanced Federal Matching Assistance Percentage (FMAP) helped states to maintain their Medicaid programs. In addition, some states have taken advantage of the option to use federal matching funds to expand Medicaid to childless adults before the broad ACA Medicaid expansion to individuals with income up to 138% of poverty goes into effect in 2014. As of January 2013, nine states (including the District of Columbia) provided Medicaid or Medicaid-comparable coverage to non-disabled adults. An additional 16 states provide more limited coverage to childless adults, although enrollment is closed in many of these programs.6
The uninsured rate among young adults, ages 19 to 25, improved from 2010 to 2011 but remained steady in 2012. The share of young adults that were uninsured decreased from 30.0% in 2010 to 27.9% in 2011, due in part to the ACA provision allowing them to remain on a parent’s private health plan until age 26.7 However, the share of uninsured was not statistically different in 2012 (27.4%), a share equal to that of adults between the ages of 26 and 34. Both of these groups continue to have the highest uninsured rate among adults. Young adults still have a high share of risk factors for being uninsured. Over one-third (37%) of all young adults are under poverty, and while most young adults are students and may have insurance options available through colleges and universities, 41% are non-students.8 Those without access to insurance from parents or from a university may face greater difficulty than other adults in finding affordable health insurance coverage.
Endnotes
Collins S, et al. 2012.
Holahan J and Chen V, 2011. “Changes in Health Insurance Coverage in the Great Recession, 2007-2010.” Kaiser Commission on Medicaid and the Uninsured. Available at: http://www.kff.org/medicaid/issue-brief/changes-in-health-insurance-coverage-in-the/
Bureau of Labor Statistics. (Accessed August 6, 2012) Available at: http://data.bls.gov/timeseries/LNS14000000
Schwartz K and Streeter S, 2011. “Health Coverage for the Unemployed.” Kaiser Commission on Medicaid and the Uninsured. Available at: http://www.kff.org/health-costs/issue-brief/health-coverage-for-the-unemployed/
Holahan et al., 2013. “Reversing the Trend? Understanding the Recent Increase in Health Insurance Coverage among the Nonelderly Population.” Kaiser Commission on Medicaid and the Uninsured. Available at: http://www.kff.org/uninsured/issue-brief/reversing-the-trend-understanding-the-recent-increase-in-health-insurance-coverage-among-the-nonelderly-population/
Heberlein M, et al. 2013.
KCMU analysis of 2013 National Health Interview Survey data.
KCMU/Urban Institute analysis of 2013 ASEC Supplement to the CPS.