
State Fiscal Conditions and Medicaid: 2014 Update
Overview of Medicaid Financing Before the ACA
Medicaid Financing Structure
The Medicaid program is jointly funded by states and the federal government. In federal fiscal year (FFY) 2012, Medicaid expenditures (both state and federal spending) totaled over $415 billion. The federal government guarantees matching funds (FMAP) to states for qualifying Medicaid expenditures (payments states make for covered Medicaid services provided by qualified providers to eligible Medicaid enrollees.) The FMAP is calculated annually using a formula set forth in the Social Security Act which is based on a state’s average personal income relative to the national average. States with lower average personal incomes have higher FMAPs. Personal income data are lagged, so data used for FFY 2014 FMAPs are from the three years of 2009 to 2011. According to the statutory formula, for FFY 2014, the FMAP varies across states from a floor of 50 percent to a high of 73.05 percent. (Figure 1) This means that every $1 of state spending on the program is matched with at least $1 of federal funds, ranging up to $2.71 for every state dollar spent on Medicaid.1
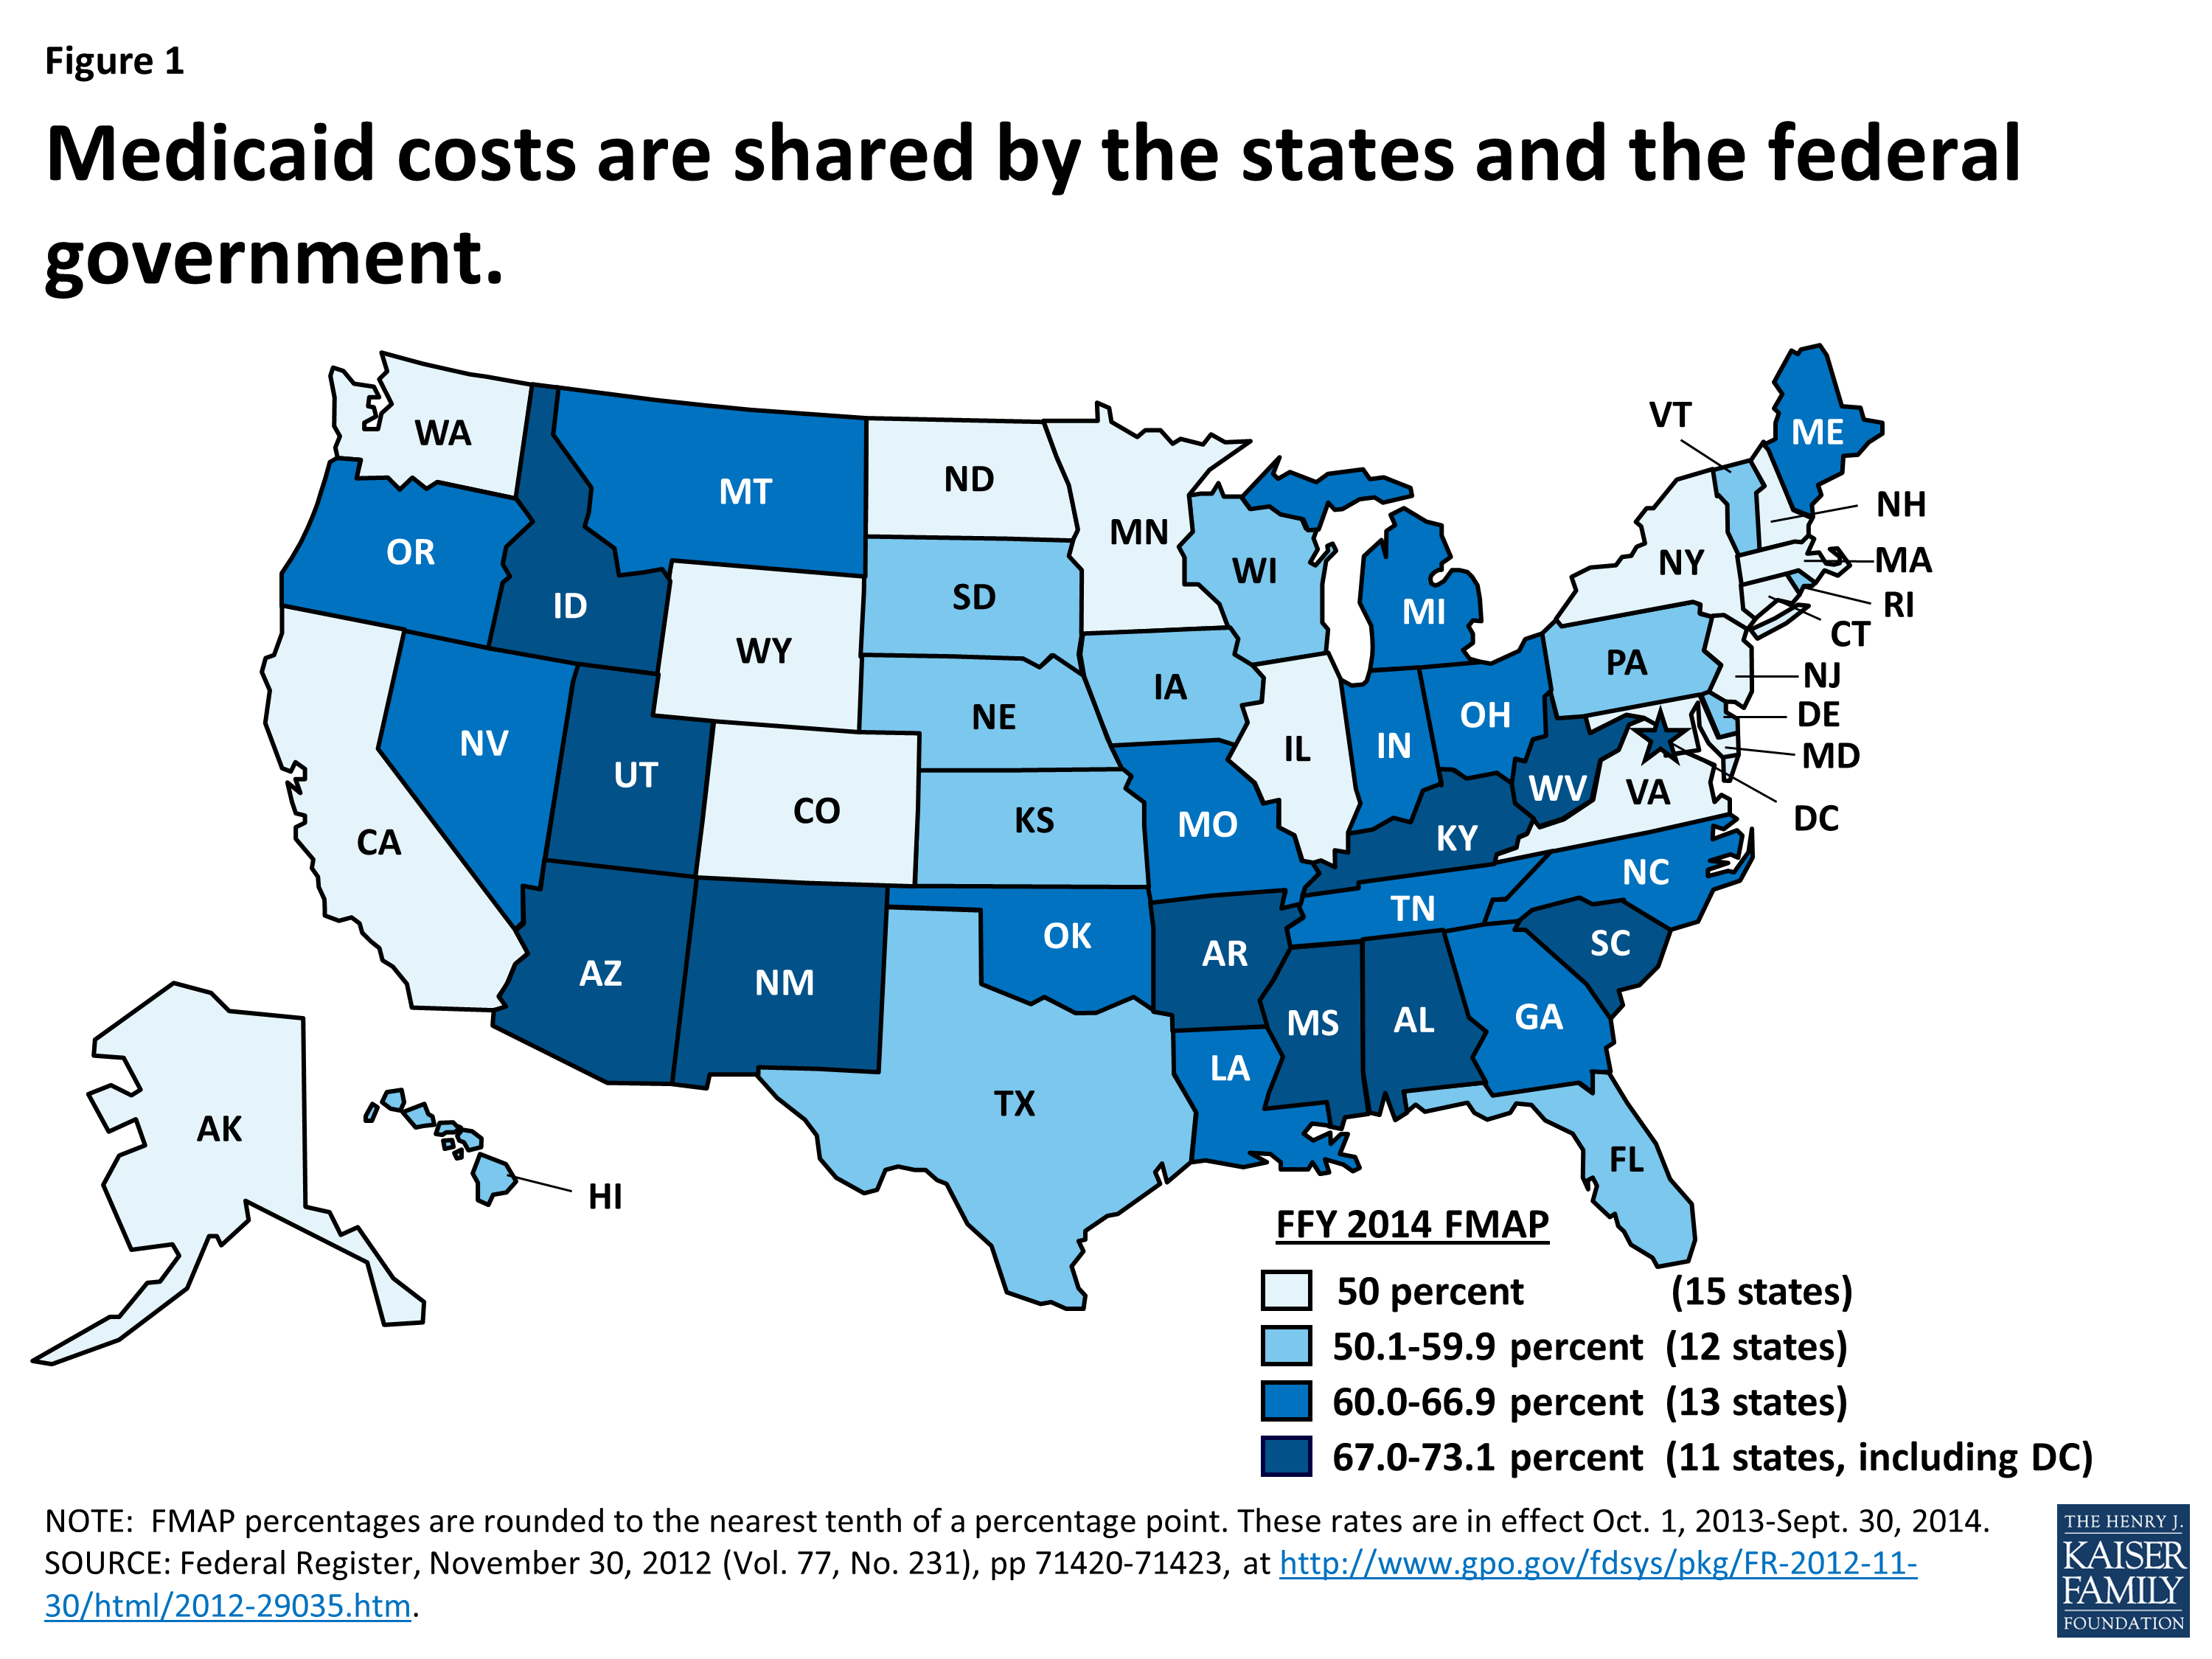
Figure 1
The remaining share of Medicaid funding comes from state sources, primarily appropriations from state general funds. States also fund Medicaid with “other state funds” which may include funding from local governments or revenue collected from provider taxes and fees. Because of the statutory requirement that the federal share never falls below 50 percent, federal funds have always represented the largest share of Medicaid financing covering about 6 out of 10 dollars spent on Medicaid. (Figure 2) The only recent exception was at the height of the economic downturn, when the federal government assumed a larger share of Medicaid financing to support states as their own revenues declined.
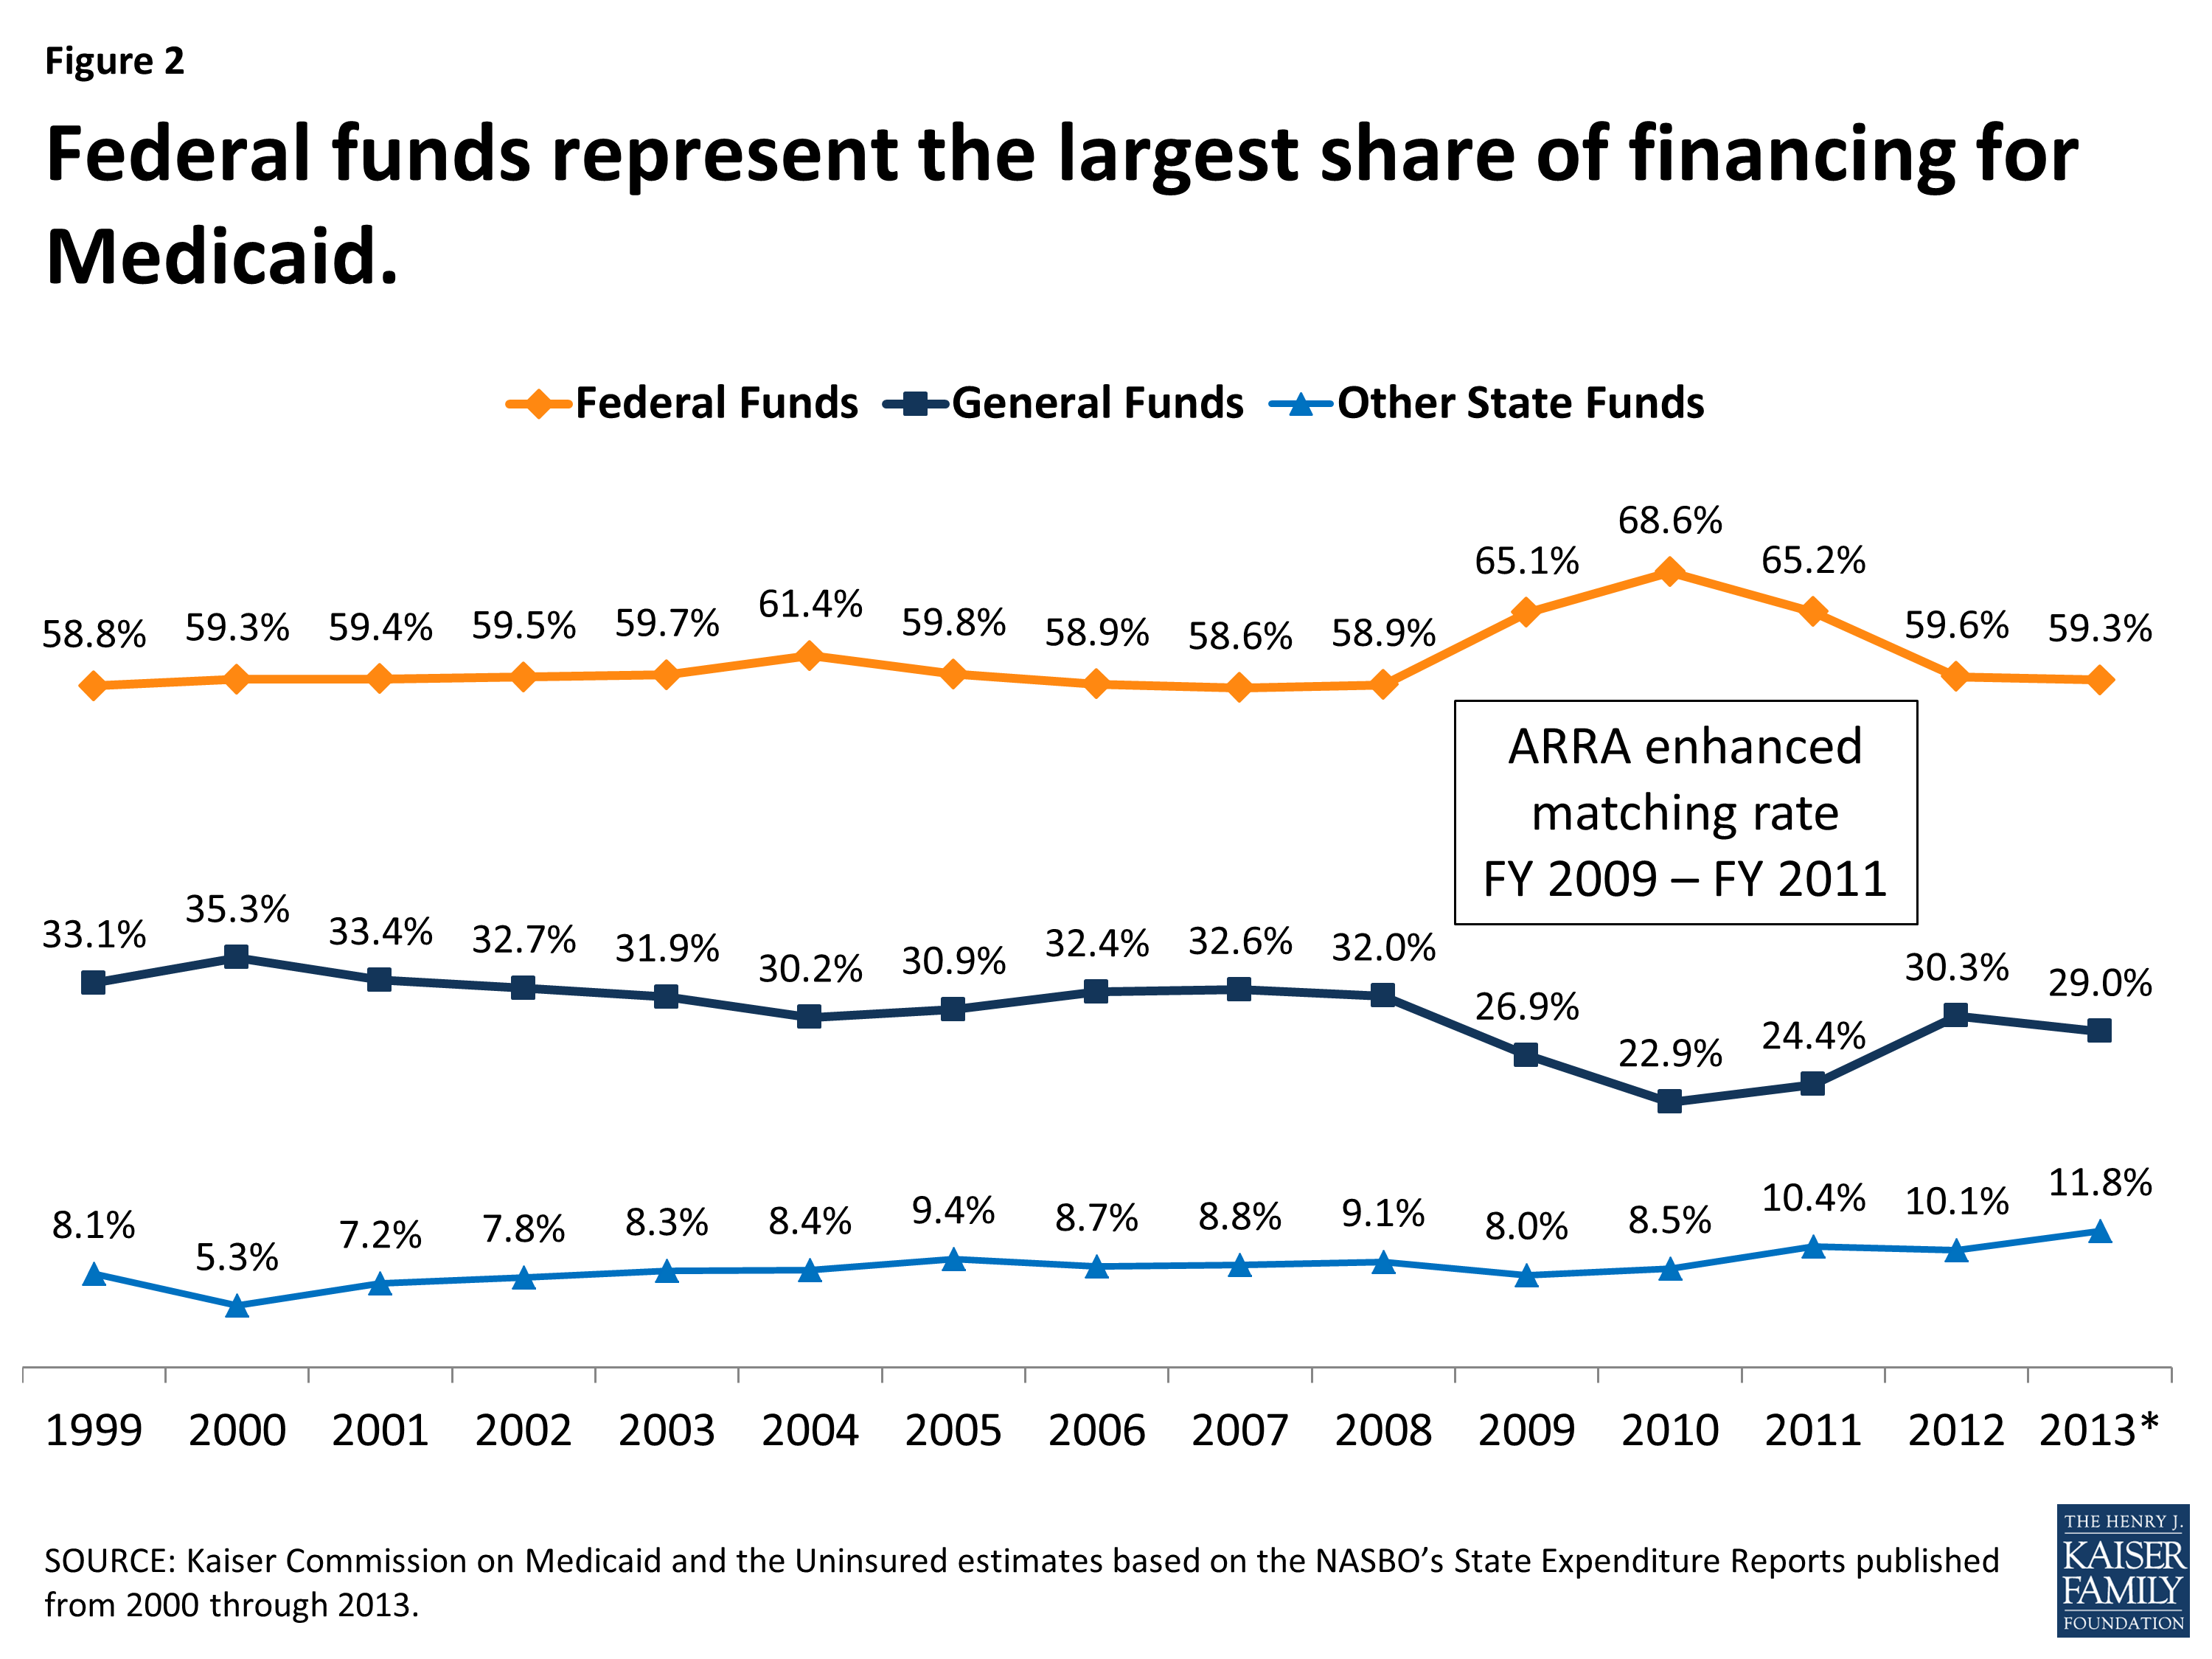
Figure 2
Over the past decade, states’ use of other funds has increased slightly but steadily. (Figure 2) This is likely tied to states’ increased reliance on provider taxes to finance the state share of Medicaid with all but one state having at least one provider tax that helps to finance their share of Medicaid spending.2
Medicaid’s Role in State Budgets
Unlike the Federal government, states generally have balanced budget requirements, taking into account the amount of revenue coming in from a state’s own resources as well as federal revenues. State lawmakers must balance competing priorities across budget expenditure categories. They also face decisions about the amount of revenue to collect from their own resources, which affect the amount of funding available to finance these priorities. Even in years of economic growth, state lawmakers face this pressure of balancing priorities. When looking at the different expenditure categories, Medicaid’s role in state budgets is unique. Medicaid acts both an expenditure item and a source of federal revenue in state budgets. When looking at total spending for FY 2012, Medicaid exceeded total spending on K-12 education and is projected to do so in FY 2013.3 Total spending includes state expenditures of federal funds as well as expenditures of states’ own resources. Due to the financing structure and federal matching dollars tied to Medicaid spending, the Medicaid program is the largest source of federal funds for states, accounting 44.2 percent of all federal funds for states in FY 2012.
States spend a smaller share of their general fund resources on Medicaid. In FY 2012, Medicaid accounted for 18.1 percent of all state general fund spending a far second to spending on K-12 education, which accounted for 35.3 percent of all state general fund spending. These shares of state general fund spending have remained fairly constant over the past decade with a slight uptick in the share of general fund spending on Medicaid in recent years in part due to the expiration of the enhanced match enacted under ARRA. (Figures 3 and 4)
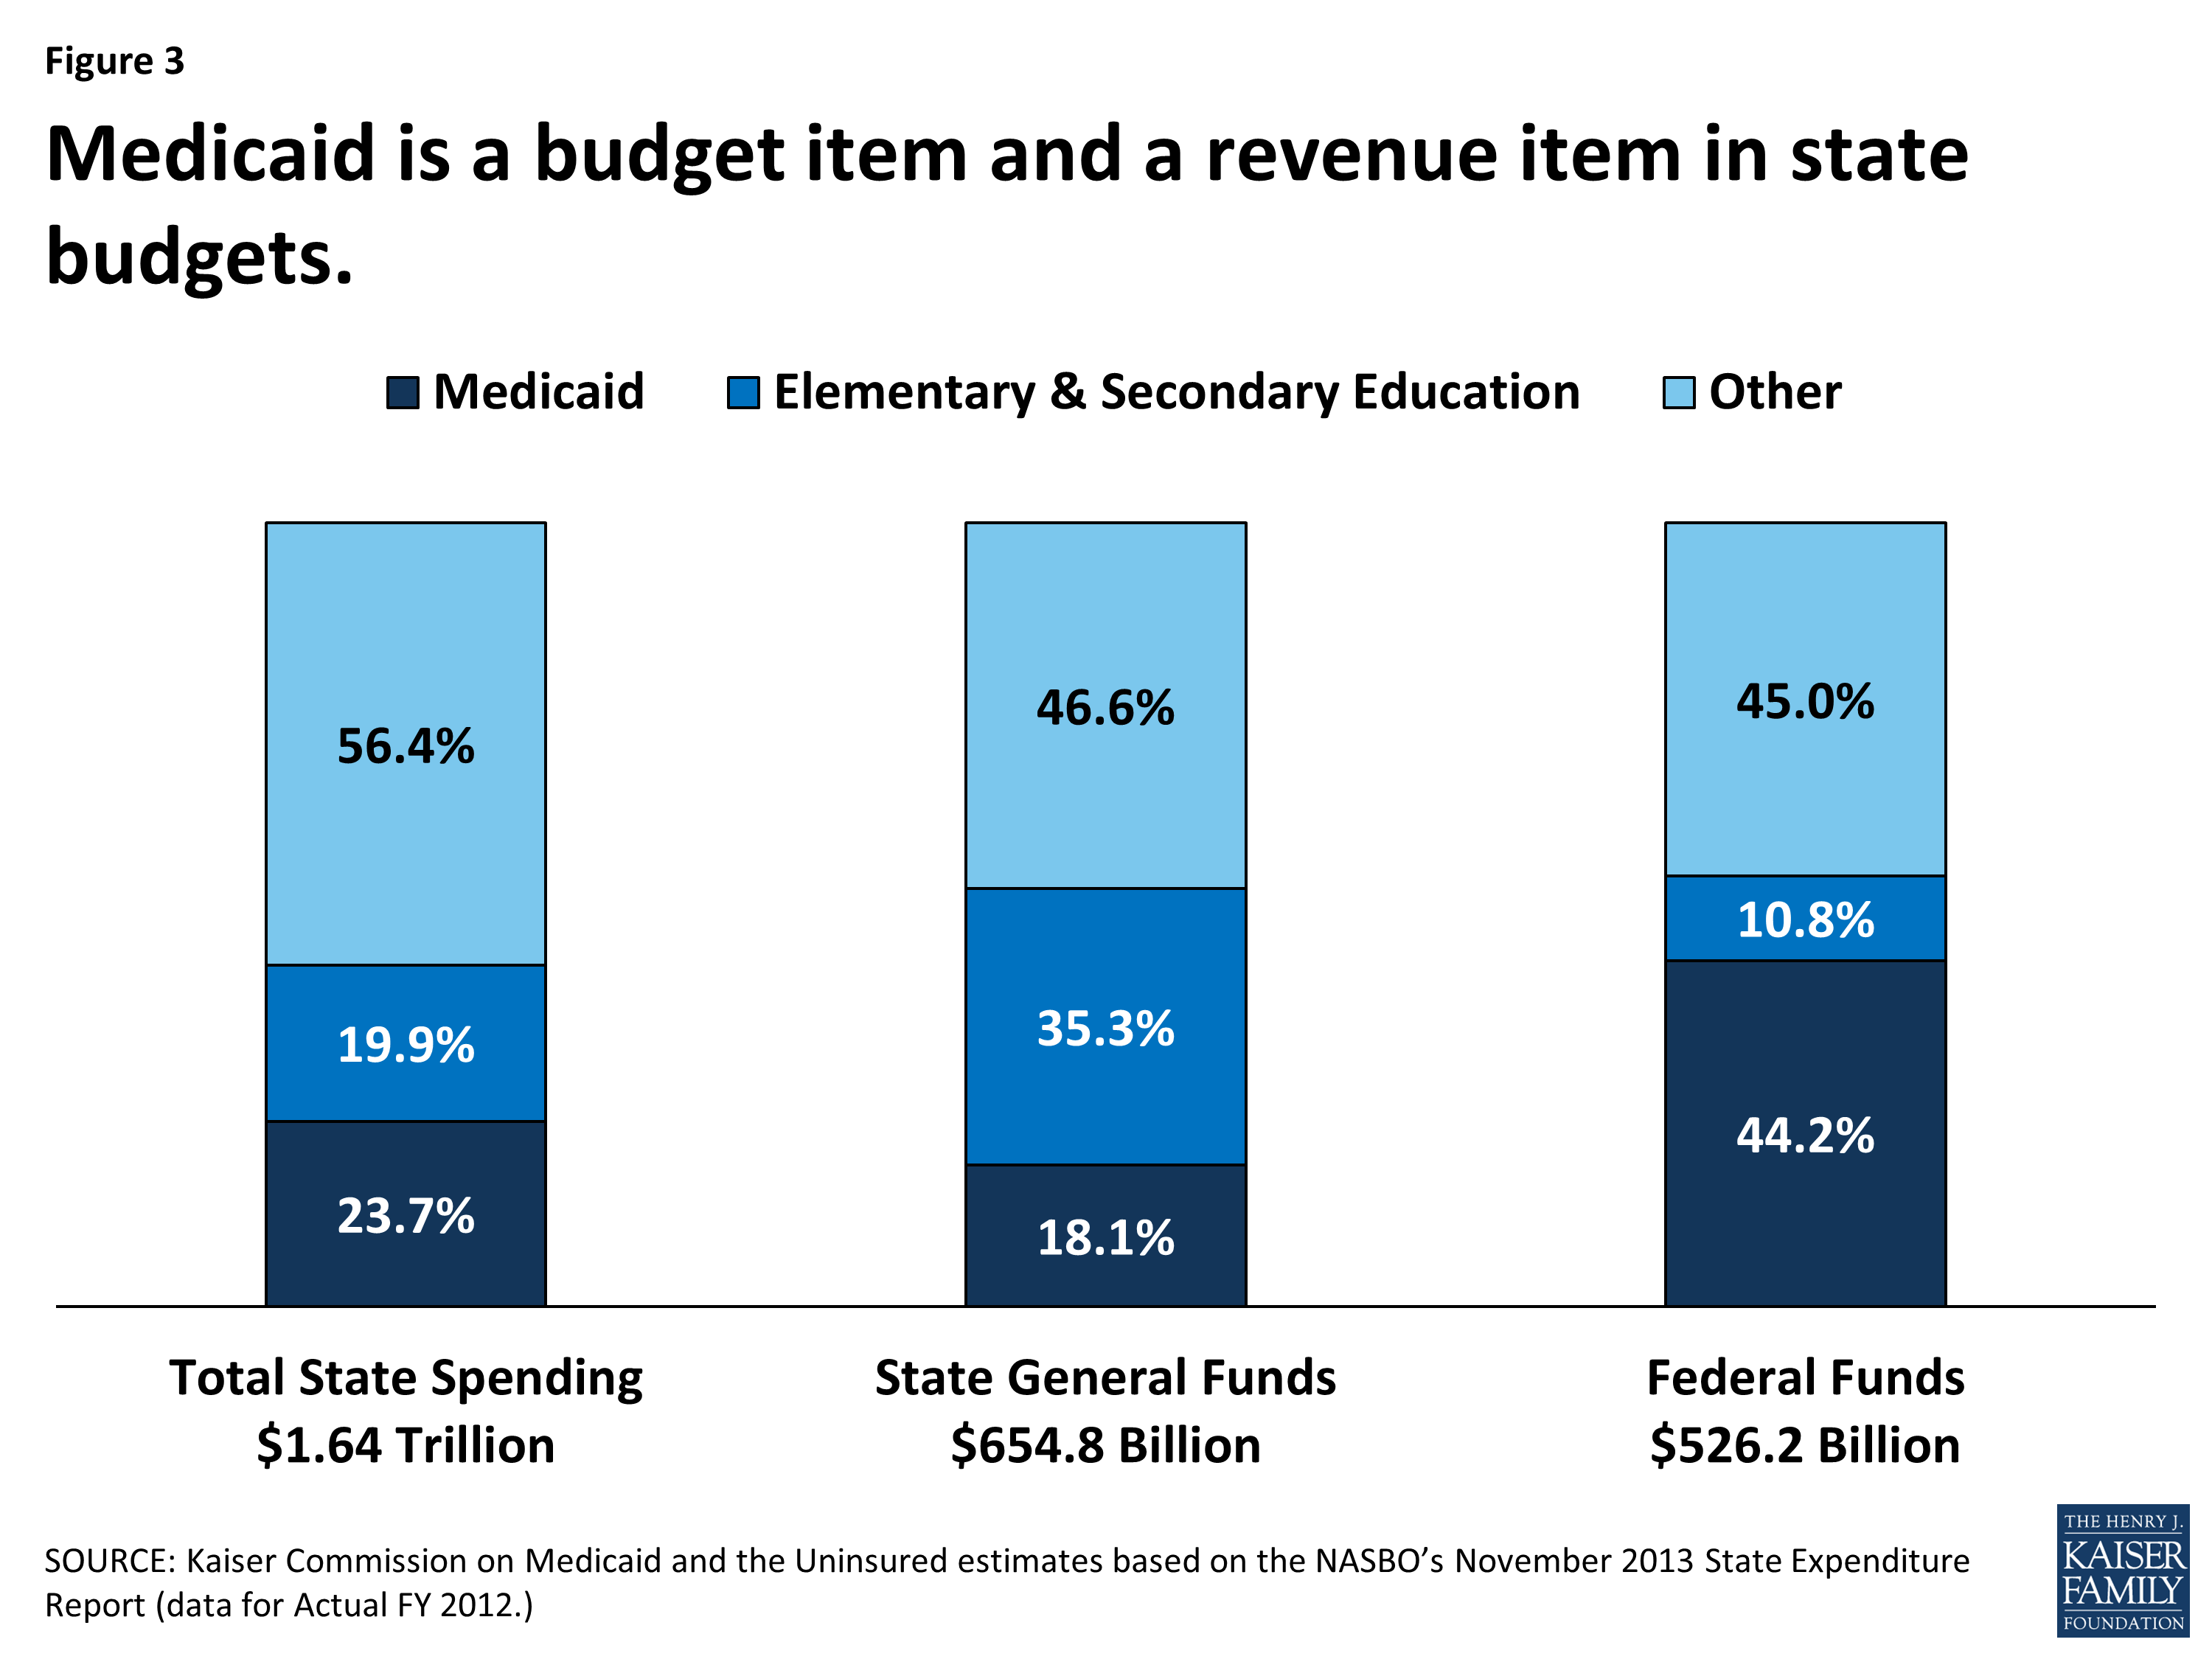
Figure 3
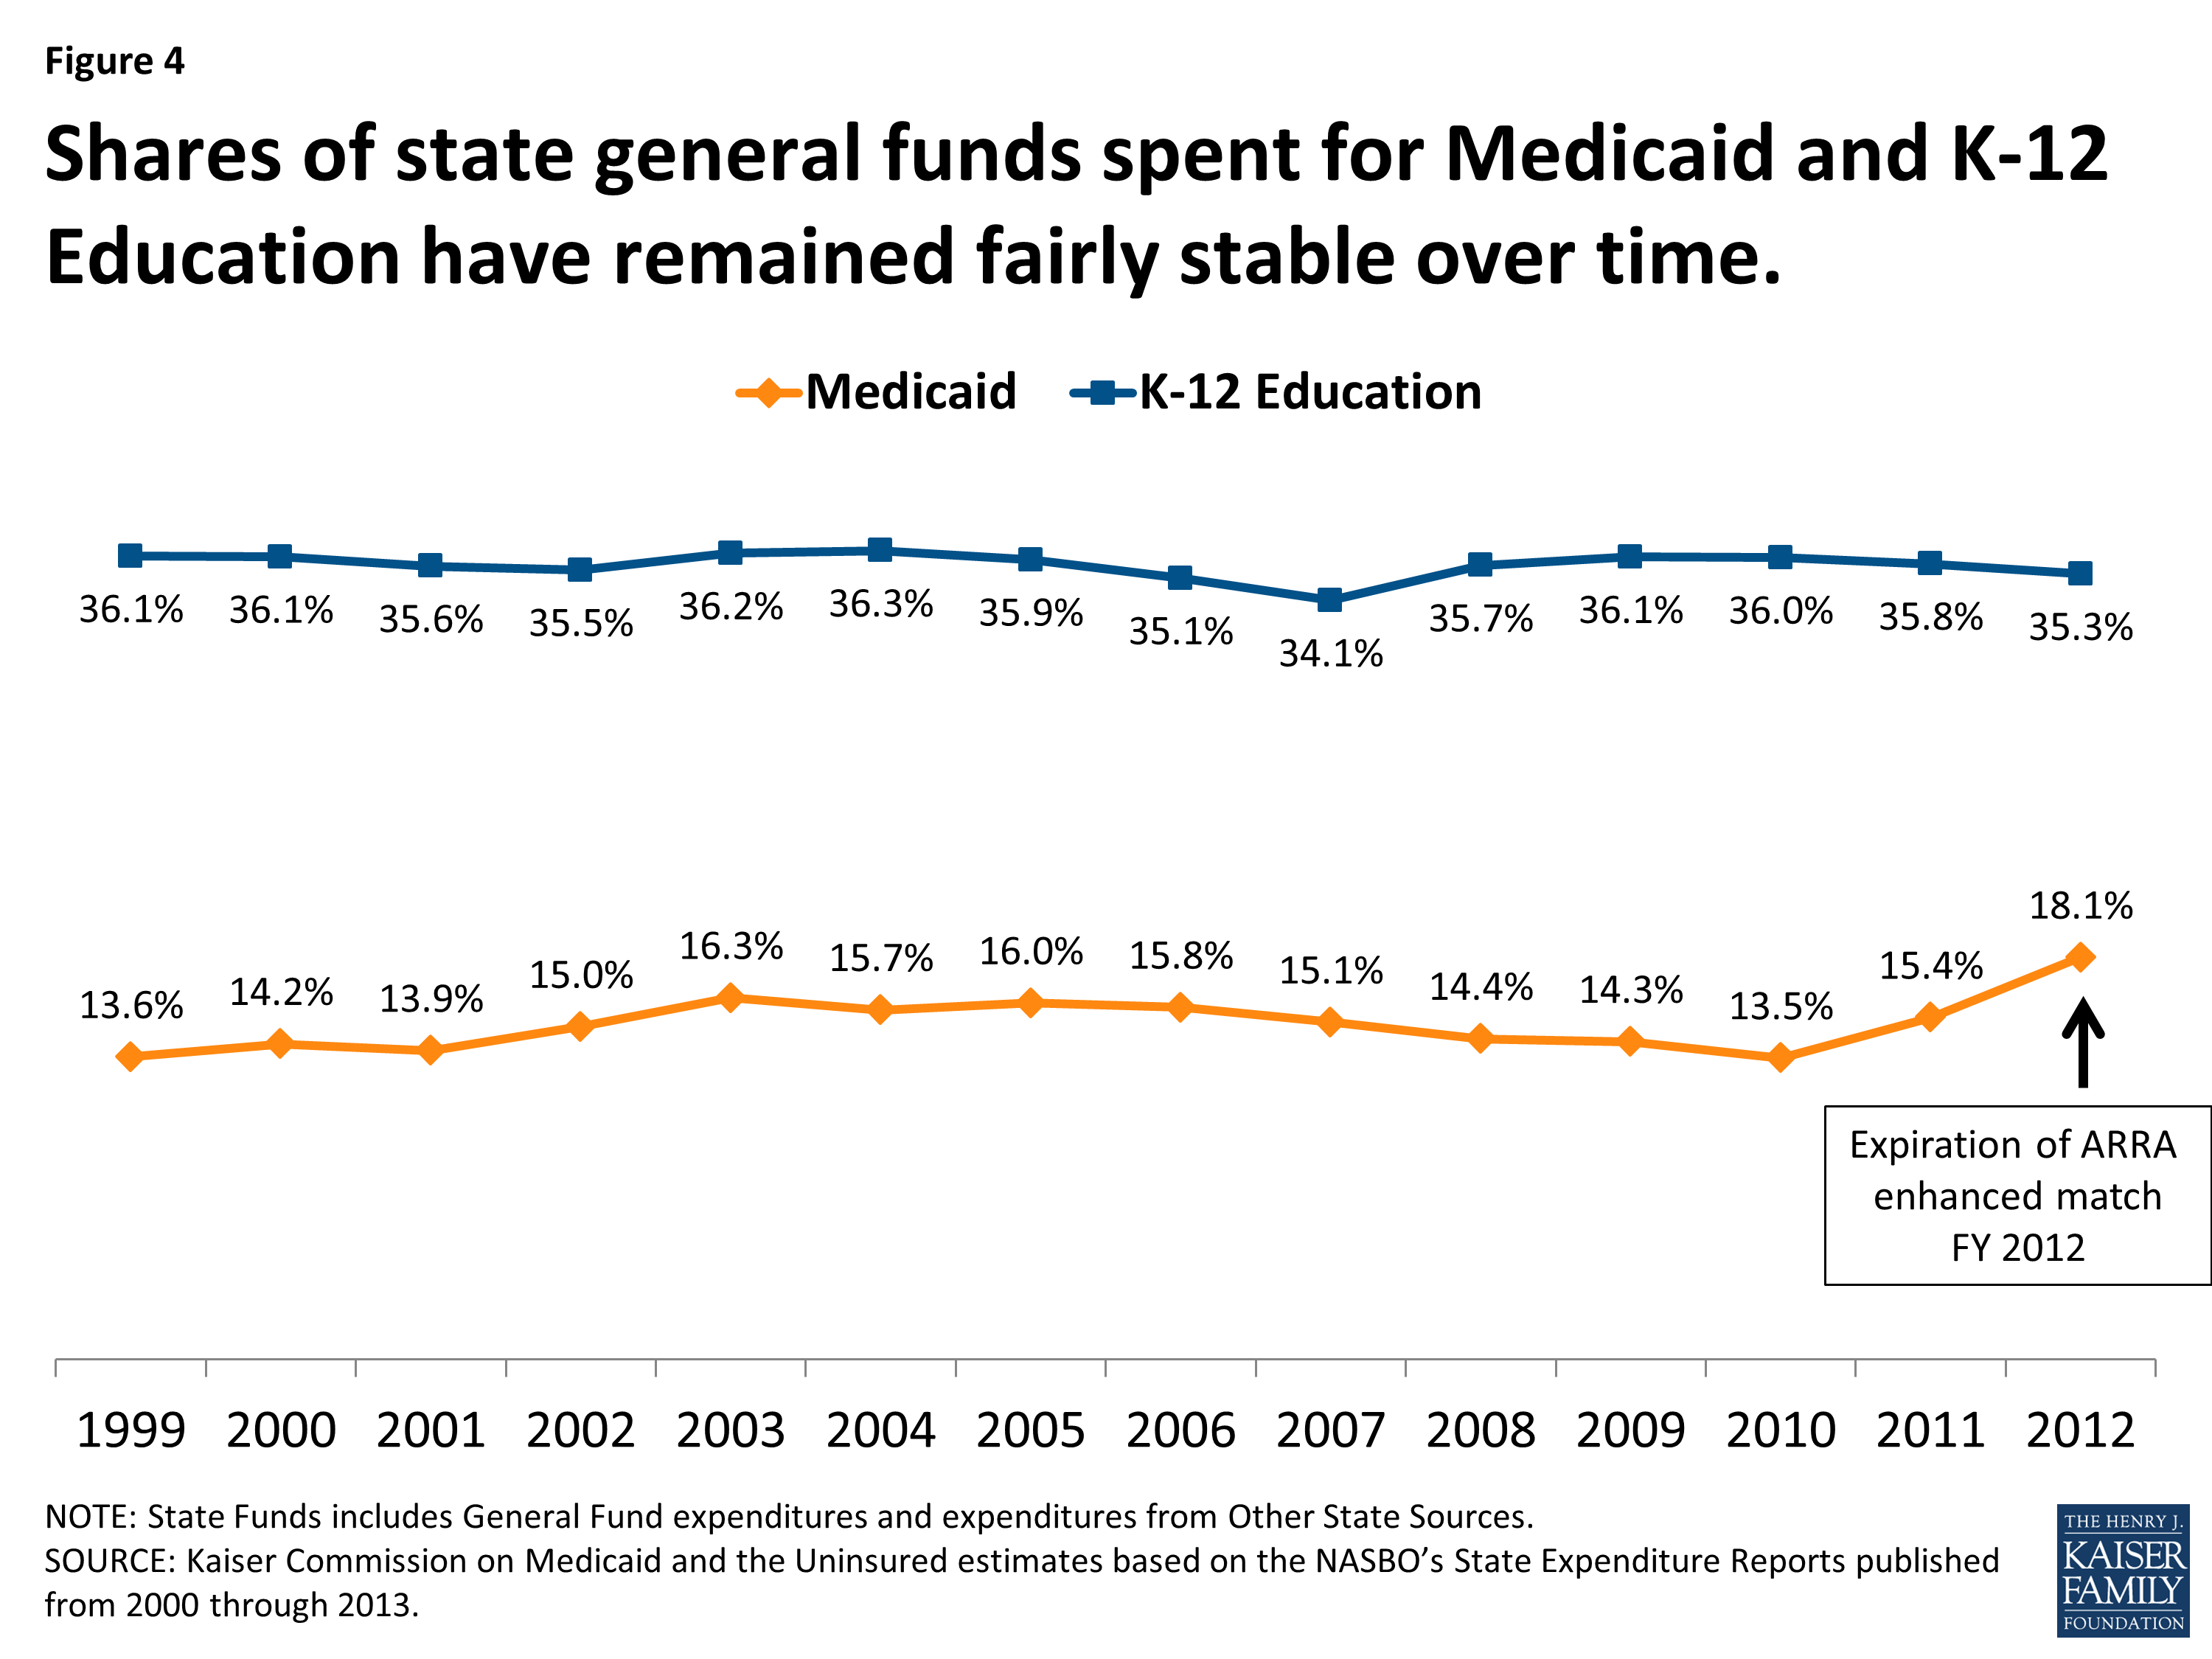
Figure 4
Medicaid and the Economy
Economic conditions, in addition to policy changes, have a substantial effect on Medicaid spending and enrollment. Medicaid is a counter-cyclical program. During economic downturns individuals lose jobs, incomes decline, and more people qualify and enroll in Medicaid which increases program spending. Figure 5 shows these increases during the economic downturn in 2001-2003 and again in 2009-2011. At the same time, economic downturns negatively impact state tax revenues. This places additional pressure on state budgets as demand for other forms of assistance (i.e. food stamps and unemployment benefits) also increases. During economic downturns, states face difficulty balancing these pressures and affording their share of Medicaid spending increases.
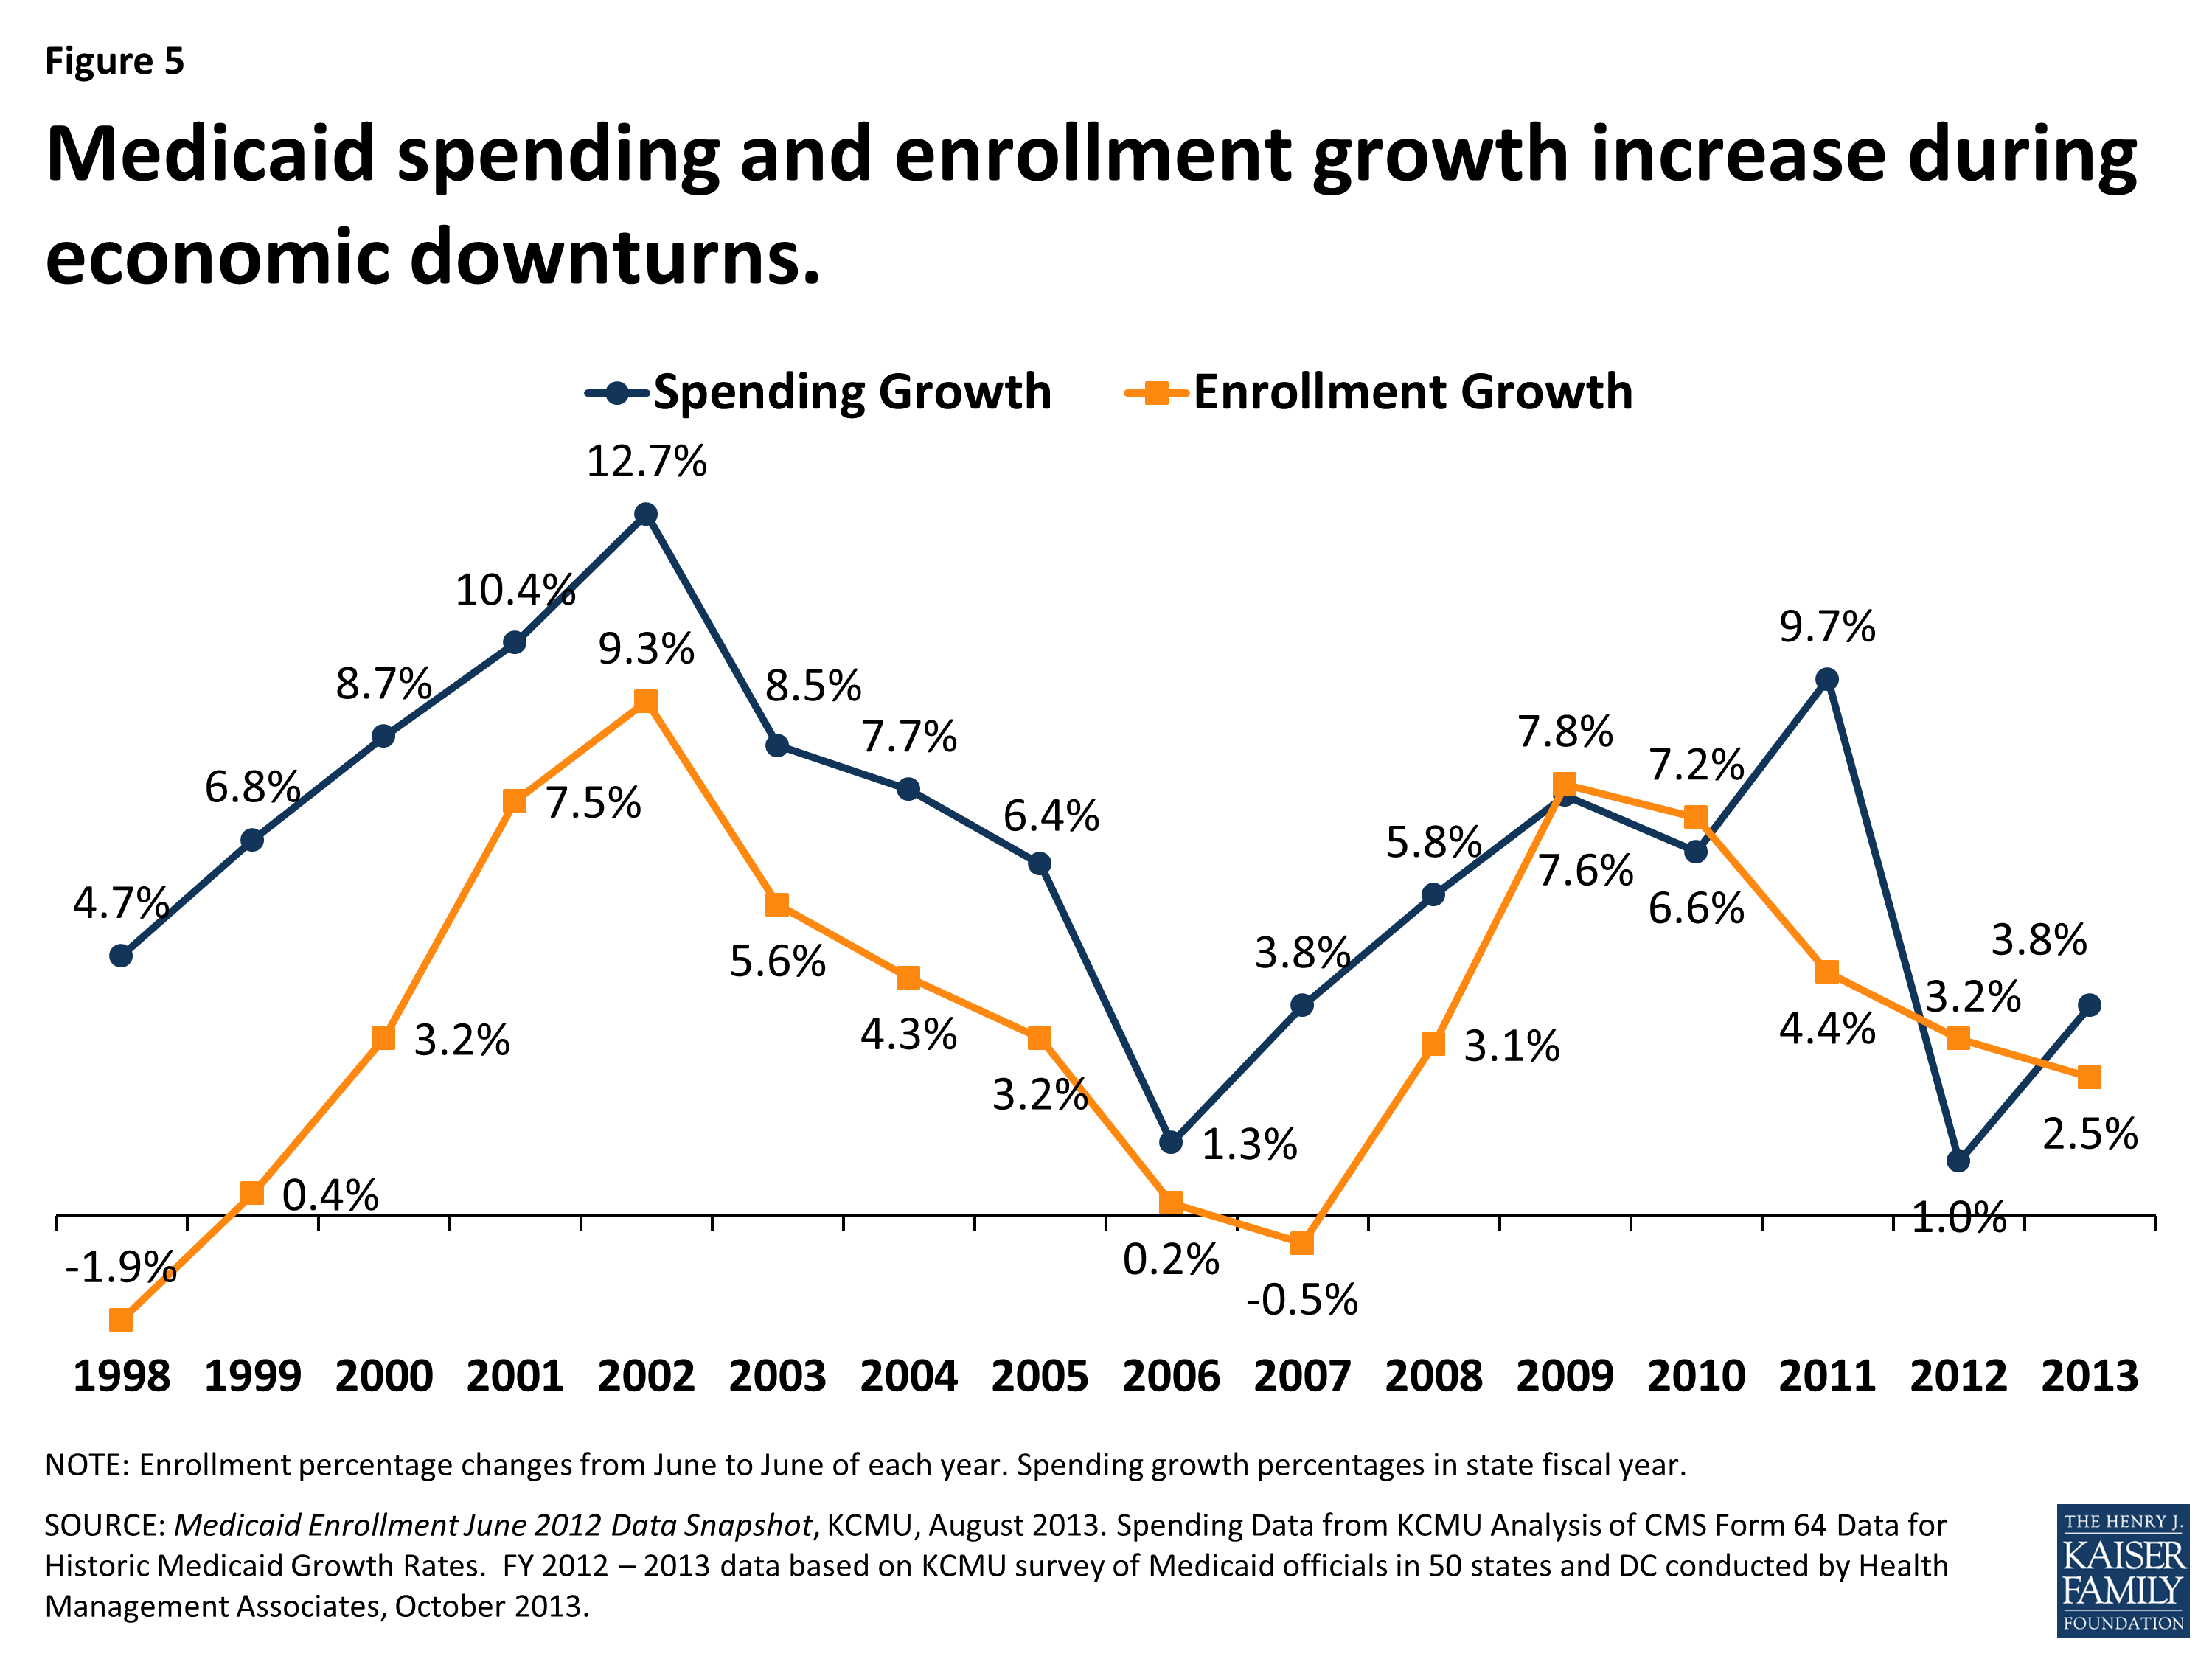
Figure 5
In response, Congress has twice passed temporary increases to the FMAP rates to help support states during economic downturns, most recently in 2009 as part of the American Recovery and Reinvestment Act (ARRA.) The most significant source of fiscal relief to states in the ARRA was a temporary increase in the federal share of Medicaid costs. To be eligible for the ARRA funds, states could not restrict eligibility or tighten enrollment procedures in Medicaid or CHIP. The ARRA-enhanced matching rates provided states with over $100 billion in total funds over 11 quarters, ending in June 2011. The increased federal funds resulted in declines in state Medicaid spending for the first time in the program’s history. (Figure 6) State spending on the program increased substantially in FY 2012 due to the expiration of the enhanced-matching rate.

Figure 6
Recent Trends in the economy
States are beginning to see slow, but sustained improvements in the economy following the worst recession since the Great Depression. Gross State Product (GSP,) a measure of a state’s economic activity, has shown annual growth for the past three years nationally. All but one state (Connecticut) showed positive GSP growth from 2011 to 2012, ranging from 0.2% up to 4.8%. (Figure 7)
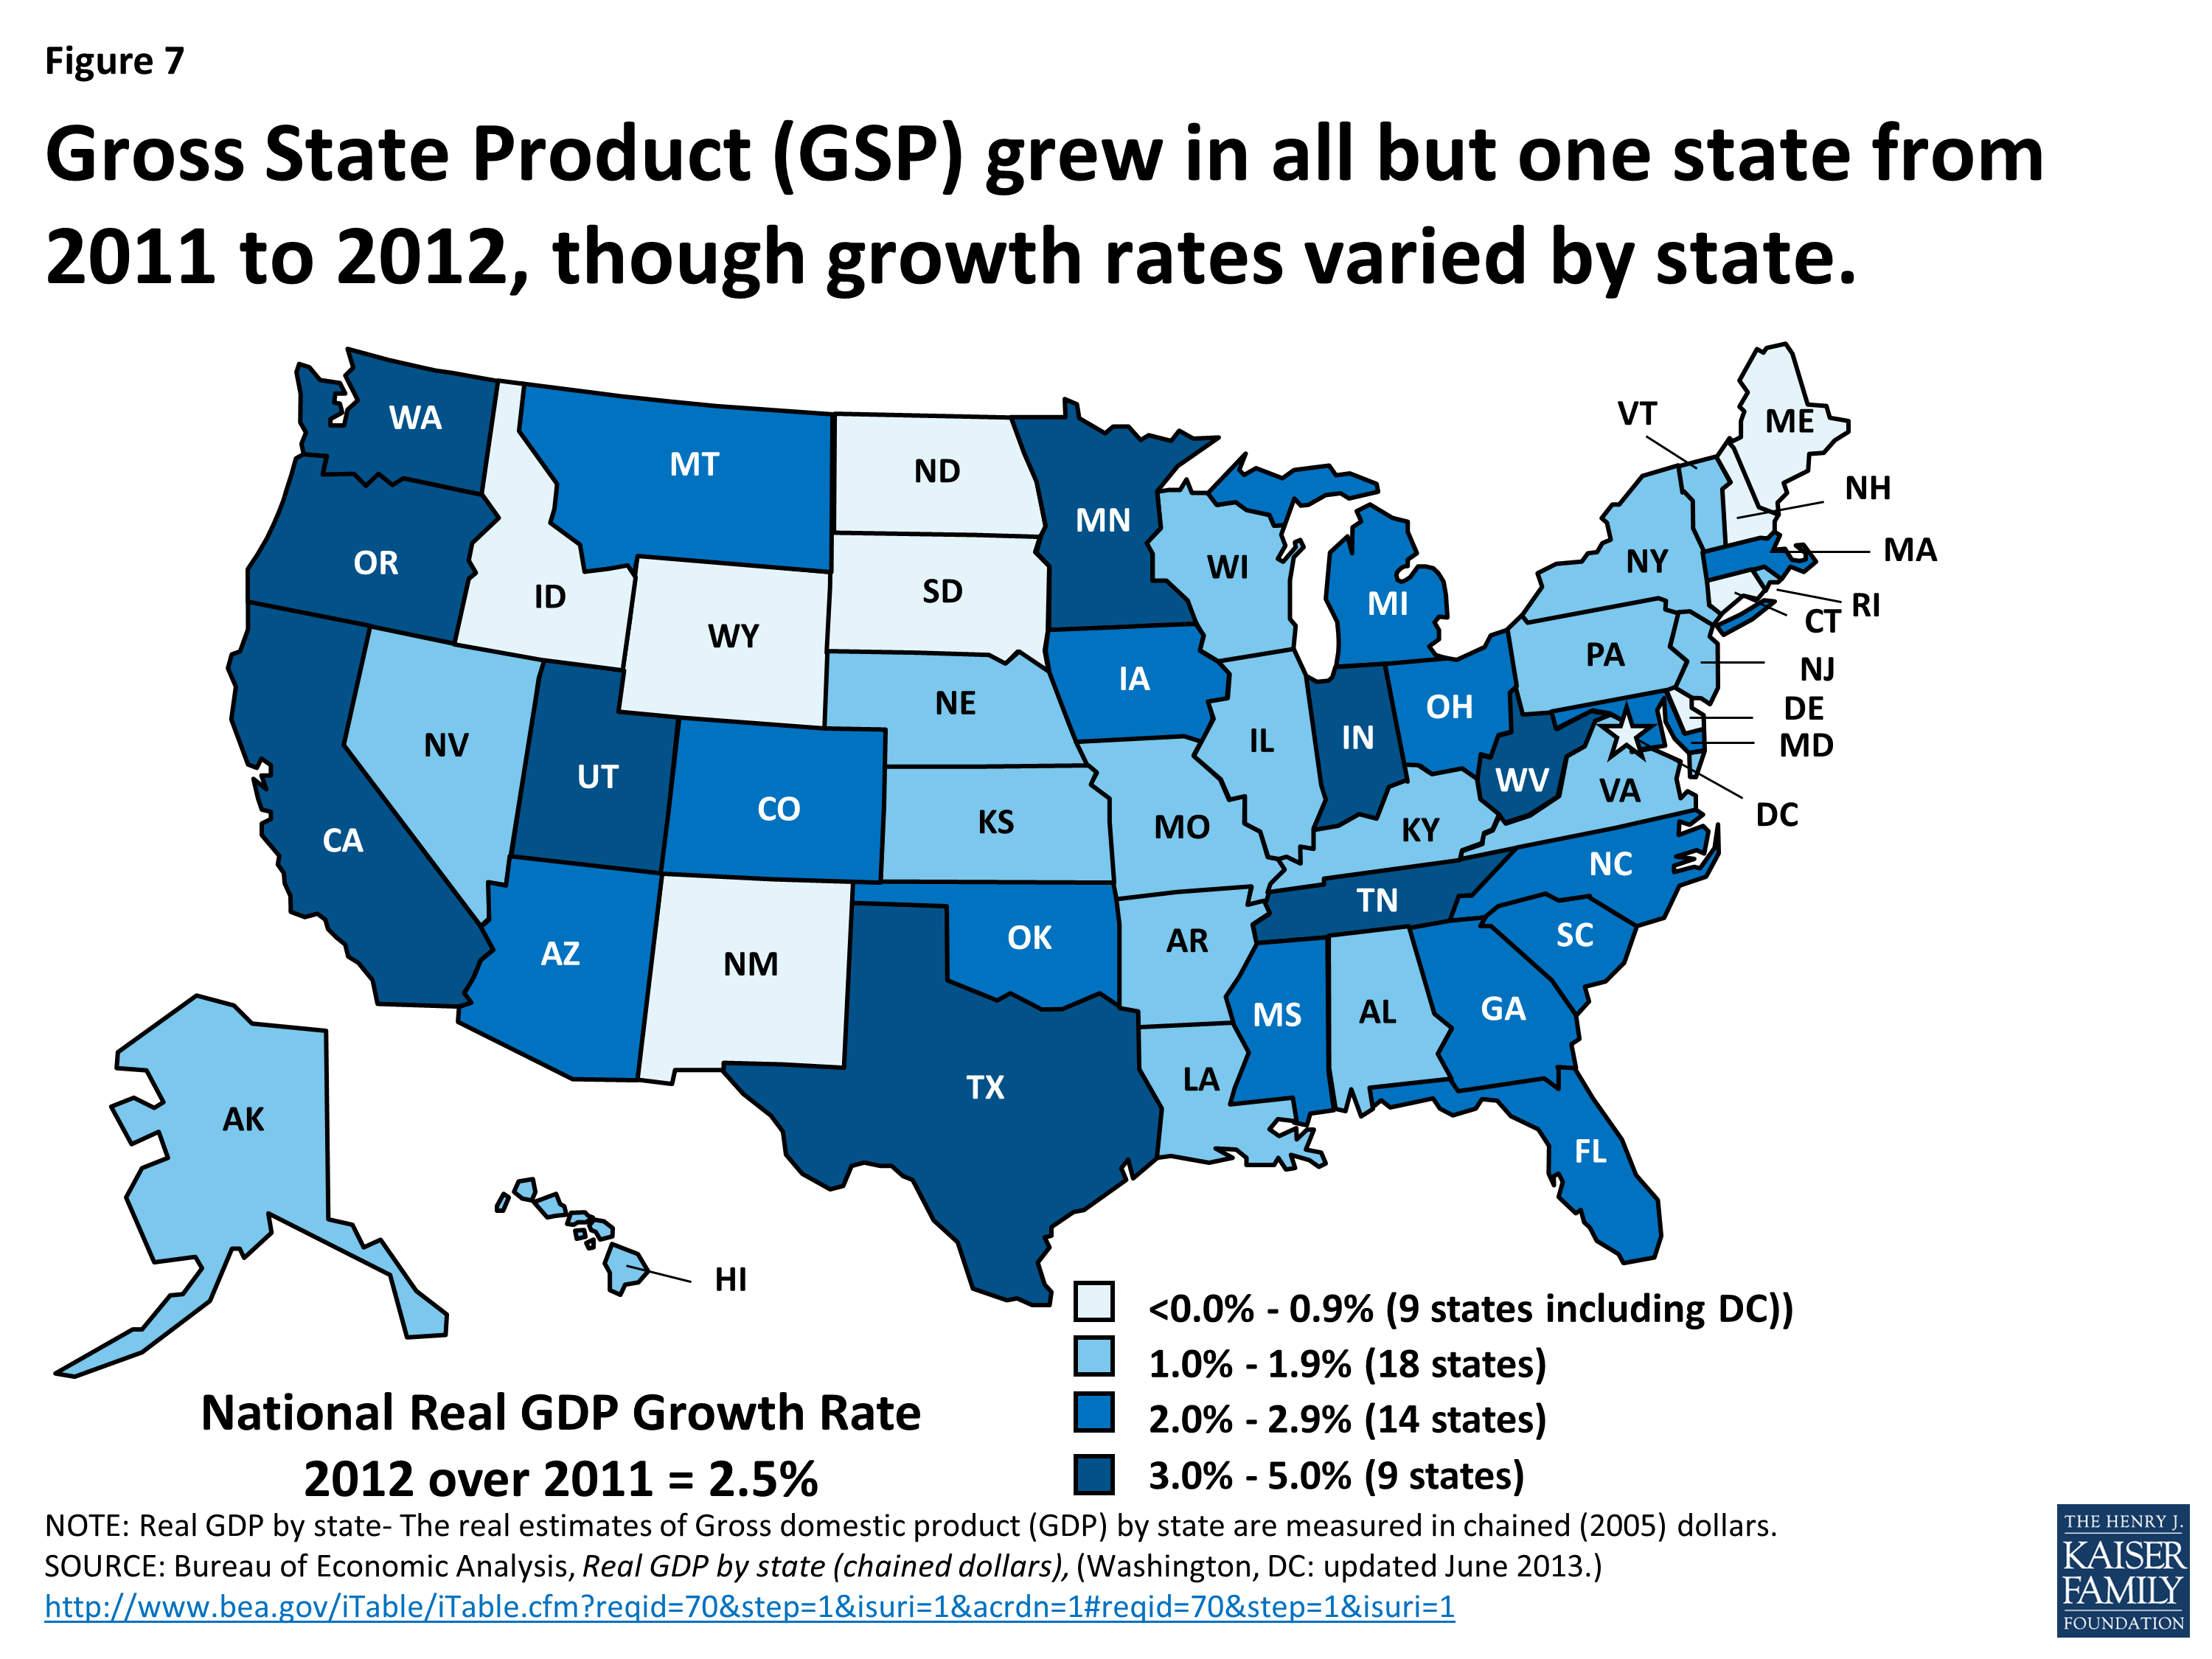
Figure 7
Data from the US Census Bureau show continued growth in state tax collections through the end of calendar year 2013, marking 16 consecutive quarters of year over year growth. As anticipated, tax revenue collections in the third and fourth quarters of 2013 continued to grow but at a slower rate than in the first and second quarters of the year.4 (Figure 8) At the same time, the national unemployment rate has continued to slowly decline. In December 2013, the unemployment rate fell below 7.0 percent for the first time since November 2008. Since December, the rate has remained around 6.7 percent.5 After 49 months of private-sector job growth, private sector employment now exceeds levels reported at the start of the Great Recession. However, there were still 422,000 fewer jobs in March 2014 than when the Great Recession began due to continued declines in government employment. An estimated 10.5 million people are unemployed, over one-third of whom are long-term unemployed (those actively looking for work for 27+ weeks.6) While unemployment has declined in most states, four had rates at or above eight percent in January 2014. (Figure 9)
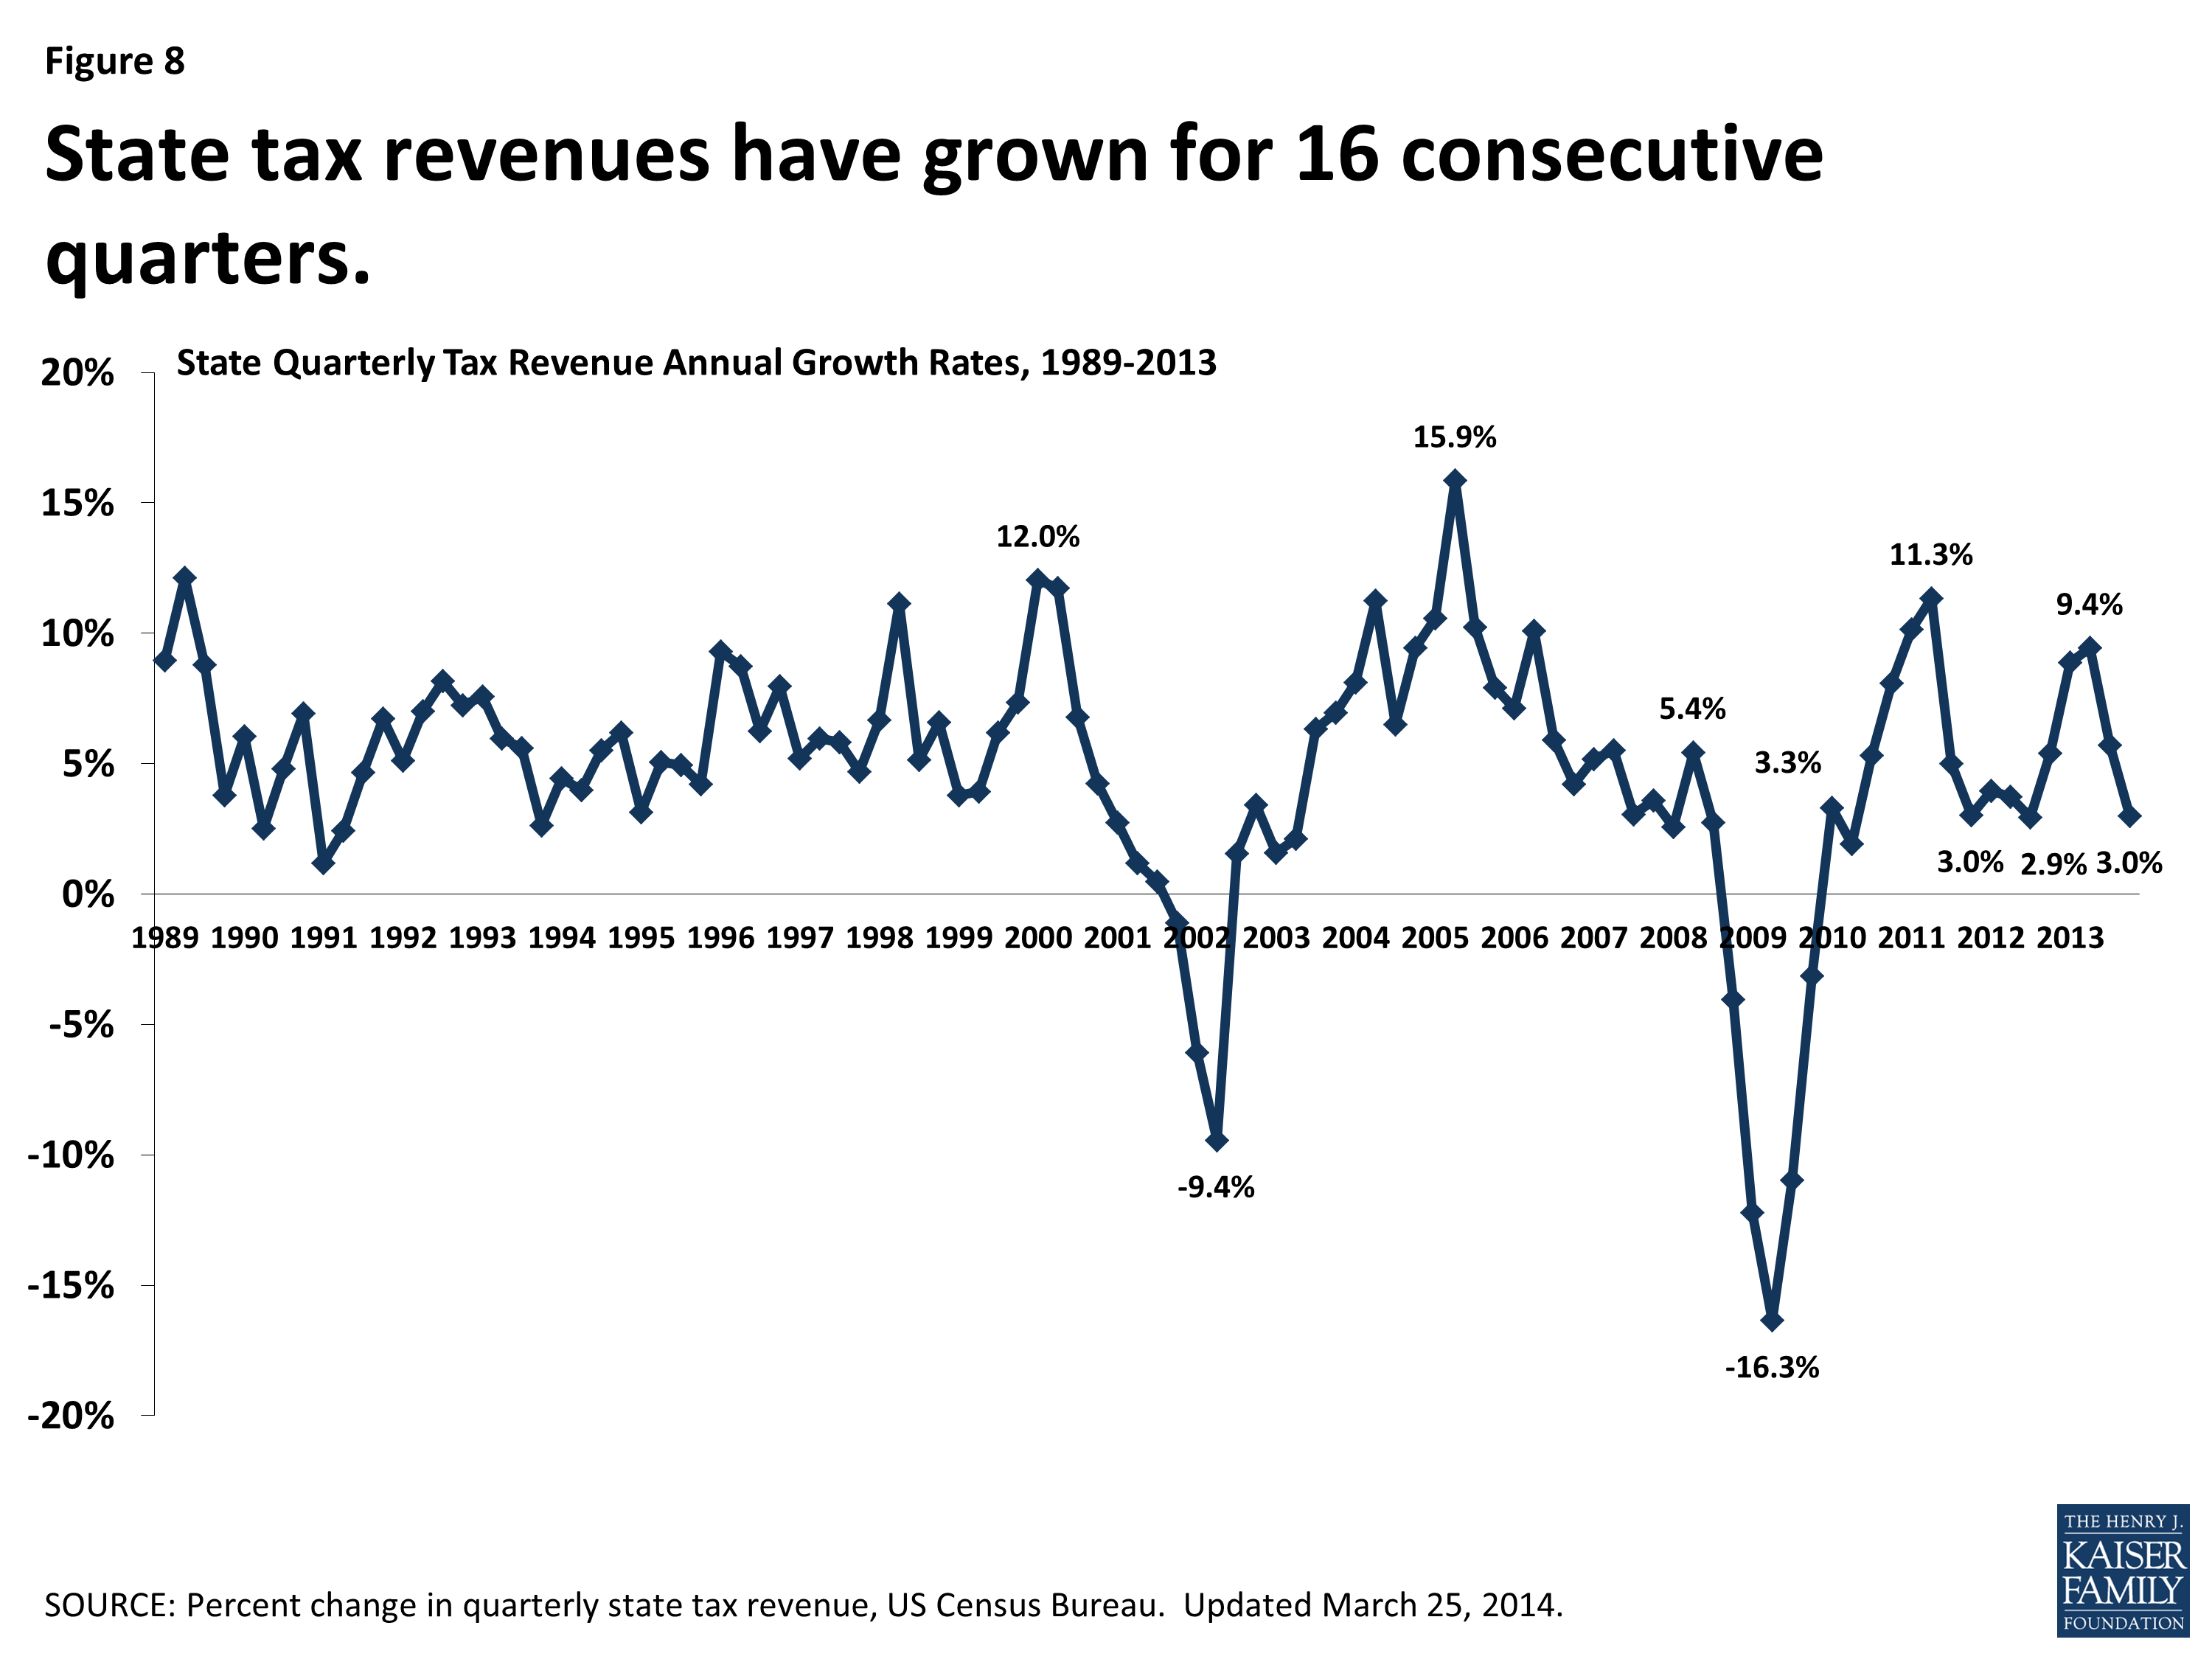
Figure 8
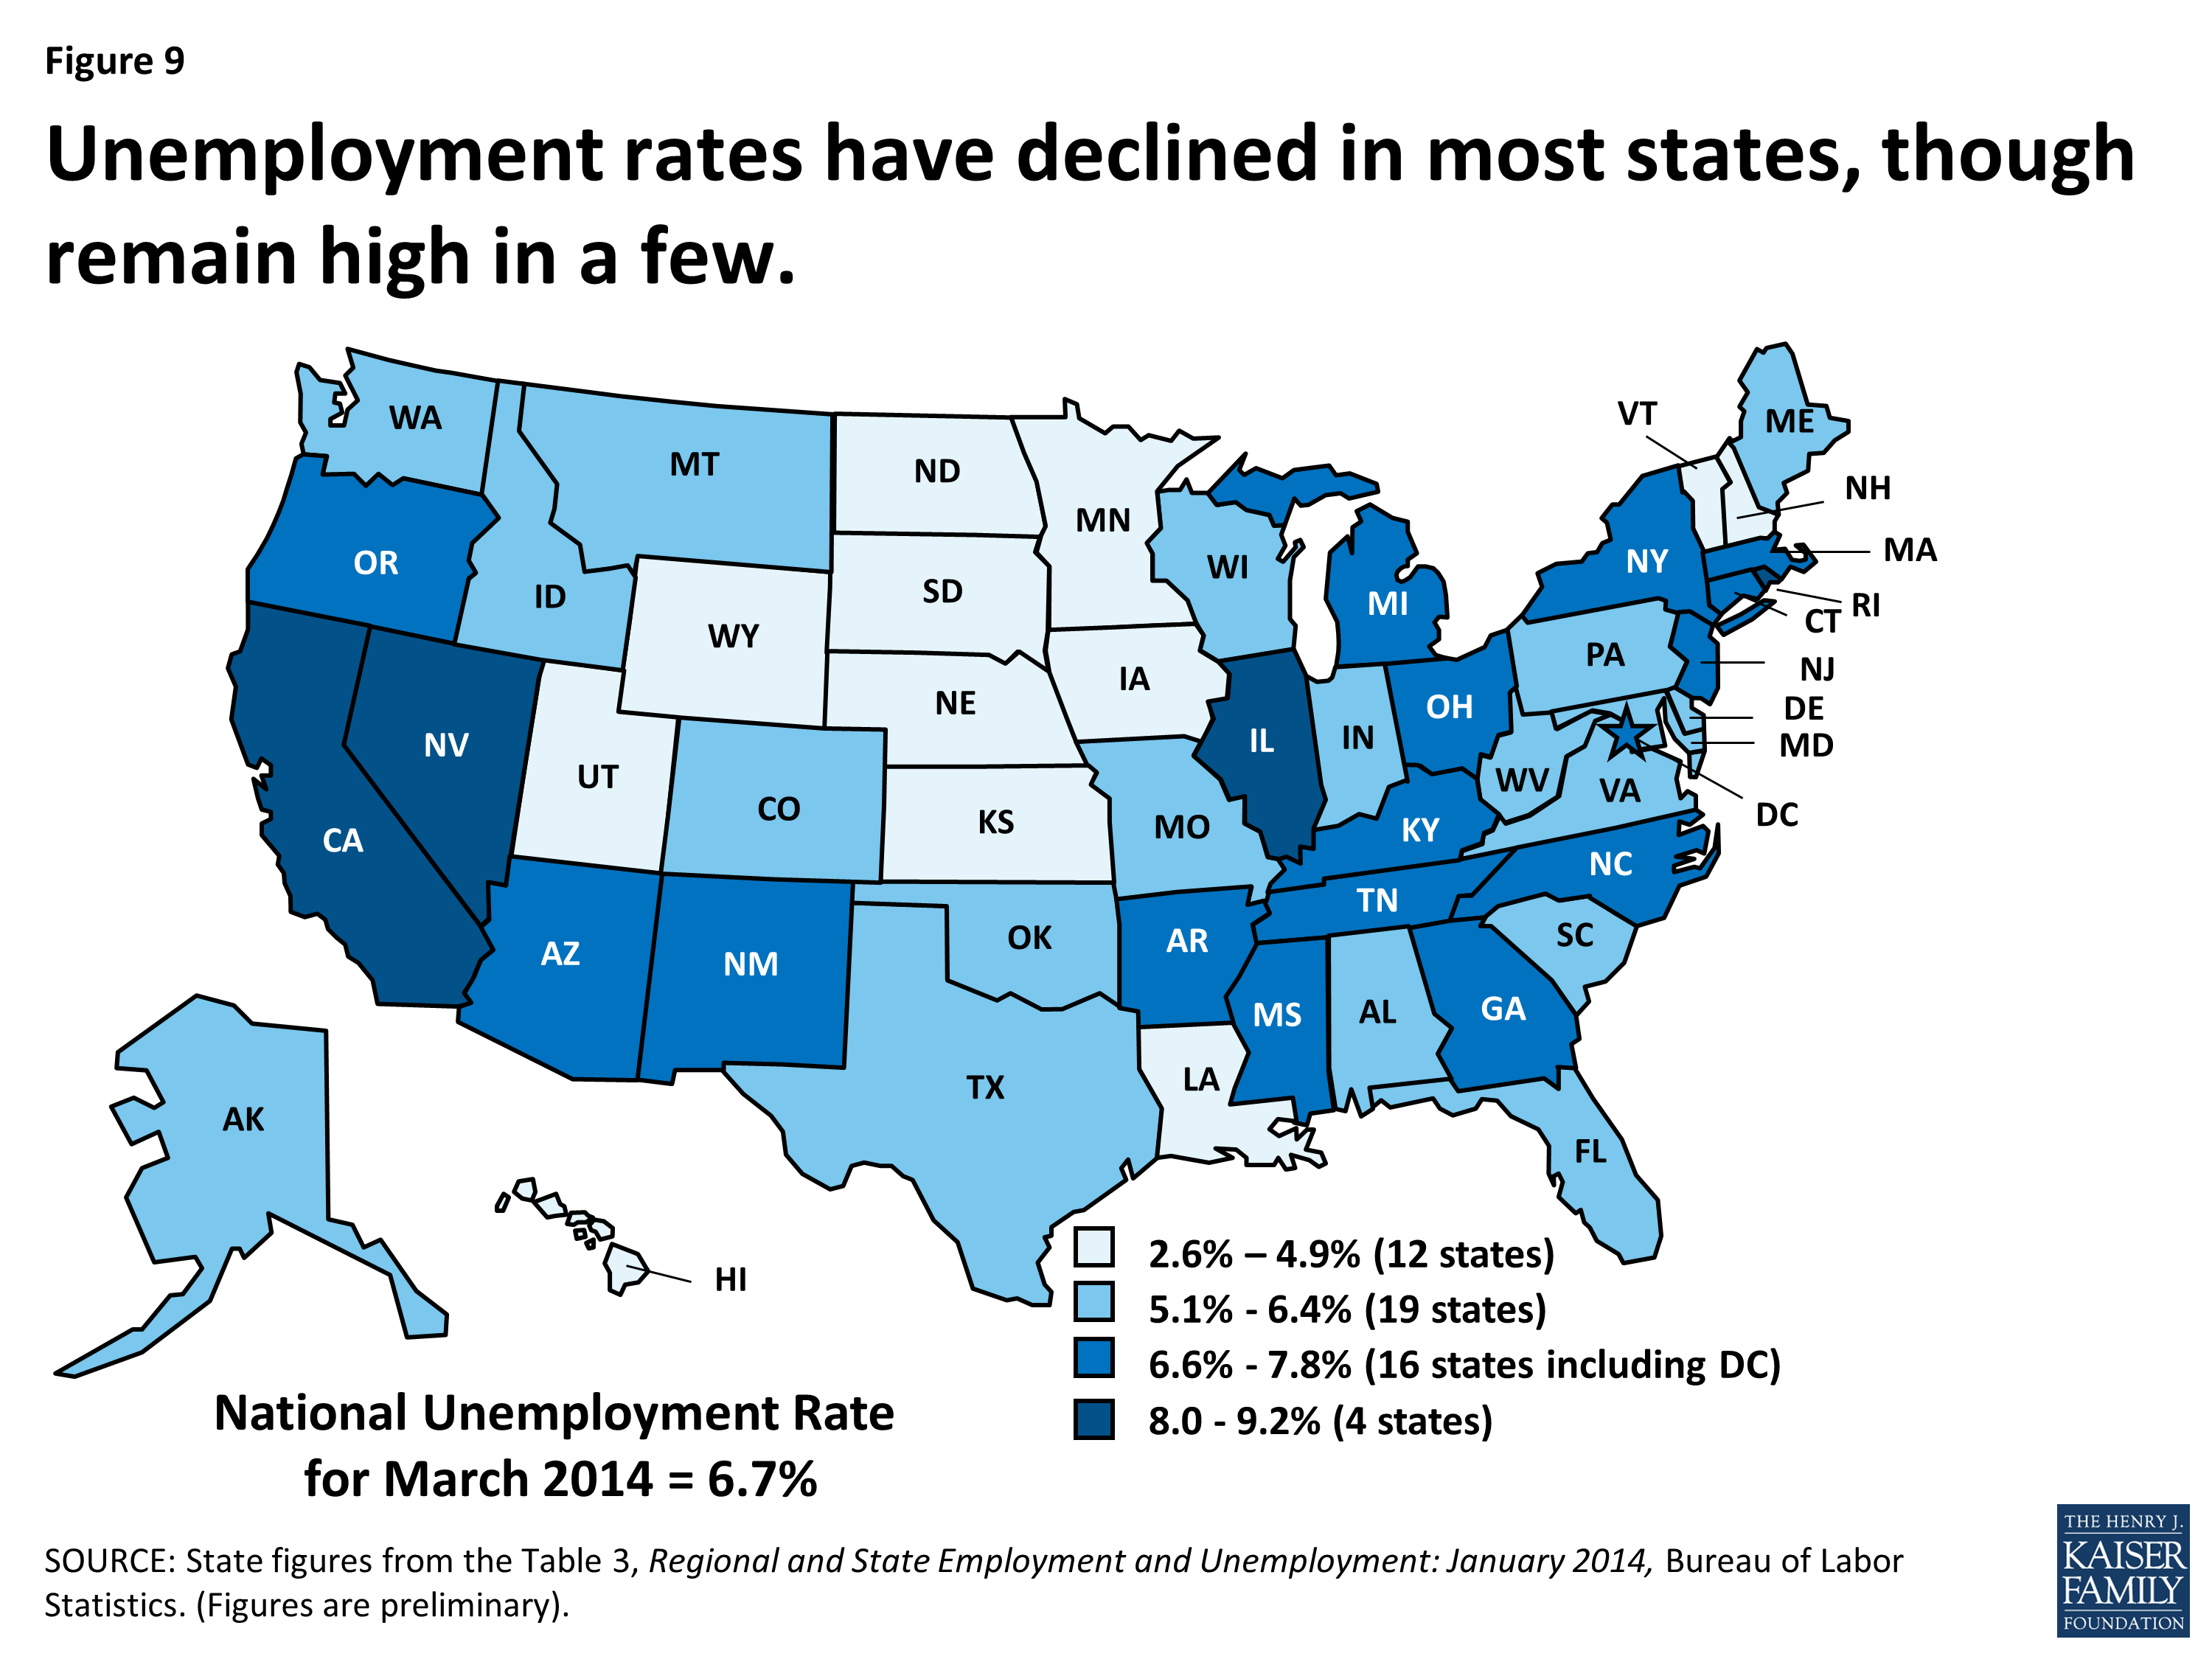
Figure 9
Recent Trends in Medicaid Spending, Enrollment and Policy Decisions
As economic conditions continue to improve, pressure on Medicaid enrollment and state budgets has lessened. According to data collected through the KCMU/HMA annual Medicaid budget survey, Medicaid enrollment growth slowed to 2.5 percent in FY 2013, the lowest rate of growth in six years. Total Medicaid spending increased on average by 3.8 percent across states, relatively modest compared to historical growth rates and on target with original legislative appropriations.7
States make policy decisions about Medicaid in the context of changes in the economy and the overall budget picture. During economic downturns, states face extraordinary budget pressures as demand for Medicaid increases but so do pressures to control costs, often by reducing provider payment rates, increasing or imposing new provider taxes, and restricting benefits. As economic conditions improve, states often make restorations of these reductions as was seen in FY 2013.8 More recently, states have been engaged in more fundamental transformations to Medicaid payment and delivery systems as a way to both control costs and improve care delivery particularly for high-cost populations. States continue to expand managed and are also implementing an array of care coordination initiatives including health homes, patient-centered medical homes, and Accountable Care Organizations as well as other quality related initiatives. 9
The ACA, Medicaid, and State Budgets
In addition to expanding options for affordable coverage through the creation of new Marketplaces, instituting reforms to private insurance, and providing additional funding for workforce and public health investment, the Affordable Care Act (ACA) builds on many of Medicaid’s current roles by expanding coverage with additional federal financing for the newly eligible population and by adding additional options for providing long-term care supports and for coordinating care of dual eligible beneficiaries. Many of the changes under the ACA will affect state budgets, but the one many state legislators are currently focused on is the Medicaid expansion.
As enacted in the ACA, Medicaid’s role was broadened to become the foundation of coverage for nearly all low-income Americans with incomes up to 138 percent of the federal poverty level (FPL) ($16,105 per year for an individual in 2014). However, the Supreme Court ruling on the ACA effectively made the decision to implement the Medicaid expansion an option for states. As of March 2014, 27 states (including the District of Columbia) were implementing the Medicaid expansion, 19 states were not implementing in 2014 and 5 states were engaged in open debate. (Figure 10) For states that expand Medicaid, the federal government will pay 100 percent of the costs of those newly eligible for Medicaid from 2014 to 2016 and then that contribution phases down to and remains at 90 percent by 2020 (well above traditional Medicaid matching rates).
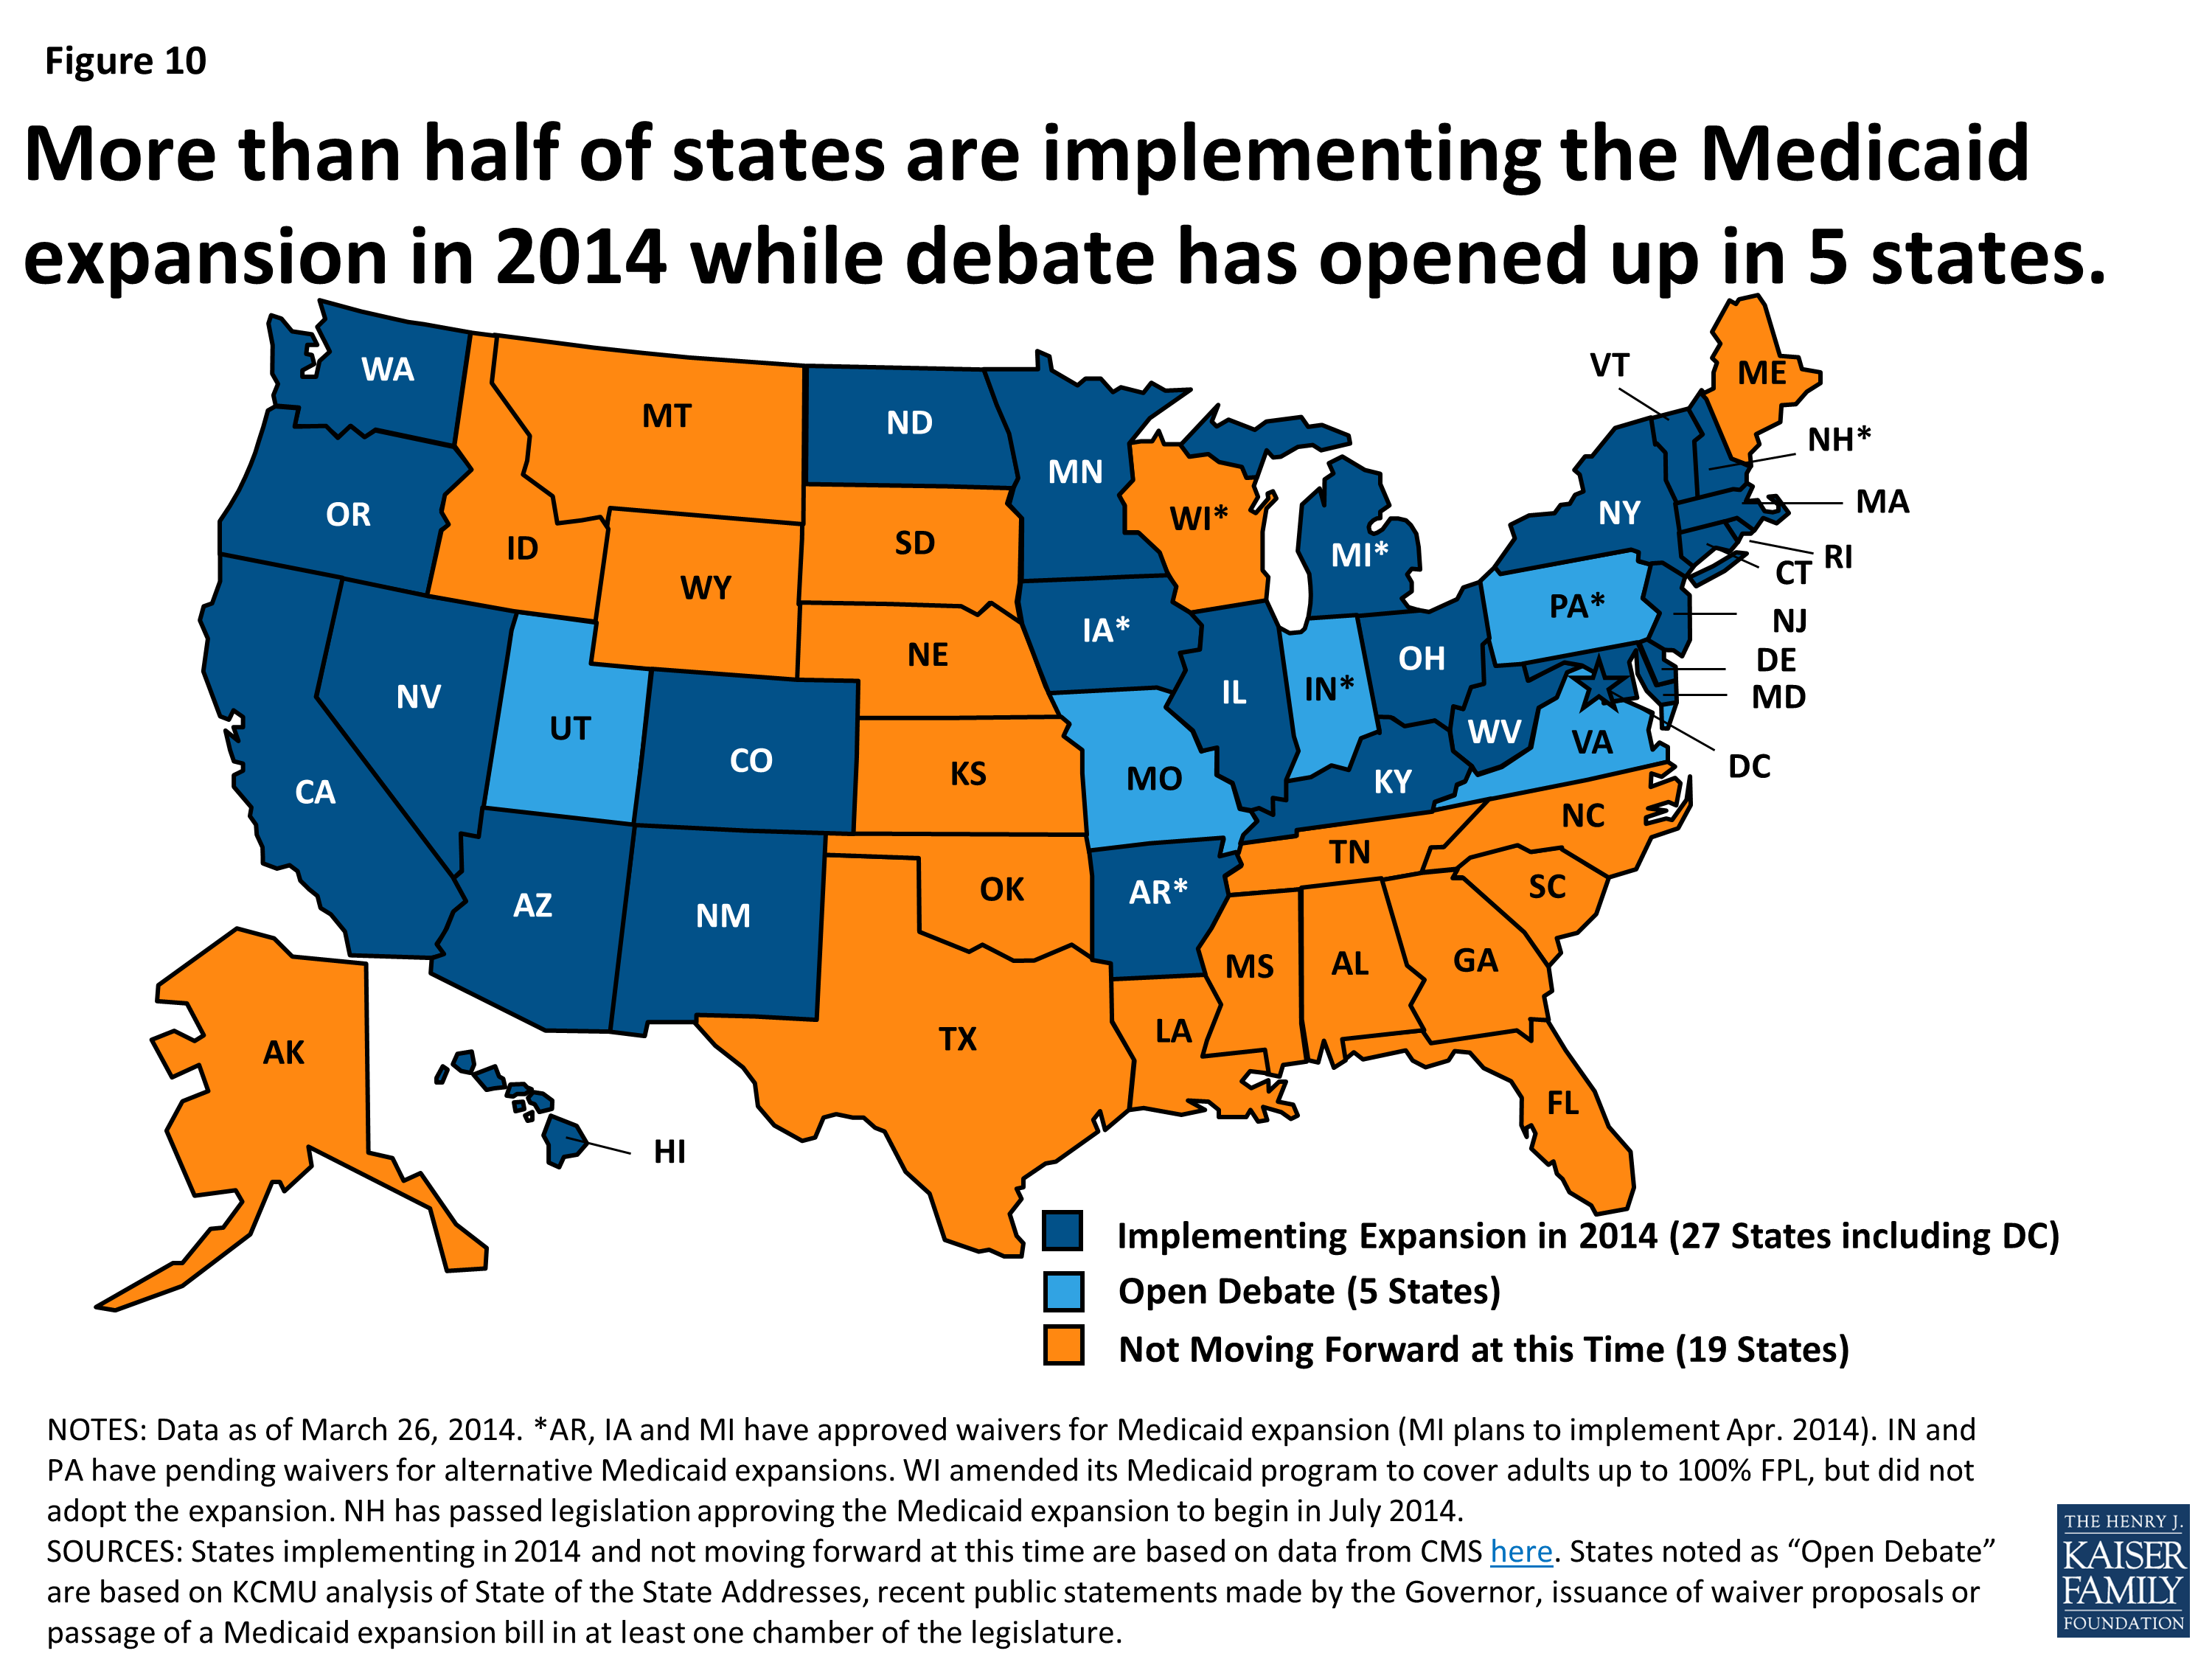
Figure 10
At the start of FY 2014, July 2013 for most states, enrollment for the fiscal year was projected to grow on average by 8.8 percent across all states. Total spending was expected to increase by 10.3 percent and state spending by 5.1 percent. All states were anticipating increases in participation among those currently eligible but not enrolled due to enrollment simplifications and outreach for new coverage in the ACA. (Figure 11) However, states moving forward with the expansion were anticipating higher enrollment growth and higher spending growth tied to large increases in federal funds.
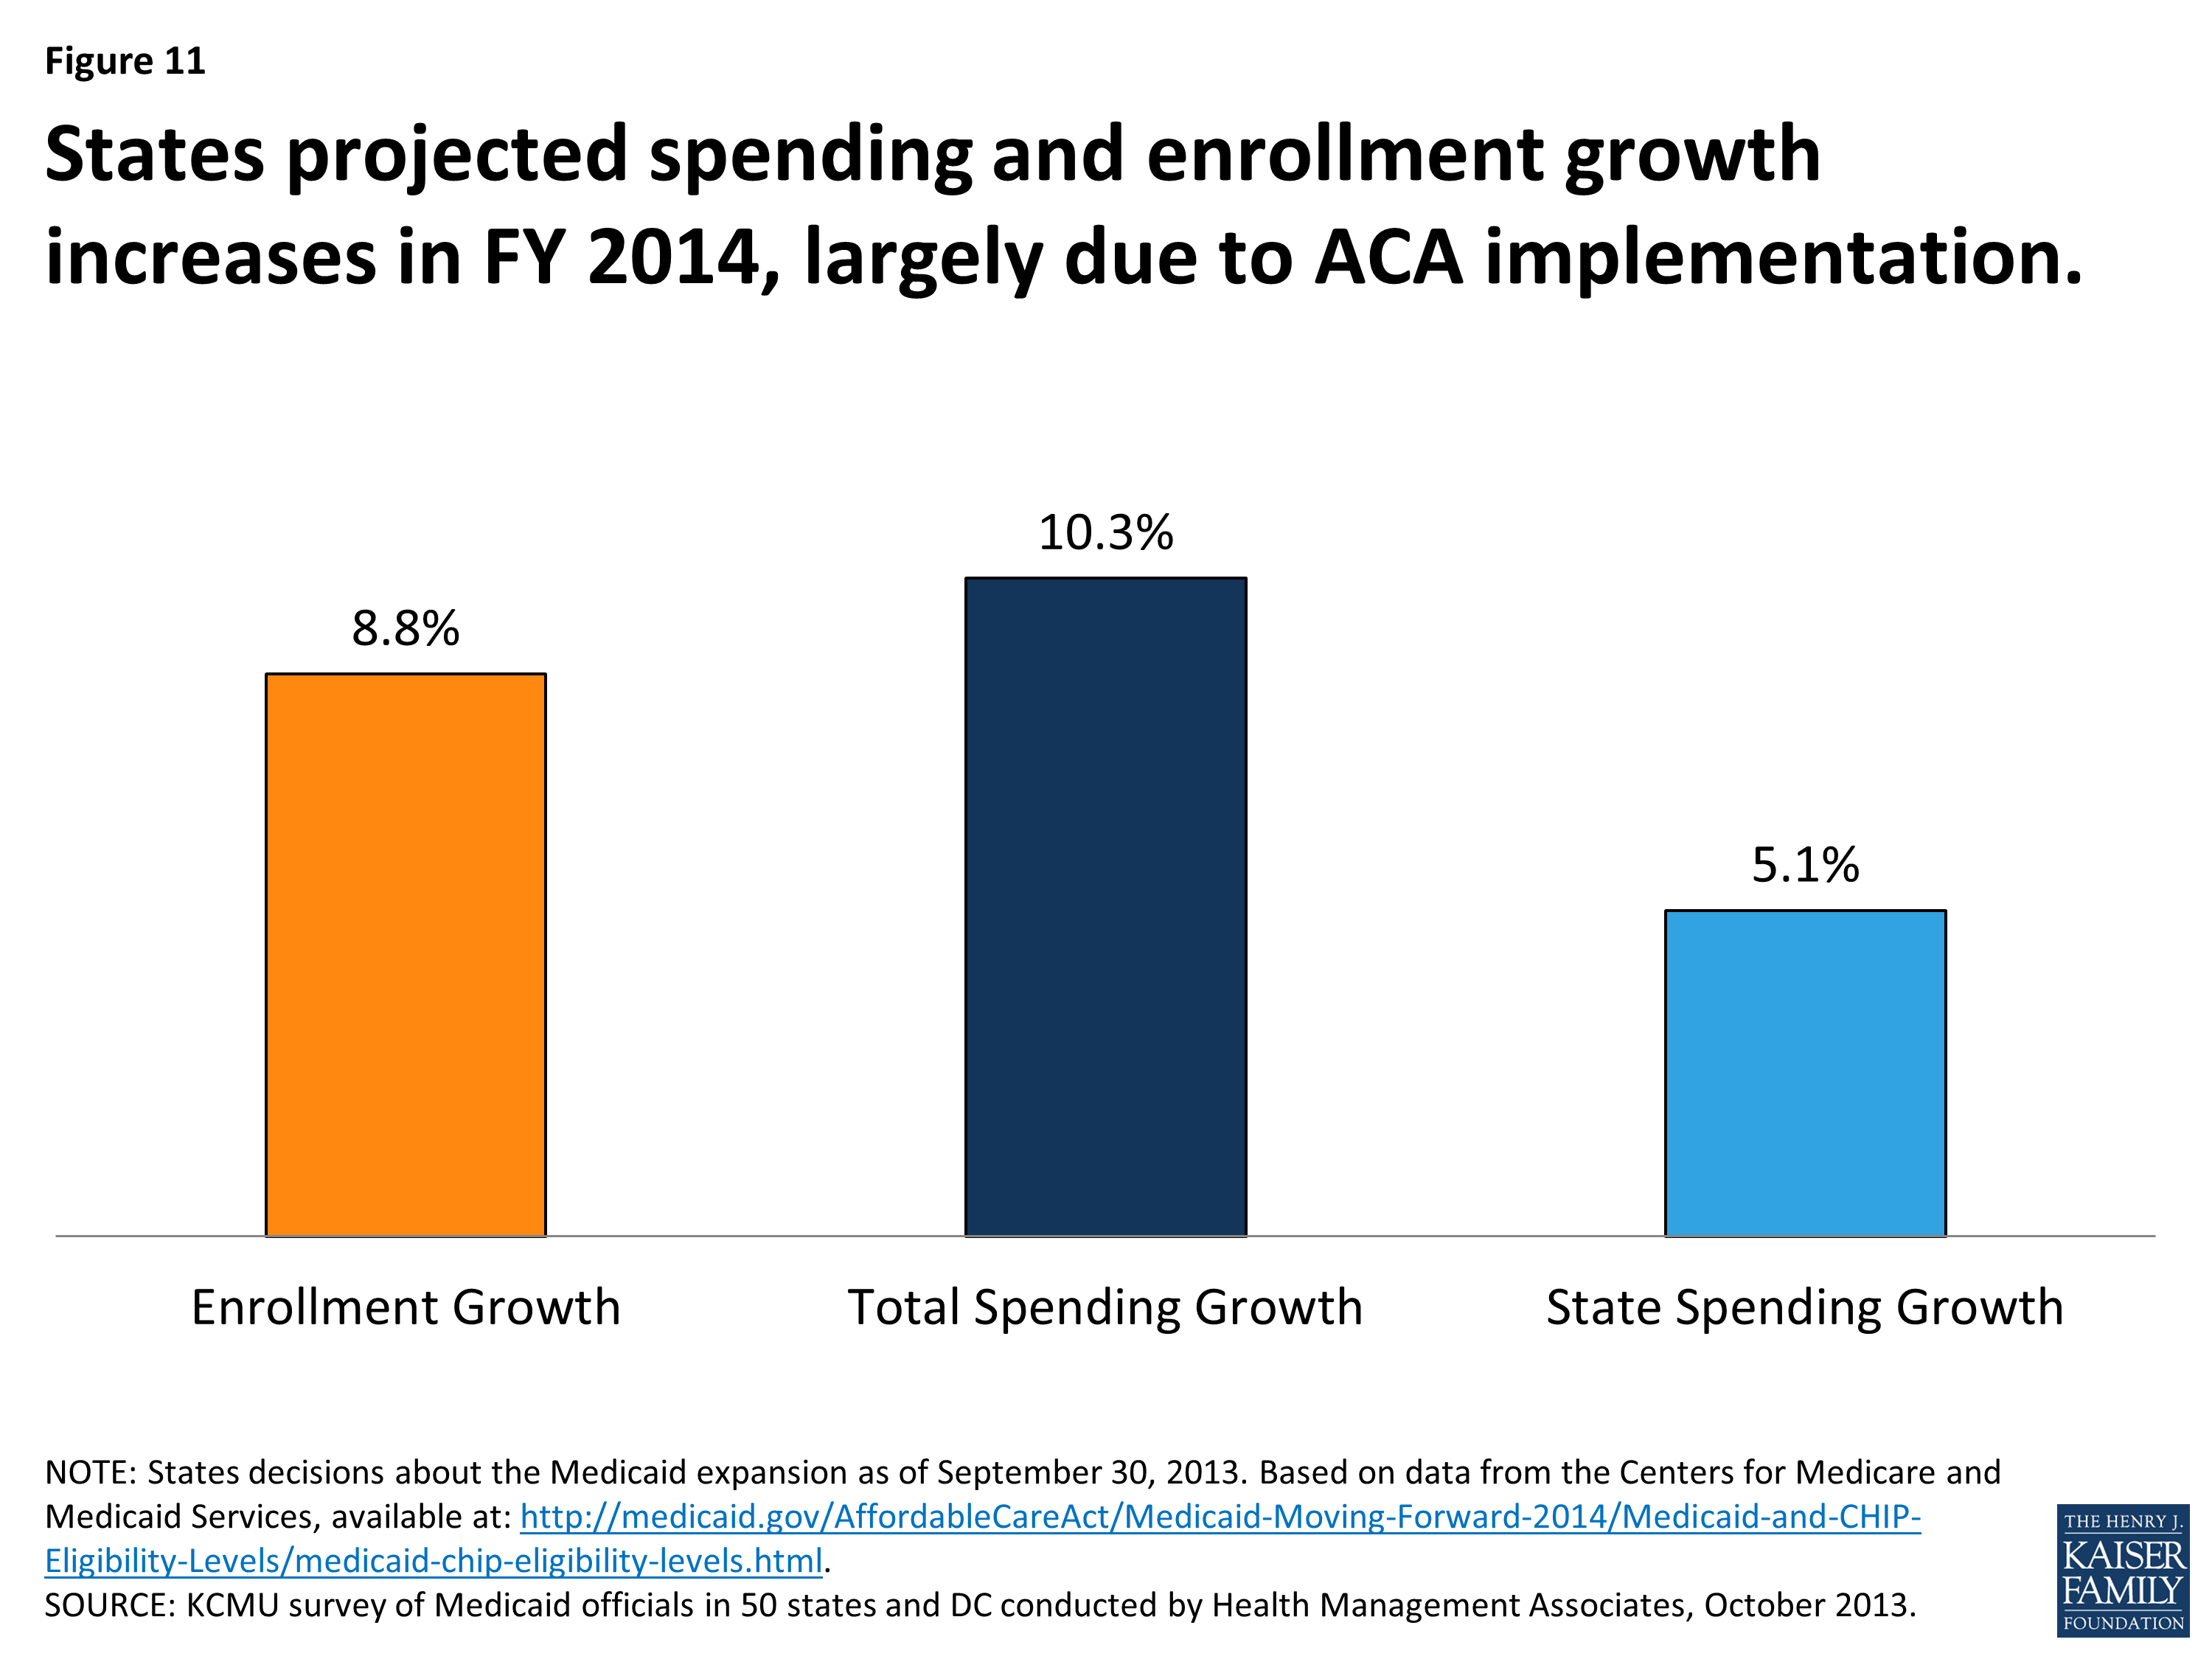
Figure 11
State decisions about implementing the Medicaid expansion have important coverage and fiscal consequences for states. Those that expand are expected to see increases in coverage and federal funds as well as reductions in the uninsured. While states will continue to face tradeoffs when deciding how to allocate funds across budget categories, the Medicaid expansion provides the opportunity for substantial federal revenues not otherwise available. A recent study found that the amount of federal funds estimated to come into states by 2022 if they decided to expand will be substantially higher (1.35 times higher on average) than the amount of federal funds estimated to flow into states through the federal highway program.10 The increased federal funds and reductions in the number of uninsured are also expected to result in potential state budget savings both within and outside of Medicaid, such as reductions in the need for uncompensated care costs and other indigent care (i.e. mental health and substance abuse programs) funded with state-only funds.11
Studies have historically shown that Medicaid spending and the influx of federal funds have a positive effect on state economies and jobs. Medicaid funds directly support tens of thousands of health care providers across the country, including hospitals, health centers, and nursing facilities. The funds indirectly support other businesses and affect jobs, household spending, and state and local tax collections. This effect is magnified by the large increases in federal funds tied to the Medicaid expansion. (Figure 12) A number of studies have been published examining the impact of the Medicaid expansion on state economies, budgets, changes in insurance coverage and broader economic effects. A recent review of 32 studies across 26 states found that the Medicaid expansion is projected to generate increased state economic activity, such as increases in state output, gross state product, and state and local revenues in those states expanding.12
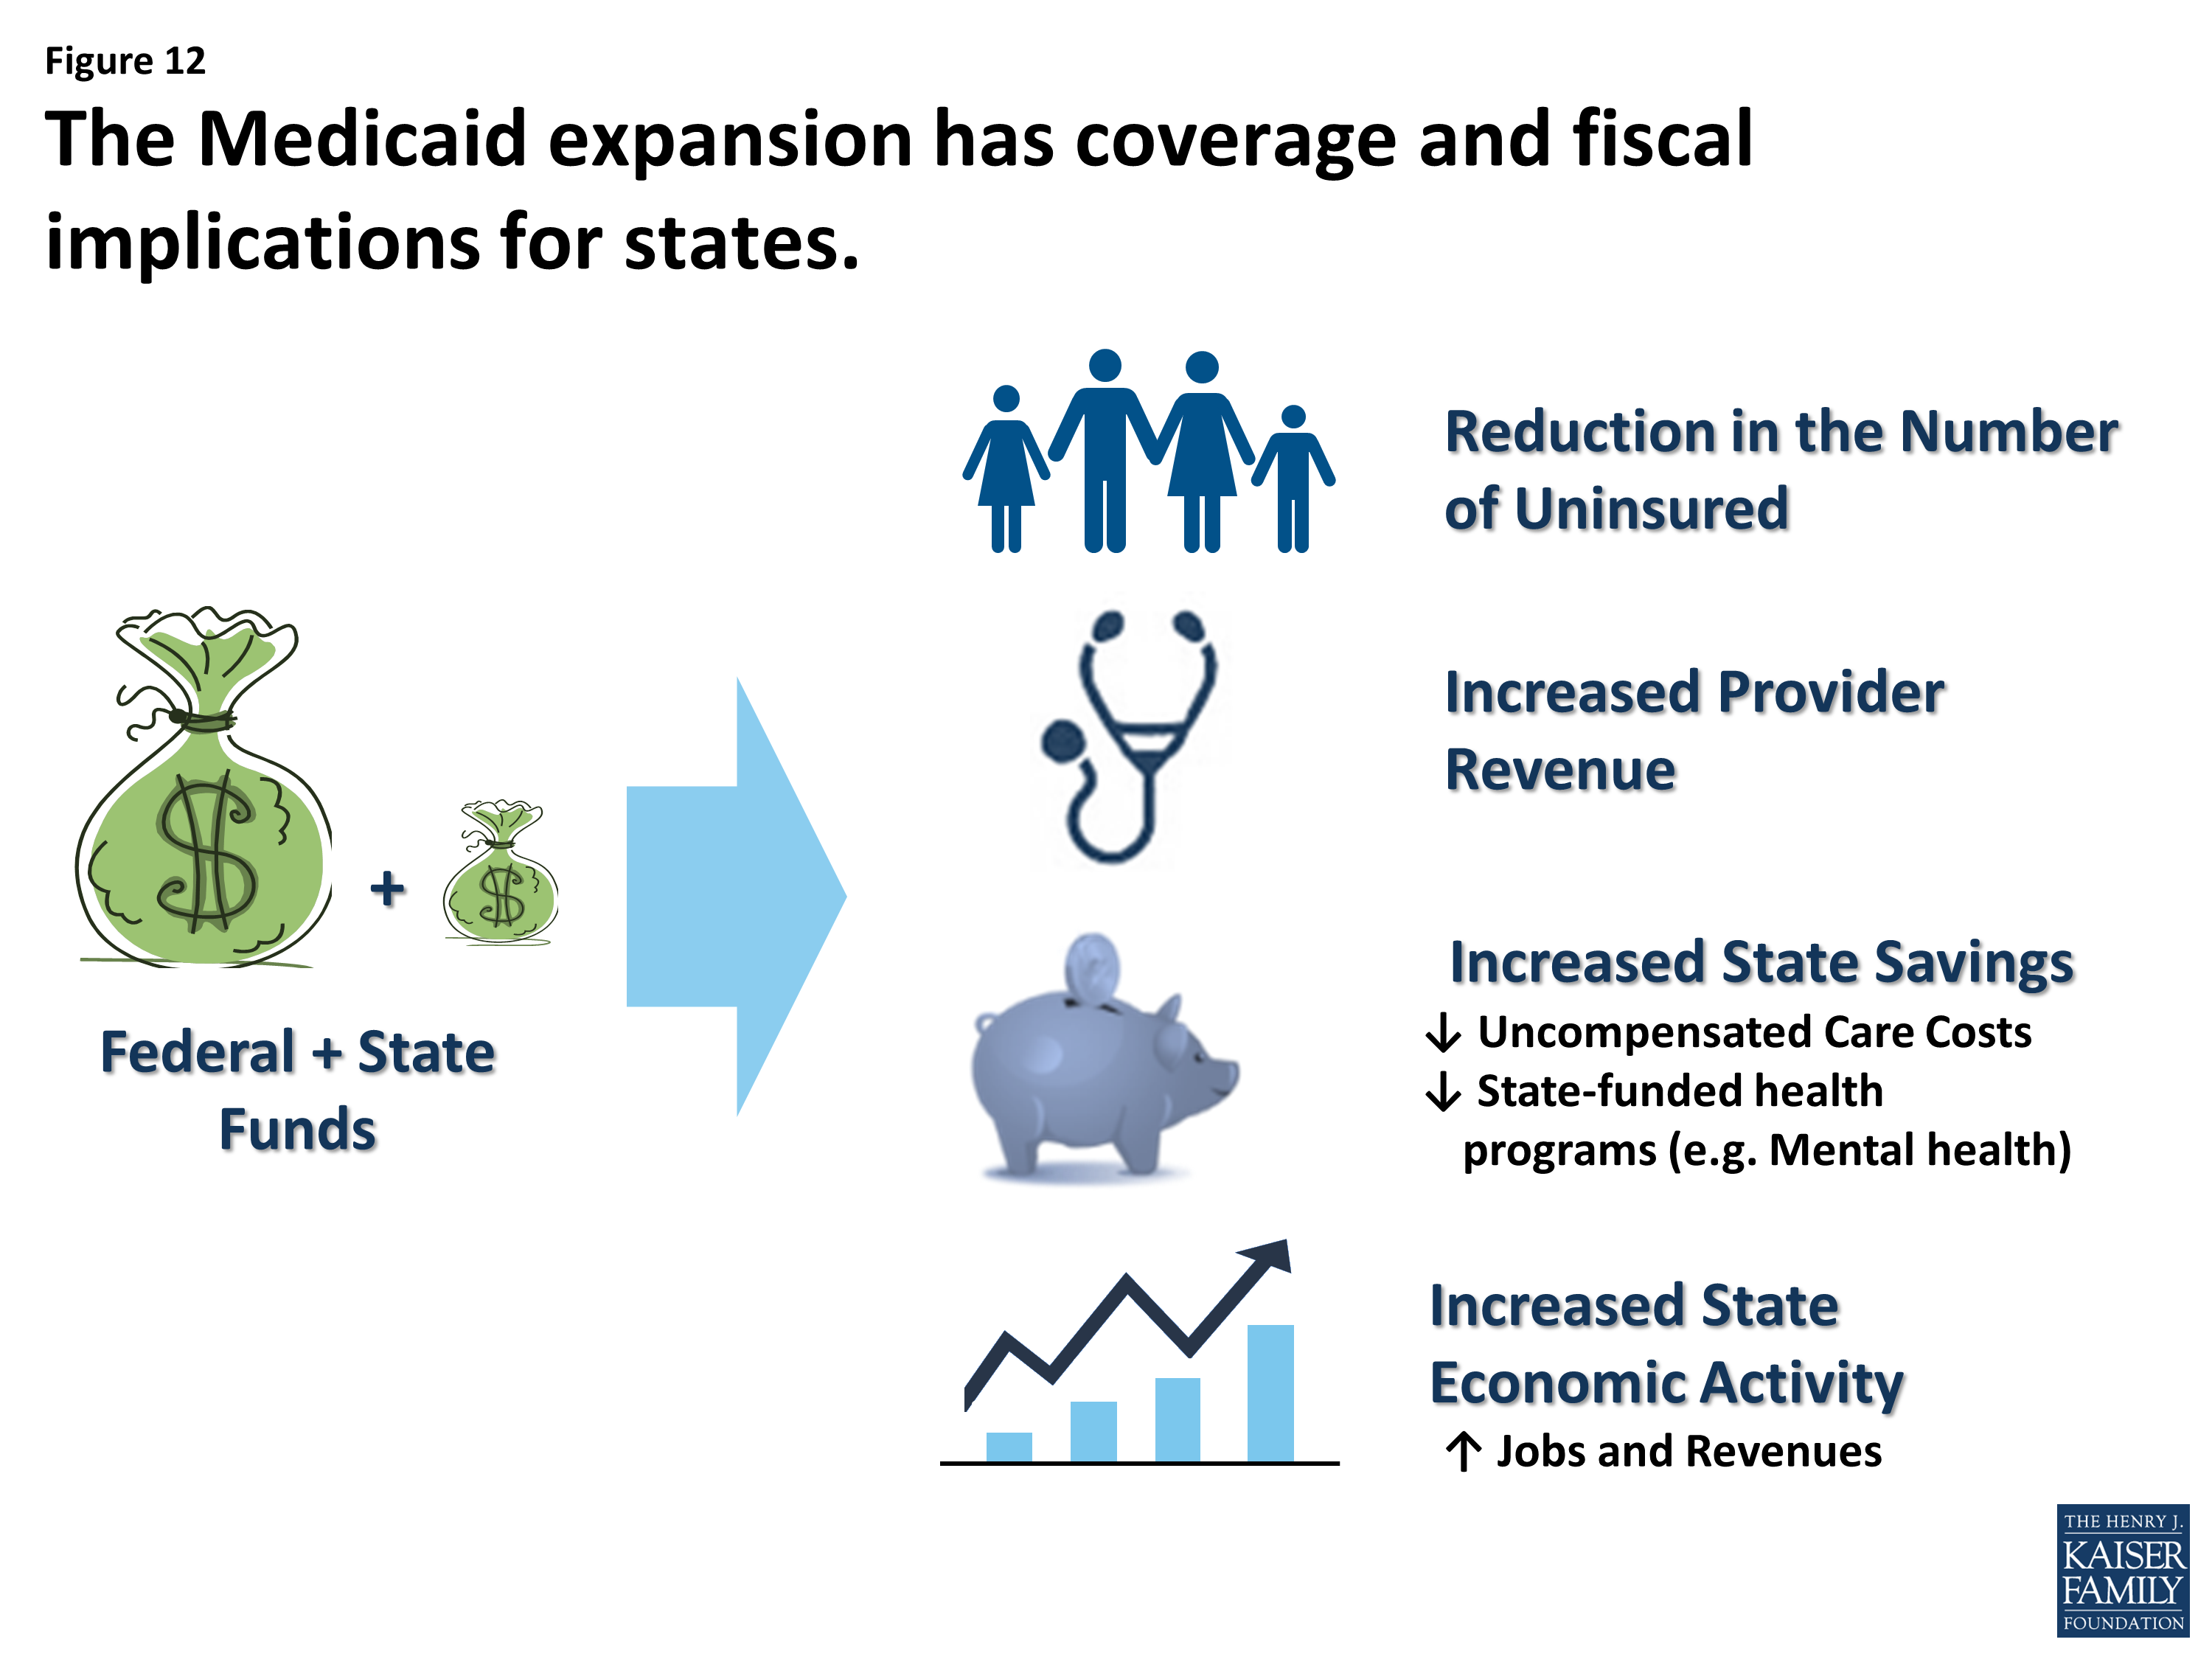
Figure 12
Alternatively, states that do not expand Medicaid will forgo large amounts of federal funds and adults in these states may face large gaps in coverage. However, these states can also expect an uptick in enrollment of those previously eligible for Medicaid but not enrolled at the regular match rate, not the enhanced match rate, which will bring continued Medicaid budget pressure without offsetting federal funds.
Looking Ahead
Fiscal conditions for states continue to improve, somewhat reducing the pressure on state budgets experienced during the recession. Looking ahead, the implementation of the ACA will have significant coverage and budgetary effects for state budgets. The underlying entitlement and financing structure is maintained and broadened to increase coverage of low-income uninsured state residents and the availability of substantial federal funds under the ACA. These changes will also expand the role of Medicaid in state budgets as both an expenditure as well as a significant source of revenue for states. State Medicaid programs are dynamic and evolving, but never more so than now. The scope and volume of change related to the implementation of the ACA, payment and delivery system reforms as well as controlling costs create enormous opportunities and challenges.
