Policy Options to Sustain Medicare for the Future
Section 2: Medicare Payments to Plans and Providers
.
Medicare Advantage
Options Reviewed
This section discusses four sets of options for reducing Federal spending on the Medicare Advantage program:
» Reduce Federal payments by lowering Medicare Advantage plan benchmarks
» Set payments to Medicare Advantage plans through competitive bidding
» Change the risk adjustment methodology
» Reduce or modify quality ratings and bonus payments
Since the 1970s, Medicare beneficiaries have had the option to receive their Medicare benefits through private health plans as an alternative to traditional Medicare. Policymakers have debated the appropriate role and level of payments for private plans in Medicare. The Affordable Care Act (ACA) made changes in the Medicare Advantage program, including reductions in payments and new quality-based bonus payments.
Perspectives on the Medicare Advantage program vary and policymakers arrive at a variety of answers to the following key questions, resulting in different policies for the program:
» Should plans be paid more for enrollees than the per capita costs of the traditional Medicare program, and if so, under what conditions?
» Should plans be rewarded for higher quality ratings (or penalized for lower ratings), and if so, how much, which plans, and under what rating system?
» Should plans be available to all beneficiaries in all parts of the country, and if so, what inducements, if any, should be offered to support plan participation in all areas?
Background
Since 2004, the number of Medicare beneficiaries enrolled in private plans has more than doubled from 5.3 million (13 percent of beneficiaries) to 13.1 million (27 percent of beneficiaries) in 2012, with large variations across counties (Exhibit 2.1). In some counties, such as Miami-Dade County in Florida and Multnomah County in Oregon, more than half of beneficiaries were enrolled in a Medicare Advantage plan in 2012. In contrast, in other counties, such as Cook County in Illinois and Baltimore County in Maryland, less than 12 percent of beneficiaries were enrolled in a Medicare Advantage plan in 2012.
Private plans in the Medicare Advantage program are paid a capitated amount per enrollee to provide all Medicare Part A and B benefits. In addition, Medicare makes a separate payment to plans for providing prescription drug benefits under Medicare Part D (see Section Two, Prescription Drugs for options related to Part D). Since 2006, Medicare has paid plans under a process that compares bids with benchmarks. Plans submit bids based on estimated costs per enrollee for services covered under Medicare Parts A and B. The bids then are compared to benchmark amounts that are set by a formula established in statute and vary by county (or region in the case of regional PPOs), based in part on traditional Medicare costs in the area. The benchmark is the maximum amount Medicare will pay a plan in a given area. If a plan’s bid is higher than the benchmark, enrollees who choose that plan must pay the difference between the benchmark and the bid in the form of a monthly premium (in addition to the Medicare Part B premium). If the bid is lower than the benchmark, the plan and Medicare split the difference between the bid and the benchmark; the plan’s share, known as a “rebate,” varies by the plan’s quality rating and must be used to provide supplemental benefits to enrollees. Medicare payments to plans are then risk adjusted based on enrollees’ risk profiles, including demographic and health status information.
Based on data showing Medicare Advantage plans were being paid, on average, more than the cost of traditional Medicare in their areas, the ACA reduced the benchmarks and tied them to the costs of traditional Medicare in the county, ranging from 95 percent (in high-cost counties) to 115 percent (in low-cost counties) of per capita traditional Medicare spending in the county (see (Exhibit 2.2) for the share of Medicare Advantage enrollees residing in higher-cost and lower-cost counties in 2012). As a result, any changes in the costs of traditional Medicare, such as reductions in payments to providers, directly affect payments to Medicare Advantage plans. The new benchmarks will be phased in between 2011 and 2017, with the length of the phase-in period varying by county; until the new (lower) benchmarks are fully phased in, the benchmarks are a blend between the old and new benchmark. Since January 2012, plans with higher quality ratings have been paid bonus payments, based on provisions in the ACA and a Centers for Medicare & Medicaid Services (CMS) demonstration, and are provided a larger rebate than plans with lower quality ratings.
Policy Options
Reduce Federal Payments by Lowering Medicare Advantage Plan Benchmarks
OPTION 2.1
Implement the Affordable Care Act benchmarks for the Medicare Advantage program over a shorter time period
The ACA reduced the benchmarks for all counties, with the transition to the new benchmarks phased in between two and six years (longer transition periods are provided in counties that would experience larger reductions in benchmarks). The majority of beneficiaries (80 percent) reside in counties where the transition will occur over six years. This option would fully implement the new benchmarks established in the ACA by phasing in new benchmarks from 2011 to 2015 rather than from 2011 to 2017, shortening the maximum phase-in period from six years to four years.
Budget effects
No cost estimate is available for this option. Implementing the new ACA benchmarks by 2015 rather than 2017 would reduce Medicare spending between 2014 and 2017 for the counties with the longest transition period.
Discussion
Proponents argue this option maintains the payment policies set forth in the ACA but implements the policy on an expedited schedule to achieve savings. Opponents argue that, in the counties with the largest changes in benchmarks, Medicare Advantage plans may not have sufficient time to adjust their care delivery models and business strategies, and thus may be more likely to raise their premiums, limit the benefits they offer, or withdraw from those counties or from the program entirely, requiring beneficiaries to pay more, change plans, or switch to traditional Medicare. The slower transition period may have been implemented to mitigate concerns about the dislocation of beneficiaries resulting from plans withdrawing from the Medicare Advantage program.
OPTION 2.2
Set benchmarks for the Medicare Advantage program equal to local costs of traditional Medicare
The ACA reduced the benchmarks for all counties and tied the benchmarks to the local per capita costs of traditional Medicare, but the benchmarks for some counties will be lower than the local per capita spending for traditional Medicare, while benchmarks for other counties will be higher than the local per capita spending for traditional Medicare. The approach was adopted partly based on research that showed that Medicare Advantage plan costs vary much less geographically than do costs within traditional Medicare (Berenson 2008). However, on a national basis, on average, the new benchmarks are projected to be about equal to local per capita spending for traditional Medicare (MedPAC 2010). Specifically, for the counties in the top quartile of traditional Medicare costs, benchmarks will be 95 percent of traditional Medicare costs, and for the counties in the bottom quartile of traditional Medicare costs, benchmarks will be 115 percent of traditional Medicare costs (MedPAC 2011).
This option would set the benchmark for each county equal to the projected local per capita spending for traditional Medicare. It would increase the benchmarks for the counties in the top quartile of traditional Medicare costs, make no change to the benchmarks for the counties in the second highest quartile of traditional Medicare costs, and reduce the benchmarks for the counties in the third highest and bottom quartiles of traditional Medicare costs. In other words, the reduction in payments to counties with the lowest traditional Medicare costs would be offset by higher payments to counties with the highest traditional Medicare costs.
Budget effects
No current cost estimate is available for this option. Setting the benchmarks equal to local per capita costs of traditional Medicare would produce small savings, if any, once the new ACA benchmarks are fully implemented. In 2008, CBO estimated that setting the benchmarks equal to local per capita costs of traditional Medicare would reduce Federal spending by $157 billion over 10 years (2010–2019), if implemented in 2011; however, this estimate was produced prior to the enactment of the ACA (CBO 2008). Since the new ACA benchmarks are projected to be equal to the costs of traditional Medicare, on average, the actual Federal savings from this option would be small, if any Federal savings were produced.
Discussion
An argument in favor of this option is that Medicare would pay no more for enrollees in Medicare Advantage plans than it would have paid if they had remained in traditional Medicare, regardless of where the enrollee lives. This argument appeals to those who believe the Medicare program should be neutral as to whether beneficiaries decide to enroll in Medicare Advantage plans or traditional Medicare. An argument against this option is that in the counties with lower traditional Medicare costs (which tend to be more rural areas), the reduction in benchmarks could lead Medicare Advantage plans to raise their premiums, limit the benefits they offer, or withdraw from certain regions or from the program entirely, requiring beneficiaries to pay more, change plans, or switch to traditional Medicare.
OPTION 2.3
Set benchmarks equal to local costs of traditional Medicare in counties in which benchmarks for Medicare Advantage plans are higher than local costs of traditional Medicare
The ACA reduced the benchmarks for all counties and tied the benchmarks to the local per capita costs of traditional Medicare, but the benchmarks for some counties will be lower than the local per capita spending for traditional Medicare, while benchmarks for other counties will be higher than the local per capita spending for traditional Medicare.
This option would set the benchmark equal to the projected local per capita spending for traditional Medicare in counties with benchmarks higher than the local costs of traditional Medicare (Feder et al. 2012). This option would reduce the benchmarks for the counties in the third highest and bottom quartiles of traditional Medicare costs and make no change to the benchmarks for the counties in the top quartile and second highest quartile of traditional Medicare costs. This option is identical to Option 2.2 for counties in which the benchmark is higher than traditional Medicare costs, but differs from Option 2.2 in that it would retain the current law benchmark for counties in the top quartile, with benchmarks equal to 95 percent of traditional Medicare costs.
Budget effects
No cost estimate is available for this option. If the benchmarks had been set equal to local per capita costs of traditional Medicare for the counties with benchmarks higher than traditional Medicare costs in 2012, Medicare spending would have been between $2 billion and $4 billion lower in 2012.
Discussion
An argument in favor of this option is that Medicare would pay no more for enrollees in Medicare Advantage plans, and would continue to pay less in one-quarter of counties, than it would have paid if they had remained in traditional Medicare, regardless of where the enrollee lived. This argument appeals to those who believe that private Medicare Advantage plans should be at least as efficient as the traditional Medicare program. Some also argue that this option would promote efficiency in the Medicare Advantage market while reducing Medicare spending. Additionally, some argue that paying plans less than traditional Medicare in some counties could help to counter the findings of some research indicating that plans are selectively enrolling healthier enrollees (MedPAC 2012). However, similar to the effects of Option 2.2 above, an argument against this option is that in the counties in which benchmarks are higher than traditional Medicare costs (which tend to be more rural areas), the reduction in benchmarks could lead plans to raise premiums, cut benefits, or withdraw from certain regions or entirely from the program, requiring beneficiaries to pay more, change plans, or switch to traditional Medicare. This option might preserve choice between Medicare Advantage and traditional Medicare only for beneficiaries residing in counties with average or higher traditional Medicare costs.
Set Payments to Medicare Advantage Plans Through Competitive Bidding
OPTION 2.4
Establish benchmarks for the Medicare Advantage program through competitive bidding
Under current law, payments to Medicare Advantage plans are based on benchmarks defined under current law, as noted above. This option would use a new approach to determine the benchmarks that would be based solely on the average plan bid in each county, with each plan’s bid weighted by its enrollment in the previous year. The benchmarks established by a competitive bidding process would be subject to a ceiling (no greater than the benchmarks under current law) to ensure that benchmarks and Medicare spending are not inflated by this methodology. Beneficiaries enrolled in a Medicare Advantage plan with a bid higher than the benchmark would pay an additional premium. Beneficiaries enrolled in a plan with a bid lower than the benchmark would receive supplemental benefits equal to the value of the difference between the plan bid and the benchmark. Traditional Medicare would not be a bidding plan under this option.
Under current law, beneficiaries enrolled in a plan with a bid lower than the benchmark receive supplemental benefits equal to 75 percent of the difference between the plan bid and the benchmark, and most plans provide some supplemental benefits. Under this option, only the plans with bids lower than the average bid in the county could provide supplemental benefits, but beneficiaries enrolled in those plans would receive supplemental benefits equal to 100 percent of the difference between the plan bid and the benchmark, providing beneficiaries with stronger incentives to enroll in the plans with the lowest bids.
Budget effects
No current cost estimate is available for this option. In 2008, CBO estimated that establishing benchmarks through competitive bidding would reduce Federal spending by $158 billion over 10 years (2010–2019), if the program began in 2012 and assuming benchmarks would be subject to a ceiling no greater than the benchmarks under current law (CBO 2008). However, this estimate was produced prior to the enactment of the ACA, which reduced the benchmarks in the Medicare Advantage program; thus, the actual savings from competitive bidding, if fully implemented in 2012, would be smaller.
Discussion
Proponents of this option believe it could lower benchmarks and increase price competition among plans, encouraging plans to obtain larger discounts from providers, provide supplemental benefits valued by beneficiaries, and manage care more efficiently. An argument against this option is that it would reinforce an uneven playing field between private plans and traditional Medicare, but in this case favoring traditional Medicare, especially in high-cost areas, by not requiring it to compete with private plans and improve its efficiency. For example, plans with bids above the benchmark would be required to charge beneficiaries an additional premium, even if the bid was lower than the average per capita costs of traditional Medicare in the county, providing beneficiaries a financial incentive to enroll in either traditional Medicare or a lower cost private plan. Over time, this option could lead some higher-cost plans to withdraw from the Medicare Advantage program, thereby reducing the number of private plans available to beneficiaries.
Demonstrations of competitive bidding among Medicare private plans have not been fully implemented in the past due to objections to traditional Medicare not being included as a plan bid and general opposition among stakeholders. Future attempts to implement competitive bidding in Medicare Advantage could encounter these issues as well, or different concerns may arise in a different environment. A similar option that included traditional Medicare as a plan bid would closely resemble an option for a premium support system (see Section Four, Premium Support).
Change the Risk Adjustment Methodology
Currently, Medicare prospectively adjusts payments to Medicare Advantage plans to reflect the expected costs and health risks of each enrollee. This risk adjustment is intended to compensate plans for enrolling sicker and more costly enrollees, and avoid overpaying plans that enroll healthier than average enrollees. Results from some studies have indicated that plans might be selecting against sicker beneficiaries, particularly within categories of diagnoses, suggesting that the current risk adjustment system may not be adequate (Brown et al. 2011; MedPAC 2012). Studies have also suggested that the differences in payments between Medicare Advantage plans and traditional Medicare may have actually increased after risk adjustment and led to an eight percent increase in total Medicare spending (Brown et al. 2011). While these findings suggest the need for a fundamental review of the current risk adjustment methodology or consideration of a payment approach that reduces the impact of favorable selection, such as partial capitation, by which some of the payment would be based on Medicare Advantage plans’ actual costs, there is still room to improve the current risk adjuster. The option below would make modifications to the existing risk adjustment system.
OPTION 2.5
Improve the risk adjustment system for Medicare Advantage plans
Under the current risk adjustment system for Medicare Advantage, each plan enrollee is assigned a risk score (with average risk equal to 1.0) based on relative health risk, which includes demographics and diagnoses based on the prior year of medical claims, as well as disabilities, institutional status and Medicaid status. The current model for adjusting Federal payments to plans for the health risk of their enrollees explains about 11 percent of the variation in Medicare spending (Pope et al. 2004). Research indicates that providers often do not consistently code conditions on claims from year to year. For example, a primary care provider may indicate on medical claims that a patient has diabetes when initially diagnosed, but might not indicate it on the following year’s claims if the patient’s diabetes is well-controlled and did not require medical attention. This inconsistency in coding of conditions results in greater fluctuations in risk scores and less stable payments to plans (MedPAC 2012). Several researchers, including MedPAC, have concluded that using two years of medical claims data would make the risk scores more stable and would improve the predictive accuracy of the risk adjustment model, particularly for beneficiaries with mental illness and beneficiaries with five or more chronic conditions (Frogner et al. 2011; MedPAC 2012).
This option would require CMS to use two years of historical medical claims data, rather than one year, and to include the number of medical conditions, to adjust the payments to Medicare Advantage plans for the demographics and health history of each plan enrollee. Because two years of diagnosis data would not be available for beneficiaries in their first or second year of Medicare eligibility, the current risk adjustment methodology could be used for these beneficiaries.
Budget effects
No cost estimate is available for this option. Using two years of medical claims data (when available) rather than one year and including the number of medical conditions in the risk adjustment model would increase payments for some Medicare Advantage plan enrollees and decrease payments for other enrollees. The option could reduce Medicare spending if it results in a net reduction in payments to Medicare Advantage plans.
Discussion
An argument in favor of this option is that using two years would help to more accurately identify beneficiaries’ conditions and provide a more stable revenue stream for Medicare Advantage plans by reducing year-to-year fluctuations in beneficiaries’ risk scores. An argument against this option is that it would increase the administrative burden of the Medicare Advantage program for both plans and CMS, while significantly improving the risk scores for only the sickest beneficiaries
Reduce or Modify Quality Ratings and Bonus Payments
OPTION 2.6
Terminate the Quality Bonus Demonstration in 2013
The ACA authorized plans with 4 or more stars to receive bonuses of 5 percent added to their benchmark in 2014 and subsequent years, with smaller bonuses for plans receiving 4 stars or 4.5 stars, and 5 percent for plans receiving 5 stars in 2012 and 2013. All Medicare Advantage plans are rated on a 1 to 5 star scale, with 1 star representing poor performance, 3 stars representing average performance, and 5 stars representing excellent performance. The quality scores are based on 53 performance measures, such as whether the plans’ enrollees received the appropriate screening tests, the number of complaints CMS received about the plan, and how enrollees rated the communication skills of the plans’ physicians.
The ACA provided bonuses to about 42 percent of plans in 2012 (Jacobson et al. 2011). In 2012, CMS implemented a demonstration, to take the place of the ACA authorized bonuses, under which plans with 4 or more stars receive bonuses of 5 percent, and plans with 3 and 3.5 stars also receive bonuses of 3 percent and 3.5 percent, respectively, for plan years 2012 through 2014. The demonstration extended the bonus payments to include about 91 percent of plans in 2012. The GAO has recommended terminating the demonstration, and MedPAC has raised concerns about its design and cost (Hackbarth 2011; GAO 2012b). This option would terminate the Quality Bonus Demonstration in 2013 rather than in 2014, which would result in the bonuses to Medicare Advantage plans reverting to the bonuses authorized by the ACA.
Budget effects
No cost estimate is available for this option. Medicare savings in 2014 would be less than $3 billion because aggregate bonuses for Medicare Advantage plans that year are expected to be lower than in 2012 ($3 billion). The CMS Office of the Actuary estimated that the total cost of the demonstration will be approximately $8 billion over the three years of the demonstration.
Discussion
Although terminating the demonstration one year early would produce only modest savings, some argue that the demonstration should be terminated because they question the appropriateness of providing bonuses to plans with average ratings (3 or 3.5 stars), and the costs associated with the demonstration. Proponents of the demonstration argue that it encourages and creates more incentives for plans at various quality ratings to maintain or improve their quality ratings.
OPTION 2.7
Restructure quality bonuses to Medicare Advantage plans to be budget neutral
Prior to 2011, plans were “graded on a curve” and scored on a relative scale for each quality measure, resulting in ratings that were relatively normally distributed. Under current law, the bonuses that Medicare Advantage plans receive based on their quality ratings are added to the county benchmark, which increases payments to plans. This option would restructure the quality bonuses to Medicare Advantage plans to be budget neutral, rather than an additional payment to plans, and would adjust the ratings so that the plans were graded on a curve; plans in the top half of the ratings would receive an increase in their benchmarks while plans in the bottom half of the ratings would receive a reduction in their benchmarks, and bonuses would be applied to plans on a sliding scale based on their quality rating.
Budget effects
No cost estimate is available for this option. Restructuring the bonus payments to be budget neutral would result in moderate savings by continuing to provide bonuses to half of the plans and reducing payments to the other half of plans. In 2012, Medicare Advantage plans received approximately $4 billion in bonus payments, all of which will be savings if this option is implemented prior to 2015; however, bonus payments will be smaller in 2015 and future years if the CMS demonstration program ends as scheduled at the end of 2014.
Discussion
Proponents argue that this option would reduce Medicare spending while continuing to encourage plans to maintain or improve their ratings. Critics say plans would be rated relative to one another, discouraging collective quality improvements and sharing of quality improvement information among plans. Plans that receive reductions in payments due to relatively low quality ratings may find it difficult to invest financial resources into improving their ratings, which could lead to stagnation in the plan ratings or other fiscal challenges.
OPTION 2.8
Prohibit Medicare Advantage plans from receiving double bonuses in specified counties
The ACA required bonuses to be doubled for plans that are offered in counties with all the following characteristics: (1) lower than average traditional Medicare costs, (2) a Medicare Advantage penetration rate of 25 percent or more as of December 2009, and (3) a designated urban floor benchmark in 2004. In 2012, Medicare Advantage plans in 210 counties qualify for double bonus payments, and the double bonuses accounted for approximately 21 percent of all bonus payments. The rules for the “double bonus counties” were maintained under the Quality Bonus Demonstration. For example, a 5-star plan in a double bonus county has 10 percent added to its benchmark, whereas a 5-star plan in a neighboring county that does not qualify for double bonuses has 5 percent added to its benchmark in 2014.
This option would eliminate the ACA provision that doubles bonuses for plans in specified counties. This would result in all plans with the same quality rating receiving the same bonus percent added to their benchmark.
Budget effects
No cost estimate is available for this option.
Discussion
In addition to the savings, an argument for this option is that no objective reason for awarding double bonuses to plans in these counties has been made. Another argument for this option is that it would eliminate inequities across neighboring counties. An argument against this option is that the “double bonus” to the highly rated plans in those counties would help offset the reductions in Medicare Advantage benchmarks resulting from the ACA.
References
Click to expand/collapse
Robert A. Berenson. 2008. “From Politics to Policy: A New Payment Approach in Medicare Advantage,” Health Affairs, March 2008.
Jason Brown, Mark Dugan, Ilyana Kuziemko, and William Woolston. 2011. How Does Risk Selection Respond to Risk Adjustment? Evidence from the Medicare Advantage Program, National Bureau of Economic Research, April 2011.
Congressional Budget Office (CBO). 2008. Budget Options, Volume 1: Health Care, December 2008.
Judy Feder, Stephen Zuckerman, Nicole Cafarella Lallemand, and Brian Biles. 2012. Why Premium Support? Restructure Medicare Advantage, Not Medicare, Urban Institute, September 2012.
Bianca Frogner, Gerard F. Anderson, and Robb A. Cohen. 2011. “Incorporating New Research into Medicare Risk Adjustment,” Medical Care, March 2011.
Government Accountability Office (GAO). 2012a. CMS Should Improve the Accuracy of Risk Score Adjustments for Diagnostic Coding Practices, January 2012.
Government Accountability Office (GAO). 2012b. Medicare Advantage: Quality Bonus Payment Demonstration Undermined by High Estimated Costs and Design Shortcomings, March 2012.
Glenn Hackbarth, Chairman of the Medicare Payment Advisory Commission. 2011. Letter to Donald Berwick, Administrator for the Centers for Medicare & Medicaid Services, January 6, 2011.
Medicare Payment Advisory Commission (MedPAC). 2010. Presentation by Scott Harrison to the Medicare Payment Advisory Commission, “The Medicare Advantage Program: Status Report,” November 4, 2010.
Medicare Payment Advisory Commission (MedPAC). 2011. Report to the Congress: Medicare Payment Policy, March 2011.
Medicare Payment Advisory Commission (MedPAC). 2012. Report to the Congress: Medicare and the Health Care Delivery System, June 2012.
Gregory Pope, John Kautter, Randall P. Ellis, et al. 2004. “Risk Adjustment of Medicare Capitation Payments Using the CMS-HCC Model,” Health Care Financing Review, Summer 2004.
Prescription Drugs
Options Reviewed
This section discusses several options for reducing Medicare spending for prescription drugs in Medicare:1
» Medicare Part D: Provide rebates on prescription drugs used by low-income subsidy recipients enrolled in Part D plans, reduce payments for single-source drugs in Part D, and additional options to make the Part D market more competitive
» Medicare Part B: Change the methodology for determining payment rates for prescription drugs covered under Part B
» Drug approval and patent policy: Accelerate the use of generic and follow-on biologic drugs
Medicare covers the cost of prescription drugs in both inpatient and outpatient settings. For many years, Medicare has provided inpatient coverage of prescription drugs through Part A and coverage in certain outpatient settings, such as physician offices, outpatient departments, and dialysis facilities, through Part B. In 2006, Medicare added a new voluntary Part D benefit to cover outpatient prescription drugs through private stand-alone prescription drug plans (PDPs) or as part of comprehensive coverage in Medicare Advantage (MA) plans. In 2013, the program is projected to spend $79 billion on Part D outpatient prescription drugs, or about 13 percent of total program spending, and about $20 billion (3 percent of total program spending) on the provision of drugs through Part B (Exhibit 2.3).2 The average annual per capita growth rate on Medicare Part D spending is projected to be 6.5 percent between 2012 and 2020 (Exhibit 2.4). Medicare savings could be achieved by modifying current payment policy for prescription drugs through a variety of approaches.
Background
Med Medicare pays for prescription drugs under Parts A, B, and D. In the case of Part A, Medicare covers prescription drug costs when provided during stays in an inpatient hospital or skilled nursing facility, as well as drugs used in hospice care for symptom control or pain relief. The cost of prescription drugs in these settings generally is covered as part of a bundled prospective payment for services provided in an inpatient setting, thus putting the facility in charge of managing the price and use of drugs.
Medicare Part B covers drugs in several circumstances including: drugs administered under the direct supervision of a physician (such as infusion of chemotherapy drugs), certain oral cancer drugs that are clinical substitutes for physician-administered drugs, and drugs used in conjunction with Medicare-covered durable medical equipment (DME), such as a nebulizer or infusion pump. Most Part B drugs are paid under a system based on an average sales price (ASP). In addition, Medicare Part B covers drugs provided in conjunction with services delivered in hospital outpatient departments or dialysis facilities; these drugs are included as part of larger payment bundles for services provided at these facilities.
Medicare Part D, the voluntary prescription drug benefit enacted in the Medicare Modernization Act of 2003 and implemented in 2006, covers outpatient prescription drugs. Under Part D, Medicare makes payments to private plans—either stand-alone prescription drugs plans (PDPs) or comprehensive Medicare Advantage (MA) plans—to subsidize the cost of the prescription drug benefit for enrollees. Beneficiaries participating in traditional Medicare may select a PDP for their drug coverage, while those in Medicare Advantage may enroll in the drug plan offered by their Medicare Advantage plan. Basic drug coverage parameters are set in law, but participating plans have flexibility to manage a formulary, employ tiered cost sharing and other utilization management techniques, and create networks of participating pharmacies (all within a set of Federal guidelines) (Exhibit 2.5). Federal subsidies to the plans cover 74.5 percent of the cost of the average plan. Enrollees selecting more expensive plans pay the higher cost above the average bid, while those selecting less expensive plans pay less.
Policy Options
Medicare Part D
OPTION 2.9
Require manufacturers to pay a minimum rebate on drugs covered under Medicare Part D for beneficiaries receiving low-income subsidies
The price paid for a Medicare Part D drug is determined through negotiation between private drug plans that administer the benefit and the manufacturer of the drug. By contrast, drug prices in the Medicaid program are based on a rebate system. For any drug covered in Medicaid, the manufacturer pays a rebate to the Federal government (shared with the states) defined as the lesser of a minimum amount or an amount based on the best price paid by private purchasers, with an additional rebate if the drug’s price increases faster than general inflation. Prior to the introduction of Part D in 2006, Medicaid covered prescription drugs for beneficiaries dually eligible for Medicare and Medicaid, with drug prices subject to the rebate system. However, beginning in 2006, responsibility for drug costs for dual eligible beneficiaries shifted from Medicaid to Medicare Part D, and Medicaid rebates no longer were required. Part D discounts negotiated by private plans are smaller (averaging about one-third the size) than the rebates received by Medicaid, which means that Medicare pays higher prices than Medicaid would for low-income enrollees (HHS OIG 2011a).
An option to achieve savings in Medicare would be to require manufacturers to pay a minimum rebate on drugs covered under Medicare Part D (including best price and inflation provisions similar to the current system under Medicaid) for Medicare beneficiaries enrolled in the Low-Income Subsidy (LIS) program.
Budget effects
Requiring manufacturers to provide a rebate on all prescription drugs used by low-income beneficiaries is estimated by the Congressional Budget Office (CBO) to achieve $137 billion in savings over 10 years (2013–2022) or about $15 billion in the first year of full implementation (CBO 2012a).
Discussion
Advocates of this option argue that it would achieve considerable savings and put the nation’s largest public programs on par when it comes to paying for drugs. Opponents argue that a rebate policy would reduce revenue available for private investment in research and development for new drugs, reduce incentives for manufacturers to offer favorable rebates to private payers, and result in higher prices for new drugs. Opponents also contend that this option would undermine the competitive system used in Part D and lead to higher beneficiary premiums (Antos and King 2011; Holtz-Eakin and Ramlet 2011). Advocates suggest the effects on research and development would be relatively small, and CBO scoring appears to support this perspective (Frank 2012).
OPTION 2.10
Authorize the Secretary of Health and Human Services (HHS) to negotiate lower prices for high-cost single-source drugs
Currently, responsibility for Part D drug pricing falls in the domain of the competing private Part D plans that offer the drug benefit to participating beneficiaries. Private drug plans seek to negotiate lower drug prices (both direct retail prices and manufacturer rebates) through decisions about which drugs are on formulary and on preferred formulary tiers. Current law explicitly states that the HHS Secretary “may not interfere with the negotiations between manufacturers and pharmacies and PDP sponsors.” This option would authorize the HHS Secretary to negotiate lower prices for high-cost drugs sold by only one manufacturer (i.e., single-source drugs). In addition to direct negotiation by the Secretary, one approach to such negotiation would be a system of binding arbitration (Frank and Newhouse 2008). A third alternative would use a mandated rebate for the same subset of drugs instead of a drug-by-drug negotiation process (similar to Option 2.9).
Budget effects
No current cost estimate is available for this option. In 2007, CBO scored a proposal to remove the current non-interference provision, but retaining the ban on a Federally required formulary, as having a negligible effect on costs. CBO based the lack of scored savings on the premise that the HHS Secretary would have no leverage for negotiation in the absence of any power to require a formulary and thus to obtain discounts in recognition of preferred formulary status. In 2008, CBO reiterated its view but suggested the possibility of small savings “for single-source drugs that had no close substitutes on the market,” where the HHS Secretary might use the power of persuasion to obtain discounts. Similarly, the Secretary could consider requiring plans to use prior authorization for specified drugs for which no discount is provided as part of a negotiation strategy, even in the absence of a national formulary (CBO 2008).
Discussion
Though CBO has cast doubt on the potential for savings with a simple repeal of the non-interference provision, its 2008 statement suggests that a targeted expansion of Federal involvement in pricing can offer savings if it creates true leverage for a negotiation. Private drug plans have the most leverage to obtain discounts on brand-name drugs that face competition from other drugs that treat the same medical condition. In these cases, plans use available tools (such as tiered cost sharing or step therapy) to encourage enrollees to use one particular drug among other options in the drug class. Manufacturers typically offer discounts in recognition of the higher market share for their drug. Private plans are least able to negotiate discounts on brand-name drugs with no real therapeutic alternative, including many of the new, expensive biologic drugs.
Advocates of a Federal role in price negotiation (or a targeted rebate) contend that the government would have greater leverage to obtain better prices on these high-priced drugs. Opponents respond that the higher prices for these new single-source drugs reflect the high cost of developing new drugs and such policies would inhibit research and development.
OPTION 2.11
Authorize the HHS Secretary to administer a Medicare-sponsored Part D plan to compete with private Part D plans
The Medicare prescription drug benefit is provided through a system of competing private plans, which have an incentive to keep premiums down in order to gain a larger share of enrollment. Although the current system relies exclusively on private drug plans, some policymakers have advocated for a government-operated approach to providing drug coverage, in line with the traditional Medicare program.
One option for achieving savings would be to authorize the HHS Secretary to administer a Federally-run Part D plan offered through the Medicare program to compete with private drug plans. Like other Part D plans, this Medicare-sponsored plan would have the authority to establish formularies, use cost-sharing tiers, and apply utilization management tools. This plan could be offered as the default option for beneficiaries who fail to select a plan or for Low-Income Subsidy (LIS) beneficiaries whose current plan no longer qualifies as an LIS “benchmark” plan.3
Budget effects
No cost estimate is available for this option. Savings could be achieved to the extent that the Medicare-sponsored option is able to provide coverage more efficiently than private plans in certain parts of the country or spur greater competition in the Part D marketplace. This would depend on the ability of the Medicare-sponsored option to leverage lower prices, manage utilization more effectively, and operate with fewer administrative expenses than private Part D plans. The likelihood of savings would be reduced if private plans were able to attract healthier and less-expensive beneficiaries than enrollees in the Medicare-sponsored option (beyond the reach of risk-adjustment factors). More specific assessment of the potential cost implications of this option would depend on many design decisions and on projected enrollment.
Discussion
Advocates of a Medicare-sponsored plan suggest that it would have greater negotiating leverage over drug prices and lower administrative costs, which could bring the cost of the Part D benefit down for both beneficiaries and the government. In addition, it might have the ability to test reforms aimed at addressing long-term cost drivers, such as the growth of expensive specialty drugs. Critics of this option contend that a Medicare-sponsored plan would have less latitude to adopt formulary and utilization management approaches than private plans, which could limit its ability to obtain discounts on drug prices. If true, enrollment might remain modest and the plan’s impact on costs would be minimal.
OPTION 2.12
Authorize the HHS Secretary to engage in a competitive bidding approach that excludes plans with relatively high bids or poor quality
The competitive model for Medicare Part D achieves lower costs when competing plans reduce costs—and thus beneficiary premiums—by managing utilization and negotiating for low drug prices. If beneficiaries regularly shop for lower premiums and total out-of-pocket costs, plans have a greater incentive to keep costs low. Evidence suggests that many Part D enrollees have not been selecting the optimal plan for their particular drug needs and that many enrollees do not reconsider their plan choice on a regular basis (Polinski et al. 2010; Abaluck and Gruber 2011; Zhou and Zhang 2012). Both factors tend to reduce the incentives for plans to compete vigorously for plan enrollment and to minimize total spending.
Medicare could increase incentives for plan competition by replacing the current “all-comers” approach with a system of competitive bidding, whereby low-quality plans or plans that bid too high are excluded from the program (Rice and Cummings 2010). To minimize disruption, plans with winning bids could remain in Medicare for more than a single year.
Budget effects
No cost estimate is available for this option.
Discussion
Proponents of a competitive bidding approach contend that it would enhance competition on both cost and quality by requiring plans to compete first for inclusion in the program and then, if they meet the standards of participation, compete for enrollment. A program with fewer plans might also make it easier for beneficiaries to review their choices and to make more optimal selections. On the other hand, excluding potential competitors could reduce the scope of competition and eliminate the best plan option for some beneficiaries.
OPTION 2.13
Reduce reinsurance payments to Part D plans
Part D includes several mechanisms by which the Medicare program partially offsets the insurance risk faced by Part D plan sponsors:
» A risk-adjustment system for the capitated payments made by Medicare to Part D plans;
» Reinsurance payments to plans whereby Medicare pays 80 percent of the cost of covered benefits for any individual enrollee with drug spending above the catastrophic coverage threshold; and
» Risk-sharing corridors under which Medicare shares unanticipated losses (and profits) incurred by plans.
Federal reinsurance payments for high-cost users totaled an estimated $13 billion in 2011, or 22 percent of Federal Part D costs. About 9 percent of Part D enrollees had spending in 2010 high enough to reach the catastrophic phase of the Part D benefit—the point at which 95 percent of costs are partially paid by Federal funds (80 percent directly as reinsurance and 15 percent by the plans, but with Federally subsidized premium dollars). Spending incurred by these beneficiaries represents 44 percent of total drug costs for Part D enrollees (MedPAC 2012a). One option to achieve savings would be to reduce by half the Federal reinsurance payments to Part D plans for costs above the catastrophic coverage threshold—from 80 percent to 40 percent, with 55 percent paid by the plans (up from 15 percent under current law).
Budget effects
No cost estimate is available for this option. A reduction of reinsurance payments would not directly reduce Federal spending because total Federal subsidies, as 74.5 percent of plan costs, are divided between direct premium subsidy amounts and reinsurance payments; if reinsurance payments are lower, then the direct premium subsidy is higher. However, Federal savings would be achieved if the reduction of reinsurance increases the incentives for plans to manage utilization by these high-cost users and if plans successfully implement more effective management. In that case, the resulting savings would be shared by the plans and the Federal government in future-year premium bids and in risk-sharing payments.
Discussion
Reinsurance blunts incentives for plans to manage the costs of high-spending enrollees by making the government responsible for the vast majority of costs for enrollees who exceed the catastrophic cost threshold. With only 15 percent exposure for high-cost users, plans may be less likely to invest resources in efforts to manage the drug costs of these enrollees. To the extent that plans continue to receive full manufacturer rebates for drugs purchased by these enrollees, plan incentives to manage drug use are further blunted. In some situations, rebate revenue may actually offset the plan’s cost for brand drugs in the catastrophic phase. A substantial reduction in the reinsurance share could significantly increase plan incentives to manage costs.
Plans, however, may argue that tools for managing many high-cost enrollees are limited, especially because the choice of treatment options is driven by physicians with whom they lack any contractual relationship (which is particularly the case for stand-alone PDPs). In addition, an original reason for including reinsurance payments in the system was to protect plans from the consequences of adverse selection—although this proposal would leave the protections of risk adjustment and risk-sharing corridors in place. If plans perceive higher risk, they may increase premiums or take steps to avoid the most risky enrollees.
OPTION 2.14
Encourage plans to expand the use of generic drugs
Generic drugs accounted for 75 percent of all prescriptions paid for by Part D in 2010 but just 25 percent of Part D spending.4 Use of generics saved Medicare $33 billion in 2007 (CBO 2010). Patent expirations for popular brand-name drugs provide opportunities for Medicare and other payers to achieve additional savings. To encourage use of generics, plans use tiered cost sharing, step therapy, and other utilization management approaches. Additional steps could be taken to increase use of generic drugs in Part D.
OPTION 2.14A
Increase the differential between generic and brand drug copayments in drug classes where generics are broadly available
One option to achieve savings would be to increase the differential in copayments between generic and brand drugs in drug classes where generics are broadly available. There is some evidence that a zero copayment for generics creates a much stronger incentive than does a low copayment. Although some plans now apply a large copayment differential and some set the generic copayment at zero, CMS could modify the guidance to plans that use tiered cost sharing to encourage larger differentials or lower copayment levels for generic drugs, or create incentives (e.g., through performance measures) to increase generic use. In addition, nondiscrimination rules that currently disallow differential cost-sharing policies for drugs used to treat different medical conditions could be modified to allow variations in cost sharing based on the availability of generics in a particular class of drugs.
Budget effects
No cost estimate is available for this option. Using 2007 data, CBO has projected additional savings of nearly $1 billion if all prescriptions for multiple-source brand-name drugs had been filled with generics and another $4 billion with increased therapeutic substitution in seven drug classes (CBO 2010).
Discussion
Advocates point to evidence that plans can use different cost-sharing structures, especially lower copayments for generics and higher copayments for brands, to increase incentives to substitute generic drugs and achieve savings (Hoadley et al. 2012). Sharper financial incentives may encourage more patients to use generics. However, a concern with this option is that it could impair access and outcomes for patients whose clinical response to a generic drug is less than optimal, although this concern could be addressed if effective exceptions processes are guaranteed in these cases. Some have expressed concern that reduced use of brand-name drugs would lower returns on these drugs and thus weaken incentives for research associated with pharmaceutical innovation.
OPTION 2.14B
Increase the differential between generic and brand drug copayments for Low-Income Subsidy Part D enrollees in drug classes where generics are broadly available
For LIS enrollees, copayments are set in law (and updated annually by an indexing formula) and not subject to modification by plans. In 2013, some LIS enrollees (depending on income and eligibility status) are charged a $1.15 copayment for generic subscriptions and a $3.50 copayment for brands, while most others are charged $2.65 and $6.60, respectively. This may help explain why the rate of generic use for LIS enrollees is lower than that for non-LIS enrollees. The Medicare Payment Advisory Commission (MedPAC) has recommended increasing the differential in copayments between generic and brand drugs in drug classes where generics are broadly available (MedPAC 2012c). The Commission offered an example of $0 for generics, $6 for preferred brand drugs, and a potentially higher amount for non-preferred brand drugs. To protect against any adverse impact on access, MedPAC proposed that current exceptions and appeals processes would remain in effect in circumstances where the generic drug is not clinically appropriate, and that the HHS Secretary should monitor utilization for any access problems.
Budget effects
In 2011, MedPAC estimated that its recommendation on drug copays for LIS beneficiaries would lead to a reduction of $17 billion in Federal spending over 10 years (MedPAC 2011). If adherence to medications increases, there could be additional savings as a result of lower use of other medical services.
Discussion
MedPAC suggested that lower generic copayments would lead more LIS beneficiaries to switch to generics, with a resulting reduction in out-of-pocket costs that could in turn increase access and adherence to medications (MedPAC 2012c). The decreased costs experienced by plans would help to lower premiums and Federal subsidy payments. As with options to increase generic use for non-LIS beneficiaries, this option could reduce access if exceptions processes prove inadequate. MedPAC highlighted the importance of an effective exceptions and appeals process to protect beneficiary access. The option could also lower returns on brand-name drugs and thus weaken incentives for pharmaceutical innovation.
OPTION 2.15
Strengthen incentives for adherence
Although Part D plans are responsible for managing drug utilization and have a financial incentive to keep drug costs low, stand-alone prescription drug plans do not gain or lose money based on the cost or savings for non-drug services that may be a result of drug use. When beneficiaries receive drug benefits through Medicare Advantage plans, the incentives are better aligned. A small but growing body of literature suggests that greater adherence leads to lower use of health services and potentially better health outcomes (Osterberg and Blaschke 2005; McWilliams et al. 2011; Stuart et al. 2011; Jha et al. 2012).
Savings could be achieved by strengthening incentives for medication adherence. Options include: (1) lowering cost sharing for specific drugs, (2) targeted beneficiary education, (3) engagement of physicians or pharmacists in addressing non-adherence issues, (4) performance measures for drug plans aimed at adherence, and (5) broader systemic solutions involving medication adherence in initiatives such as accountable care organizations.
Budget effects
No cost estimate is available for this option. Increased adherence to drug regimens will likely increase spending for drugs in Part D. However, CBO recently concluded that it could attribute Part A or Part B savings based on increased drug use. In general, the agency finds that a 1 percent increase in prescription drug use results in a reduction in spending for medical services of about one-fifth of 1 percent (CBO 2012b).
Discussion
Proponents suggest that various factors can increase adherence and that different approaches may work for different patients and different disease states. Several studies show that lower cost sharing (including implementation of value-based insurance design) and more use of generic drugs are associated with increased adherence. But financial incentives may not be the entire solution, and targeted beneficiary education initiatives could play a role. The involvement of both physicians and pharmacists can help address some issues of non-adherence, and initiatives such as patient-centered medical homes or accountable care organizations could incorporate a focus on medication adherence. In addition, electronic health records could offer tools for tracking adherence and offering physicians and other clinicians more opportunities to counsel patients. CMS could take specific actions to strengthen incentives, including improved performance measures for both stand-alone PDPs and Medicare Advantage drug plans to increase adherence. For example, plans could be encouraged to implement elements of value-based insurance design, such as eliminating copayments for selected drug classes or for selected high-value drugs where adherence is critical. Critics may question whether the added direct costs associated with greater medication adherence would be fully offset by savings for hospital and physician care.
OPTION 2.16
Strengthen medication therapy management programs
In 2010, about 9 percent of Part D enrollees (about 2.3 million enrollees) had spending high enough to reach the catastrophic phase of the Part D benefit, meaning they had at least $6,440 in total Part D drug costs in that year. Spending by these beneficiaries represented 44 percent of total Part D drug spending. Most of these costs are paid with Federal dollars (MedPAC 2012a). In part to address the unique needs of people with high drug needs, all Part D plans are required to operate medication therapy management (MTM) programs that focus on beneficiaries with high drug costs, large numbers of drugs, or multiple chronic conditions. As of 2010, 2.6 million of 3 million eligible enrollees were participating in MTM programs (MedPAC 2012c).
Although all plans have created MTM programs, evidence on their effectiveness is limited. CMS is collecting data on plan MTM programs and conducting an evaluation of them, with results due in 2013. Evaluation results could help policymakers identify specific steps to increase the effectiveness of MTM programs. The original intent behind MTM programs was to improve medication use and to reduce adverse events that may result when beneficiaries take multiple medications. If properly designed, MTM programs could reduce unnecessary utilization of drugs by those taking multiple drugs, while also increasing adherence with the important drugs for a person’s condition. MTM programs could also focus on appropriate use of high-cost drugs. Steps to increase the effectiveness of MTM programs could include stronger incentives for beneficiaries, physicians, and pharmacists to participate, for example, reduced cost sharing if MTM participants undergo comprehensive medication reviews, or adding MTM provided by physicians or pharmacists as a covered Part B service. CMS could consider incorporating MTM programs into its shared savings programs for accountable care organizations. CMS also could consider improved performance measures related to MTM programs (Rucker 2012).
Budget effects
No cost estimate is available for this option. With Part D spending for 2013 projected at $79 billion, the highest-cost Part D enrollees will represent about 44 percent, or $35 billion, in spending. If costs for these enrollees were reduced even 10 percent, it would represent at least $3 billion in annual savings. Greater savings could be achieved if MTM programs result in less medical spending, such as for adverse drug-related hospitalizations (Budnitz et al. 2011).
Discussion
MTM program advocates emphasize improved safety and clinical outcomes as the most important results of effective MTM, and they can point to successful examples of such programs outside of Part D. Many of these exemplar programs can point to a return on investment through both lower medication costs and medical and hospital costs. Concern about the growth of these programs includes the possibility that up-front spending to operate the programs may not realize savings (MedPAC 2009). In addition, some enrollees may find the programs impose an undue burden and make it more difficult to access to needed medications.
OPTION 2.17
Repeal provisions in the Affordable Care Act that would close the Part D coverage gap by 2020
The original design of Part D included a coverage gap (between $2,970 and $6,955 in total drug costs in 2013 under the standard benefit design), in which beneficiaries were responsible for paying all drug costs out of pocket. Beneficiaries with costs that exceed the gap are then eligible for catastrophic coverage, in which the Federal government pays 95 percent of drug costs. The ACA phases out the coverage gap by 2020 through a combination of mandated lower manufacturer prices for brand drugs and gradually reduced beneficiary cost sharing. Repeal of the ACA—or of these specific provisions—would reduce Federal spending and shift those costs back to beneficiaries.
Budget effects
CBO has estimated that the provisions closing the gap result in an additional $86 billion in new Federal spending over 10 years, partially offset by $35 billion in reductions on other medical services under Medicare, for a net increase of $51 billion over 10 years (2013–2022). Legislation restoring the coverage gap would recoup that spending, but savings could be reduced if the Federal government had to repay discounts already provided by manufacturers (CBO 2012b).
Discussion
Proponents of repeal argue that the Federal government cannot afford additional entitlement spending at a time of large annual deficits and a growing national debt. Opponents say repeal would lower Federal spending but only by shifting costs back to Part D enrollees with relatively high drug costs. This also could lead some beneficiaries to skip drugs or take reduced doses, leading to higher medical costs.
Medicare Part B
OPTION 2.18
Lower the percentage paid by Medicare for Part B drugs from 106 percent to 103 percent of the average sales price
Since 2005, Medicare payments for many drugs covered under Part B—primarily injectable or intravenous products administered by a physician—are based on an average sales price (ASP) methodology. The ASP is based on sales data submitted to CMS by drug manufacturers, excluding sales under various government programs, and reflects the price net of various discounts and rebates. Medicare Part B drug payments are set at 106 percent of the ASP since not all providers can obtain the drug at the average price. Prior to 2005, Medicare paid providers at a rate equal to 95 percent of the average wholesale price (AWP), and costs were rising rapidly for Medicare and its beneficiaries. Since shifting to the ASP approach, Part B drug spending has increased modestly at 2.7 percent per year, compared with increases of 25 percent per year from 1997 to 2003 (MedPAC 2012a). Under this option, the current payment would be reduced from 106 percent of ASP to 103 percent.
Budget effects
CBO has estimated this option would save $3.2 billion over 10 years.
Discussion
Some have argued that the 6 percent add-on amount is excessive, especially for the most expensive drugs, and that there is no empirical justification for this amount. Furthermore, the percentage-based add-on is much greater for expensive drugs and creates an incentive to select the most expensive brand-name drug among available alternatives. Critics of changing this policy say that the current pricing methodology has done a good job of achieving savings, and that additional adjustments would threaten access to these drugs (Holtz-Eakin and Zhong 2011). Oncology providers also have argued that this option would have the greatest impact on small, community-based practices with the least leverage to negotiate prices with manufacturers. Patients treated by these practices might be referred to hospital outpatient departments for their treatments.
OPTION 2.19
Change from the current average wholesale price (AWP) methodology for certain Part B drugs to the average sales price (ASP) methodology used for other Part B drugs
Although the ASP-based system for setting prices is used for most Part B drugs, several small groups of drugs (drugs administered at home with an infusion pump, immune globulin administered by subcutaneous injection, and preventive vaccines for influenza, pneumococcus, and hepatitis B) are instead paid based on 95 percent of the average wholesale price (AWP). Because the AWP is more of a “list price” that does not incorporate frequently used discounts and rebates, it tends to overstate actual market prices. A 2005 study by the HHS Office of Inspector General (OIG) found that across about 900 brand-name Part B drugs, the ASP was 26 percent lower than the AWP at the median (HHS OIG 2005). Thus, even a 5 percent reduction in payments below AWP levels provides higher reimbursement than would occur using the ASP. Because the AWP generally is regarded as an unreliable indicator of the cost of the drugs listed above, Congress could move these drugs to the ASP system that has proven effective for other Part B drugs.
Budget effects
No cost estimate is available for this option. Total spending in 2010 for Part B drugs administered in physicians’ office or furnished by suppliers was $11.5 billion, of which no more than 5 percent (up to about $0.5 billion) is for drugs paid under the AWP methodology. Ten percent savings would yield savings of up to $500 million over 10 years.
Discussion
A switch to the ASP-based price for this set of Part B drugs, some of which are associated with the use of durable medical equipment, would correct the current payment methodology that appears to produce higher-than-necessary payments for these drugs. One reason for the exclusion of these drugs from using ASP-based prices may have been the intended transition of durable medical equipment to a system of competitive bidding, a reform that still is in progress. Because some drugs in this category have been subject to shortages, some worry that lower prices could exacerbate those shortages because the manufacturers would receive lower returns from production.
OPTION 2.20
Restore the legal authority for CMS to use a “least costly alternative” policy among competing Part B drugs
For some patients, there are multiple therapeutic alternatives available. However, under a system that reimburses physicians based on the sales price of the drug, physicians have no incentive to select a less expensive option. In fact, the 6 percent markup on the ASP may create an incentive to use the more expensive option (HHS OIG 2011). A notable example is the choice between Lucentis and Avastin—two related biologicals used to treat age-related macular degeneration in eyes—that have been shown to produce equivalent results for patients but have very different prices (Rosenfeld 2011; CATT Research Group et al. 2012). A 2011 report by the HHS Office of Inspector General estimated that paying for treatments using Lucentis at the lower Avastin rate would have generated $1.1 billion in savings in 2008–2009 and reduce beneficiary cost sharing by another $275 million (HHS OIG 2011c). A 2012 report by the OIG on drugs used to treat prostate cancer showed savings if the least costly drug in the class was substituted for other similar drugs, with a total one-year savings of $33 million, or 13 percent of the cost of this class of drugs (HHS OIG 2012b).
In the past, Medicare has used a “least costly alternative” policy, where Medicare bases the payment rate for a group of clinically similar services (drugs in this case) on the least costly item in the group. In April 2010, Medicare removed this policy from Part B drugs after a successful challenge in court (relating to inhalation drugs used to treat lung diseases, Zopenex and Duoneb). In 2012, the HHS Office of Inspector General recommended that CMS consider seeking legislative authority to reinstate Medicare’s authority to apply this policy (HHS OIG 2012b).
Budget effects
In 2011, MedPAC reported that restoring the HHS Secretary’s authority to apply a least costly alternative policy would lead to savings of $1 billion in Federal spending over 10 years (MedPAC 2011).
Discussion
Advocates to restore authority to use the “least costly alternative” policy argue that the current policy creates a financial incentive for providers to choose the more expensive drug. Restoring the “least costly alternative” policy could level the financial incentives and encourage physicians to select a therapy based on clinical and safety considerations. They also point out that beneficiaries would save money through reduced cost sharing.
Critics raise concerns that it would put CMS in the position of determining when treatments are similar enough to be used interchangeably without the benefit of a full array of clinical studies. In particular, some critics point out that the full value of a new, more expensive drug may not be immediately apparent when it first comes to the market. Limiting payment for the more expensive drug would not only make access to that drug more difficult, but would deny clinicians experience with the new drug that might lead to a better understanding of its clinical benefits.
OPTION 2.21
Require manufacturer discounts or rebates for Part B drugs or allow Medicare to negotiate drug prices for Part B drugs when Medicare purchases account for a large share of spending on a specific drug
Although the ASP methodology generally reflects pricing levels in private-sector transactions, various government purchasers acquire these drugs at lower prices than under Medicare’s rules. One option to address this pricing discrepancy would be to allow Medicare to negotiate drug prices in Part B for those drugs where the Medicare program purchases the majority of the particular drug. Alternatively, Medicare could consider policies such as reference pricing or a Medicaid-style rebate system for Part B drugs.
Budget effects
According to an analysis by the HHS Office of Inspector General, about $2 billion in Federal savings would be achieved if manufacturers of the 20 costliest single-source drugs paid under Part B were required to pay the same rebates required under Medicaid (HHS OIG 2011b). Of these 20 drugs, 13 would meet the criterion that Medicare purchases the majority of a drug, representing rebate savings of $1.6 billion in 2010 (GAO 2012). Savings would be greater if based on the full list of qualifying drugs.
Discussion
Supporters of this option say that allowing negotiation or establishing a system of rebates in Part B means the Federal government would no longer have to accept any price set by a pharmaceutical company. Critics respond that forcing lower prices would reduce incentives for innovative research by pharmaceutical manufacturers.
OPTION 2.22
Lower the reimbursement for Part B drugs for which the price based on the average manufacturer price (AMP) is lower than the current ASP-based price
Since 2005, Medicare has paid for most Part B-covered drugs based on the ASP. Manufacturers generally must provide CMS with the ASP and volume of sales for all drugs on a quarterly basis; they also must report the average manufacturer price (AMP). By law, the HHS Inspector General identifies Medicare Part B prescription drugs with an ASP that exceeds the AMP by a certain threshold (currently set at 5 percent) and reports the financial impact of lower reimbursement amounts in these cases. CMS has the authority to substitute a price based on the AMP (103 percent of AMP) for the ASP-based price (106 percent of ASP) when it is lower, but has never used this authority. In the 2012 Physician Fee Schedule final rule, CMS added a requirement that AMP could only be substituted for ASP if the ASP exceeded the AMP by at least 5 percent in two consecutive quarters or three of the four previous quarters. Citing drug shortage concerns based on the lower prices, CMS has not implemented this requirement. The 2013 final rule would prevent use of the AMP-based price for drugs deemed to be in short supply. Under this option, CMS could finalize and implement a policy for lowering the reimbursement for drugs for which the AMP-based price is lower than the ASP-based price, including adding safeguards through rulemaking authority.
Budget effects
In 2012, the HHS Office of Inspector General estimated annual savings of as much as $17 million if the AMP-based price were substituted for 14 of the 29 drugs exceeding the 5 percent threshold (HHS OIG 2012a).
Discussion
Advocates suggest that this option fulfills the original intent of the law that CMS is supposed to lower reimbursement for drugs when the AMP-based price is lower. Because there are issues with both methodologies, use of both price standards was intended to make sure that Medicare does not overpay for Part B drugs. The HHS Inspector General has recommended implementation of this policy. Opponents of this option contend that, even with the protections proposed by CMS, the lower prices could exacerbate the problem of prescription drug shortages. Through rulemaking, CMS has tried to address this issue by considering whether drugs subject to this policy appear on a drug shortage list maintained by the FDA.
Drug Approval and Patent Policy
OPTION 2.23
Shorten the exclusivity period for biologics from 12 years to 7 years
Biologics—drugs made from living organisms and their products—are likely to be a large element of drug costs moving into the future. Although biologics represent a fairly small share of Medicare Part D costs today (about 13%5), they represent a large share of Part B drug costs. Biologics paid for under either Part B or Part D constitute about one-fourth of Medicare drug spending.6 As more self-administered biologics enter the market, their share of costs in Part D will increase. By one estimate, the list of most prescribed drugs (measured by costs) is switching from domination by traditional drugs for chronic conditions to biologics, a result of both patent term expirations for traditional brand drugs as well as increased use of biologics. The patents for biologics with about $20 billion in annual sales will expire between 2012 and 2018, creating a significant opportunity for savings if follow-on biologics can be approved and gain acceptance in the marketplace (Grabowski et al. 2011).
The Biologics Price Competition and Innovation Act, enacted as part of the ACA, allows the FDA to approve follow-on biologics or biosimilars, by creating a pathway for more expeditious entry into the market (similar to treatment of generic drugs) and creating competition and lower prices. It also allows the FDA to create a formal designation of interchangeability for biosimilars, a status that will make it easier for physicians, patients, and payers to substitute the newly approved biosimilars as safe and effective alternatives. The FDA is in the initial stages of implementing the new statutory provisions. An estimate conducted in 2007 found that follow-on biologics might be priced at a discount of anywhere from 5 percent to 30 percent below current prices (Ahlstrom et al. 2007). Additional issues in the marketplace will be whether automatic substitution of biosimilars for the original biologic by pharmacists would be allowed (generally a matter of state law) and whether payers (including Medicare) will use formularies, cost sharing, and other incentives to encourage use of biosimilars.
One option to achieve Medicare savings would be to reduce the exclusivity period for biologics from 12 years to 7 years.
Budget effects
A proposal in the President’s budget for Fiscal Year 2013 to shorten the exclusivity period from 12 years to 7 years was estimated by CBO as saving the Federal government about $3 billion over 10 years (2013–2022).
Discussion
The specific proposal for shortening the exclusivity period from 12 years to 7 years is one means of getting follow-on biologics to the market more quickly. Proponents note that 7 years exceeds the 5-year exclusivity available to non-biologics, and that it still allows adequate time for manufacturers to recoup their research and development costs. But issues of acceptance and substitutability will be keys to shifting utilization and realizing these types of savings. It remains unclear whether State laws will permit automatic substitution of follow-on biologics at the pharmacy. In addition, many decisions to use these drugs, if administered by physicians, are not made at a retail pharmacy counter. Even if the FDA creates standards for the substitutability of these drugs, market adoption will require time to ensure acceptance by both physicians and patients. Also, there is concern that the considerably higher research costs for these drugs require more time to recoup costs and that shortening the exclusivity period could reduce incentives to develop new products (AARP Public Policy Institute 2012a; Frank 2012).
OPTION 2.24
Prohibit pay-for-delay agreements associated with patent exclusivity periods
The Drug Price Competition and Patent Term Restoration Act of 1984 created a new and faster pathway for approval of generic drugs by the FDA by proving that the generic drug is bioequivalent to the brand version. In general, the generic manufacturer may begin marketing its drug once all the original patents have expired. The law also provided a guaranteed minimum patent term for the original brand manufacturer and gave the first manufacturer with an approved generic version a period of 180 days when it would be the only generic on the market.
Some brand manufacturers have worked around the law by compensating a generic manufacturer for keeping its product off the market for a period of time—a practice referred to as pay-for-delay. The Federal Trade Commission (FTC) found that they keep generic drugs off the market for an average of 17 months. Several cases, seeking to bar pay-for-delay agreements, are currently making their way through the Federal court system. In December 2012, the Supreme Court agreed to hear one of these cases and could resolve this issue in 2013.
The President’s Fiscal Year 2013 Budget called for prohibiting routine settlements of drug patent litigation. In doing so, it would remove current incentives for generic drug companies to challenge patents by prohibiting a generic drug company from accepting anything of value from the patent holder in a settlement other than an “early entry date” for the marketing of a generic drug. A similar proposal to ban pay-for-delay agreements (S. 27) was introduced in 2011 by Senators Charles Grassley (R-IA) and Herb Kohl (D-WI).
Budget effects
CBO scored the Grassley-Kohl legislation as saving the Federal government $4.8 billion over 10 years (2012–2021), including both spending and revenue effects (the total effect on public and private drug spending was estimated as $11 billion over the 10 years) (CBO 2011). A similar proposal included in the President’s Fiscal Year 2013 budget was estimated by CBO as saving about $5 billion over 10 years (2013–2022).
Discussion
Proponents of prohibiting pay-for-delay agreements argue that these agreements keep less expensive generic drugs off the market, thus preserving higher prices for brand manufacturers. Higher prices raise costs for Medicare and other payers, and lead to higher cost sharing for brand drugs for enrollees, which may have a negative effect on patients’ access and adherence to these drugs. Opponents contend that the settlements may save money if they resolve expensive litigation between generic and brand manufacturers that would take longer to be decided in court than the length of the agreed-on delay. According to both generic and brand manufacturers, banning patent settlements would delay competition and cut the number of new generics that enter the market prior to the expiration of brand patents. Some opponents also argue that generic manufacturers may be less likely to initiate legal action in an all-or-nothing environment where a financial settlement is excluded as an intermediate option (Federal Trade Commission 2011; Kesselheim et al. 2011; AARP Public Policy Institute 2012b).
References
Click to expand/collapse
AARP Public Policy Institute. 2012a. Allow Faster Market Access to Generic Versions of Biologic Drugs, June 2012.
AARP Public Policy Institute. 2012b. Prohibit Pay-for-Delay Agreements, June 2012.
Jason T. Abaluck and Jonathan Gruber. 2011. “Choice Inconsistencies Among the Elderly: Evidence from Plan Choice in the Medicare Part D Program,” American Economic Review, June 2011.
Alexis Ahlstrom et al. 2007. Modeling Federal Cost Savings from Follow-On Biologics, Avalere Health LLC, April 2007.
Joseph Antos and Guy King. 2011. “Tampering with Part D Will Not Solve Our Debt Crisis,” American Enterprise Institute Health Studies Working Paper, June 29, 2011.
Boards of Trustees, Federal Hospital Insurance and Federal Supplementary Medical Insurance Trust Funds. 2012. 2012 Annual Report of the Boards of Trustees of the Federal Hospital Insurance and Federal Supplementary Medical Insurance Trust Funds, April 23, 2012.
Daniel Budnitz et al. 2011. “Emergency Hospitalizations for Adverse Drug Events in Older Adults,” New England Journal of Medicine, November 24, 2011.
CATT Research Group et al. 2012. Ranibizumab and Bevacizumab for Treatment of Neovascular Age-related Macular Degeneration: Two-Year Results, Ophthalmology, July 2012.
Congressional Budget Office (CBO). 2008. Budget Options, Volume 1: Health Care, December 2008.
Congressional Budget Office (CBO). 2010. Effects of Using Generic Drugs on Medicare’s Prescription Drug Spending, September 2010.
Congressional Budget Office (CBO). 2011. Cost Estimate, S. 27: Preserve Access to Affordable Generics Act, November 2011.
Congressional Budget Office (CBO). 2012a. Estimates of the Effects of Medicare, Medicaid and Other Mandatory Health Provisions Included in the President’s Budget Request for Fiscal Year 2013—March 2012 Baseline, March 16, 2012.
Congressional Budget Office (CBO). 2012b. Offsetting Effects of Prescription Drug Use on Medicare’s Spending for Medical Services, November 2012.
Express Scripts, Inc. 2012. 2011 Drug Trend Report, April 2012.
Federal Trade Commission. 2011. Authorized Generic Drugs: Short-Term Effects and Long-Term Impacts, August 31, 2011.
Richard Frank. 2012. Prescription Drug Procurement and the Federal Budget, Henry J. Kaiser Family Foundation, March 2012.
Richard Frank and Joseph Newhouse. 2008. “Should Drug Prices Be Negotiated Under Part D Of Medicare? And If So, How?” Health Affairs, January 2008.
Government Accountability Office (GAO). 2012. Medicare: High-Expenditure Part B Drugs, October 12, 2012.
Henry G. Grabowski et al. 2011. “Implementation of the Biosimilar Pathway: Economic and Policy Issues,” Seton Hall Law Review, 2011.
HHS Office of Inspector General (OIG). 2005. Medicaid Drug Price Comparison: Average Sales Price to Average Wholesale Price, June 2005.
HHS Office of Inspector General (OIG). 2011a. Higher Rebates for Brand-Name Drugs Result in Lower Costs for Medicaid Compared to Medicare Part D, August 2011.
HHS Office of Inspector General (OIG). 2011b. Letter to Senator Herb Kohl, October 6, 2011.
HHS Office of Inspector General (OIG). 2011c. Review of Medicare Part B Avastin and Lucentis Treatments for Age-Related Macular Degeneration, September 2011.
HHS Office of Inspector General (OIG). 2012a. Comparison of Fourth-Quarter 2011 Average Sales Prices and Average Manufacturer Prices: Impact on Medicare Reimbursement for Second Quarter 2012, August 2012.
HHS Office of Inspector General (OIG). 2012b. Least Costly Alternative Policies: Impact on Prostate Cancer Drugs Covered Under Medicare Part B, November 2012.
Jack Hoadley et al. 2012. “In Medicare Part D Plans, Low or Zero Copays and Other Features to Encourage the Use of Generic Statins Work, Could Save Billions,” Health Affairs, October 2012.
Douglas Holtz-Eakin and Michael Ramlet. 2011. Cost Shifting Debt Reduction to America’s Seniors, American Action Forum, July 21, 2011.
Douglas Holtz-Eakin and Han Zhong. 2011. Medicare Part B Drug Reimbursement Why Change A Market-Driven System That Works Well at Controlling Costs? American Action Forum, October 26, 2011.
IMS Institute for Healthcare Informatics. 2012. The Use of Medicines in the United States: Review of 2011, April 2012.
Ashish K. Jha et al. 2012. “Greater Adherence to Diabetes Drugs Is Linked to Less Hospital Use and Could Save Nearly $5 Billion Annually,” Health Affairs, August 2012.
Aaron Kesselheim et al. 2011. “Pay for Delay” Settlements of Disputes over Pharmaceutical Patents, New England Journal of Medicine, October 31, 2011;
J. Michael McWilliams et al. 2011. “Implementation of Medicare Part D and Nondrug Medical Spending for Elderly Adults with Limited Prior Drug Coverage,” Journal of the American Medical Association, July 27, 2011.
Medicare Payment Advisory Commission (MedPAC). 2009. Report to the Congress: Medicare Payment Policy, March 2009.
Medicare Payment Advisory Commission (MedPAC). 2011. “Moving Forward from the Sustainable Growth Rate (SGR) System,” Letter to Chairmen and Ranking Members of Congressional committees of jurisdiction, October 14, 2011.
Medicare Payment Advisory Commission (MedPAC). 2012a. Health Care Spending and the Medicare Program: A Data Book, June 2012.
Medicare Payment Advisory Commission (MedPAC). 2012b. Report to the Congress: Medicare and the Health Care Delivery System, June 2012.
Medicare Payment Advisory Commission (MedPAC). 2012c. Report to the Congress: Medicare Payment Policy, March 2012.
National Coalition on Health Care. 2012. Curbing Cost, Improving Care, November 2012.
Lars Osterberg and Terrence Blaschke. 2005. “Adherence to Medication,” New England Journal of Medicine, August 4, 2005.
Jennifer Polinski et al. 2010. “Medicare Beneficiaries’ Knowledge of and Choices Regarding Part D, 2005 to the Present,” Journal of the American Geriatrics Society, May 2010.
Thomas Rice and Janet Cummings. 2010. “Reducing the Number of Drug Plans for Seniors: A Proposal and Analysis of Three Case Studies,” Journal of Health Policy, Politics & the Law, December 2010.
Philip J. Rosenfeld. 2011. “A Prescription for Savings: Reducing Drug Costs to Medicare,” Testimony before the Senate Special Committee on Aging, July 21, 2011.
N. Lee Rucker. 2012. Medicare Part D’s Medication Therapy Management: Shifting from Neutral to Drive, AARP Public Policy Institute, 2012.
Bruce Stuart et al. 2011. “Does Medication Adherence Lower Medicare Spending Among Beneficiaries with Diabetes?” Health Services Research, August 2011.
Chao Zhou and Yuting Zhang. 2012. “The Vast Majority of Medicare Part D Beneficiaries Still Don’t Choose the Cheapest Plans That Meet Their Medication Needs,” Health Affairs, October 2012.
Provider Payments
Options Reviewed
This section begins with a discussion of reforming Medicare’s physician payment system and then reviews a number of approaches for reducing Medicare provider payments:
» Reform physician payment and the Sustainable Growth Rate (SGR)
» Modify update formulas and make other changes to overall payment levels
» Expand value-based purchasing and reduce hospital readmissions
» Reduce Medicare payments for medical education
» Expand competitive bidding and adopt selective contracting
» Rationalize payments across settings and circumstances
» Change payments for post-acute care and hospice case
» Modify or eliminate special provider payments
» Reduce geographic variation in Medicare spending
Changes to the way Medicare pays hospitals, doctors, and other health care providers have been a common feature of past efforts to reduce Medicare expenditures, and remain an important means of seeking future program savings. Medicare uses a variety of methods to pay providers for their services, most of which set rates in advance for specific services using fee schedules or prospective payment systems. These various payment systems undergo regular updates to reflect growth in the costs of delivering care and often are modified to improve payment equity across providers as well as to encourage more efficient and higher quality care.
Medicare pays most hospitals, skilled nursing facilities (SNF), and home health agencies (HHA) under prospective payment systems (PPS) using predetermined rates for a package of services such as a hospital stay or SNF day. Payment for many other services, such as physician visits, clinical laboratory services, and durable medical equipment, are made using fee schedules.
Despite the many differences in the way providers are paid, one unifying feature is that Medicare tends to pay a fee for each service that is delivered; sometimes the fee covers a set of services (such as a hospital stay) and other times it is a singular service (such as a lab test or a doctor visit), but Medicare generally pays each time a service occurs. Research has shown that such fee-for-service payment tends to encourage a greater volume of services, which can drive up costs. The Affordable Care Act (ACA) contains more than 100 changes in Medicare provider payments, many of which currently are being phased in. The ACA also authorized the Centers for Medicare & Medicaid Services (CMS) to test new payment methods including moving away from fee-for-service payments toward unified or bundled payments for care a patient receives from multiple providers.
Given the wide range and complexity of Medicare provider payment systems, the options discussed in this section by no means constitute an exhaustive list of policy changes that could potentially lead to savings. The approach taken here starts with broad categories of policy change including those that previously have been used to generate program savings and others that have been proposed or identified as a potential source of savings. Within each category, several options are discussed and the possibility for variations and alternatives noted. Estimates of potential Medicare savings are presented where available, but these do not take into account the interactive effects of combining options.
Medicare payment for physician services has been the subject of concern in recent years as short-term legislation has been regularly enacted to prevent substantial cuts in physician fees that would otherwise automatically result under the current Sustainable Growth Rate (SGR) formula. Enacting a long-term solution to the SGR fee reductions, which would increase Medicare spending against the current baseline, has been recommended by the National Commission on Fiscal Responsibility and Reform (the Simpson-Bowles commission) and also is discussed here. The Simpson-Bowles commission and the Medicare Payment Advisory Commission (MedPAC) each provided a menu of options for Medicare and Medicaid savings to offset the cost of their recommended reforms to the SGR. Those suggested program savings are addressed in the relevant policy categories as appropriate.
Policy Options
Reform Physician Payment and the Sustainable Growth Rate
The Balanced Budget Act of 1997 created a new Sustainable Growth Rate (SGR) formula that sets an annual target for Medicare spending on physician services. The target is composed of four factors:
» The estimated percentage change in physicians’ fees;
» The estimated percentage change in the average number of beneficiaries in original Medicare;
» The estimated 10-year average percentage change in real gross domestic product (GDP) per capita; and
» The estimated percentage change in spending on physician services due to any changes in law or regulation.
Under the SGR, if spending on physician services exceeds the target in a particular year, the annual update for physicians in the next year is reduced by that amount. Policymakers did not intend the formula to achieve significant savings; it was enacted as a safeguard against an increase in volume that might occur in response to constraints in the payment updates. However, the formula has proved to be flawed. Since 2001, the SGR would have triggered double-digit reductions in physician fees, and Congress has repeatedly intervened to postpone the cuts and enact freezes or small fee increases, most recently in early 2013 as part of the American Taxpayer Relief Act of 2012. Because the SGR remains the baseline policy, any legislation postponing or overriding fee reductions is “scored” as a cost to Medicare.
OPTION 2.25
Repeal the sustainable growth rate (SGR) and establish a series of legislated updates
The Simpson-Bowles commission recommended repealing the SGR and replacing it with a two-year freeze in physician fees in 2012–2013 and a 1 percent cut in all fees in 2014. The commission also recommended that, for 2015 and beyond, CMS develop an improved physician payment formula that encourages care coordination across multiple providers and settings and pays doctors based on quality instead of quantity of services.
MedPAC also has recommended repeal of the SGR coupled with a 10-year freeze in fees. In addition, MedPAC recommends that fees for non-primary care services be cut 5.9 percent each year for the first three years (MedPAC 2012e).
President Obama’s Fiscal Year (FY) 2013 budget does not include a specific proposal for fixing the SGR, but the Administration includes funds in its budget baseline and commits to working with Congress to achieve a permanent policy that will make payments to physicians predictable and encourage improvements in quality and efficiency.
Budget effects
MedPAC estimated that its recommendation would cost roughly $200 billion over 10 years.
Discussion
Experts have concluded that while the SGR likely resulted in smaller fee increases it has not restrained volume growth and may have contributed to volume increases for some specialties. Also, some physicians may have less ability to increase volume and therefore are hit harder by lower payment rates.
Payment reductions of the magnitude called for under the SGR formula could lead to serious access issues. Access to physician services currently is adequate for most beneficiaries but is a persistent concern. MedPAC’s most recent survey found that, only a small share of beneficiaries reported looking for a new physician and most reported no major problems; but finding a new primary care physician continues to be more difficult than finding a new specialist. Similar to prior surveys, racial and ethnic minorities in both the Medicare and the privately insured populations were more likely to experience access problems, particularly in finding a new specialist. For many physicians, especially certain specialists, not seeing Medicare patients may not be viable because Medicare represents a substantial portion of their practice revenue. The 2009 National Ambulatory Medical Care Survey found that among physicians with at least 10 percent of their practice revenue coming from Medicare, 82 percent of primary care physicians and 96 percent of physicians in other specialties accepted new Medicare patients.
Finally, beneficiaries would face increased costs under all of these proposals in the form of higher coinsurance payments combined with higher Medicare Part B premiums. To illustrate, if Part B spending increased by $100, the beneficiary share would increase $40, comprised of $20 for the 20 percent coinsurance and an additional $20 for a premium increase (25 percent of Medicare’s $80 portion).
OPTION 2.26
Retain the SGR and revise with a new a base period and other changes
This set of options would retain the SGR but change some of its parameters. Under this approach, Congress would forgive the cumulative spending that resulted from the temporary fixes enacted over 1996–2012. Lawmakers would then establish a new base period (e.g., 2012), limit the look-back period (e.g., to five years instead of 10), and base future payment updates to a different measure (e.g., GDP plus 1 percent). The formula could vary by type of services (e.g., a bigger update for primary care) and/or set an upper limit on any fee increase or decrease.
Budget effects
CBO estimates that resetting the SGR target at the 2011 spending level, with no other changes, would cost about $254 billion over a 10-year period (2013–2022) (CBO 2012c). Resetting the SGR target at the 2011 spending level and using GDP plus 1 percent in the target would cost about $314 billion and using GDP plus 2 percent would cost about $377 billion over the same 10-year period. According to CBO, using GDP plus zero percent, physician payments would again be cut beginning in 2016, because spending growth would exceed that target. Using GDP plus 1 percent would result in payments being cut beginning in 2017, but then rising again in the future. Using GDP plus 2 percent, physician payment rate updates would begin to rise in 2013.
Discussion
Retaining rather than repealing the SGR would maintain budget discipline but would be costly. MedPAC and others have concluded that the SGR has failed to moderate growth in the volume and intensity of physician services. A frequently cited reason for SGR’s lack of impact on service use is that the SGR does not provide any incentive for individual physicians to control the volume and intensity of services they provide and may, in fact, provide the opposite incentive since the update adjustment factor cuts all physicians’ reimbursements.
The SGR reform options also may not solve the physician update problem for the long term. CBO projects that negative updates would occur in some years unless the SGR target uses GDP plus 2 percent, which has a higher cost than the other options. Also, as was described for Option 2.25, beneficiaries also would face higher coinsurance and premium costs under this option.
OPTION 2.27
Make other reforms to the physician payment system
Separate from the SGR, lawmakers could make other changes to the physician payment system to generate savings for Medicare including reducing payments for “misvalued” services, cutting payments for multiple procedures performed on the same day, and making technical changes to payments for physician practice expense. These changes can affect the specific payment rate for an individual service by adjusting the relative value units (RVUs) for physician work, practice expense, and professional liability insurance expenses. Options related to changing the physician payment system by ensuring the payment accurately reflects the resources related to physician work and practice expense are discussed below.
OPTION 2.27A
Recalibrate the Resource-Based Relative Value Scale (RBRVS) to address “misvalued” services
The Affordable Care Act requires Medicare to establish a formal process for validating the physician fee schedule’s relative value units (RVUs). In 2012, CMS announced it would incorporate the statutory requirement for review at least every five years into its annual review of “misvalued” services that included a review of both the work and practice expense (PE) RVUs. MedPAC has recommended establishing an RVU reduction of at least 1 percent for five consecutive years.
The time that physicians and other health care providers spend in providing a service is also an important component to the calculations of the RVUs; current time estimates are based primarily on surveys conducted by specialty societies. To ensure the data are collected in a consistent and accurate fashion, MedPAC recommended the development of a cohort of practices to participate in data reporting. These practices would include a range of different practice types and those that incorporate techniques and technologies associated with improved efficiency, such as reorganized delivery systems and electronic health records. These groups would be the basis for collection of consistent and accurate time data for both work and practice expense, which could be used to identify overpriced services.
Budget effects
No cost estimate is available for this option. By statute, adjustments in RVUs are budget neutral and cannot cause expenditures to change by more than $20 million. However, changes associated with misvalued services could be made in a non-budget neutral manner. The savings would depend on the specific codes involved and corresponding utilization.
Discussion
ce 1992, Medicare’s physician fee schedule is based on the Resource-based Relative Value Scale (RBRVS), with payment based on the relative amount of resources it takes to provide a service as compared with other services. Concerns have been raised about perceived inequities in payments for primary care and those for other services, such as imaging, tests, and procedures,
In 2012, CMS initiated an annual review of “misvalued” services that were identified based on a variety of criteria, including high-expenditure services, services that had not been reviewed since 2006, services still valued at the original (1992) RVUs, all evaluation and management (E/M) services, and services that are publicly nominated. The process involves collaboration with the Relative (Value) Update Committee (RUC), created by the American Medical Association and national medical specialty societies to annually review a subset of services and make recommendations to CMS.
MedPAC believes an annual numeric goal for RVU reductions could improve the RVU review process. Concerns have been raised that this process is time consuming, will require significant resources by physician specialty societies and will take several years. There also are concerns that the process used by the RUC is not transparent and is dependent on surveys collected by specialty societies. CMS is developing a review process that includes different stakeholders and in September 2012 entered into two contracts to develop models for validation of physician work for new and existing services.
MedPAC has found that the time estimates are likely too high for some services. Further evidence of time errors contributing to misvalued services is CMS’ identification of services with revised downward time estimates after consultation with the RUC. Although the RUC does attempt to adjudicate the time estimates provided by surveys, the process lacks objective data. In addition, the process does not have an established framework for accounting for efficiencies that develop. An option to collect data from all physicians could be viewed as an administrative burden.
OPTION 2.27B
Expand the multiple procedure payment reduction (MPPR) policy
To account for efficiencies related to overlap or duplication of services, Medicare has a longstanding policy that reduces payment for the second and subsequent procedures furnished to the same patient on the same day (a reduction known as the multiple procedure payment reduction, or MPPR). The MPPR is applied to surgical procedures, outpatient physical therapy services, and many advanced imaging services. Depending on the services, the MPPR may apply only to the technical component (practice expense) or the professional component (physician work) or both. The size of the reduction in payment also depends on the type of service category.
The Government Accountability Office (GAO) has recommended CMS systematically review services commonly furnished together and implement a MPPR to capture efficiencies in both physician work and practice expense, where appropriate, for these services. The review would focus on service pairs that have the most impact on Medicare spending.
Similarly, MedPAC recommended implementing an MPPR to reduce the physician work component of diagnostic imaging services and expanding the MPPR to all imaging services and applying it to both the practice expense and professional components. MedPAC also encouraged CMS to explore applying the MPPR to the practice expense portion of diagnostic tests other than imaging such as electrocardiograms and cardiovascular stress tests.
This would accelerate efforts to expand application of the MPPR where appropriate. The ACA specifies that the HHS Secretary shall identify potentially “misvalued” codes by examining multiple codes that are frequently billed together and review and make appropriate adjustments to their relative values. CMS is working to identify non-surgical codes that are furnished together between 60 percent and 70 percent of the time. For 2013, CMS will extend the MPPR to practice expenses for some ophthalmologic and cardiovascular diagnostic services, and expand it to the professional component of certain advanced imaging services to include the professional component for physicians within the same group. The American Taxpayer Relief Act of 2012 (ATRA) increased the MPPR applicable to physical, occupational, and other therapy services from 20 percent to 50 percent beginning April 1, 2013.
Budget effects
No cost estimate is available for this option. Savings would depend on the specific procedures involved. Currently, changes in the MPPR are made in a budget neutral manner and produce no savings to Medicare. Congress could change that approach to achieve savings.
Discussion
This option would reduce excessive payments when multiple services are provided to a patient on the same day because the fee schedule does not recognize efficiencies that occur when two or more services are furnished together. But there often are disagreements about the magnitude of “duplicated” services and objective data can be hard to come by.
A potential downside to implementing this option is that beneficiary access to needed services could be affected if providers respond by providing fewer procedures or by arranging to perform services on different days to maintain separate billings. Monitoring of utilization could be undertaken to assess these effects and take steps to respond.
OPTION 2.27C
Change the assumptions used for determining the equipment utilization factor for calculating practice expense relative value units
Practice expense (PE) RVUs include the cost of the medical equipment used for each service, which are calculated on a cost per minute basis. The equipment cost per minute calculation includes minutes per year, an assumption about the percentage of time the equipment will be utilized (75 percent for certain expensive diagnostic imaging equipment and 50 percent for others), the price of the equipment, the interest rate, the useful life of the equipment, and maintenance.
The ACA requires the HHS Secretary to use a 75 percent equipment use rate for expensive diagnostic imaging machines beginning in 2011 in a non-budget neutral fashion, thus returning the savings to the trust fund. As a result, CMS increased the equipment use rate from 50 percent to 75 percent for 24 services that use diagnostic imaging equipment priced at over $1 million, such as diagnostic computed tomography angiography (CTA) and magnetic resonance angiography (MRA) procedures that use CT and MRI machines. ATRA increased the equipment use rate for such expensive diagnostic imaging equipment to 90 percent beginning in 2014.
Additional changes in assumptions regarding equipment use could be made. One option, recommended by MedPAC, would expand this provision to diagnostic imaging machines that cost $1 million or less. That is, a 75 percent utilization assumption would be applied to all diagnostic imaging machines. Another option would further increase the utilization assumption. For calculation of the cost of expensive medical equipment used for services, in 2009, MedPAC recommended the practice expense calculations should include a “normative” equipment standard which assumes that expensive diagnostic imaging machines are used 45 hours per week or 90 percent of the time that providers are assumed to be open.
Budget effects
No cost estimate is available for this option. Savings would require implementation in a non-budget neutral manner, as was done in the ACA and ATRA.
Discussion
These proposals are consistent with CMS’ commitment to improve the accuracy of practice expense payments. However, given the payment reductions resulting from changes in PE resource input assumptions, there is concern about beneficiary access to the affected services, especially in certain locales.
Modify Update Formulas and Make Other Changes to Overall Payment Levels
Annual payment rate updates based on statutory formulas are applied to most Medicare services (including inpatient and outpatient hospital, SNF, home health care, hospice, and hospital care in rehabilitation, psychiatric, and long-term acute care facilities). These formulas try to measure the price changes faced by providers in purchasing the goods and services that they use in the course of delivering patient care. Components of the formula, (such as employee wages and benefits, supplies and pharmaceuticals, and utilities and other building costs, are weighted to reflect the proportion of total cost contributed by each.
Medicare payments for such services as ambulance, ambulatory surgical centers (ASCs), laboratory services, certain durable medical equipment, and orthotics and prosthetics are updated annually by the increase in the Consumer Price Index (CPI).
To create an incentive for hospitals and other providers to improve their efficiency, the Affordable Care Act applies a productivity adjustment to most of Medicare’s annual updates. The adjustment reduces the update by the percentage increase in the 10-year moving average of private nonfarm business multifactor productivity, which is estimated to increase by about 1.1 percent per year over the long term. MedPAC research suggests that continued pressure on hospital rates leads to greater efficiency with quality that is at least as good.
The options below would achieve Medicare savings through changes to provider payment update formulas or other across-the-board changes to the level of payments.
OPTION 2.28
Freeze all Medicare payment rates for one year
A one-year freeze in all Medicare payment rates (except the physician fee schedule) would generate significant savings. Alternatively, provider-specific update reductions could be enacted based on analysis of the various Medicare service to determine which level of update is warranted.
Budget effects
No cost estimate is available for a fee freeze on all Medicare payment rates. Based on estimates from CBO, freezing inpatient and outpatient hospital payments in 2013 would save about $30 billion over 10 years (2013–2022), and freezing skilled nursing facility (SNF) and home health agency (HHA) rates would save about $6 billion and $4 billion respectively (CBO 2012b). Freezing the rates for all other Medicare services (except those paid under the physician fee schedule) would save about $12 billion, bringing total 10-year savings to about $52 billion for this option. The proposal generates significant savings because payment rates are not adjusted upward in future years to remove the effect of the one-year freeze.
Discussion
In general, cuts in annual update factors are simple to implement and can produce large savings, but deep cuts that are driven by the need for budget savings can work against the goal of sustaining beneficiary access to high quality care. Applying an across-the-board freeze or update factor reduction could fail to take into account what might be the appropriate update factor or payment level for a particular Medicare service.
In its March 2012 recommendations to Congress, MedPAC recommended payment update reductions for several Medicare services based on its analysis of the appropriate payment level for these services. This included reductions for inpatient and outpatient hospital services, rehabilitation and long-term care hospitals, SNFs, HHAs, ASCs, and hospice services.
OPTION 2.29
Use a refined inflation measure to update Medicare payment rates currently adjusted by the CPI
The Simpson-Bowles commission recommended adopting an inflation measure known as the “Chain-Weighted Consumer Price Index for Urban Consumers” or C-CPI-U, for most government programs including Medicare. The C-CPI-U, developed by the Bureau of Labor Statistics, is viewed as a more accurate picture of inflation’s impact on spending because it accounts for substitutions made when products and services become more costly. The following Medicare services base inflation updates on the CPI-U:
» Ambulatory Surgical Centers
» Direct graduate medical education
» Clinical diagnostic laboratory services
» Durable Medical Equipment (DME)
» Prosthetics and orthotics
» Parenteral and Enteral Nutrition (PEN)
» Ambulance services
Payment rates for other Medicare services use different inflation measures and would not be affected. These include hospitals and physicians as well as other facilities.7
Budget effects
No cost estimate is available for this option.
Discussion
Adopting the C-CPI-U inflation index has had bipartisan support in Congress. Government-wide adoption would affect tax revenues as well as eligibility and payments for many public programs, including Social Security, Medicare, Medicaid, and others. The largest savings would come from lower Social Security benefits resulting from reduced annual cost-of-living updates. In Medicare, use of C-CPI-U also could mean that more beneficiaries would be subject to income-related premiums under Parts B and D because the indexed thresholds would rise more slowly, and could trigger additional cuts by the Independent Payment Advisory Board (IPAB) (see Section Five, Spending Caps and Governance and Management for options related to IPAB).
OPTION 2.30
Reduce payment rates for clinical laboratory services
Clinical laboratory services are paid on the basis of fee schedules, and payments totaled about $9 billion in 2011. The fee schedules were established in 1985 based on local area charges (56 separate fee schedules apply across geographic areas), but national payment limits apply for each test, and as a practical matter most tests are paid at the national limits. The fee schedule amounts are indexed to increases in the CPI (and since 2011 are subject to the productivity adjustment) but legislation frequently has specified a freeze or reduction in rates; fees have been increased only three times between 1997 and 2012. This option would impose an across-the-board reduction in payments.
Budget effects
MedPAC estimated in October 2011 that a 10 percent reduction in clinical lab rates would save $10 billion over 10 years; the Middle Class Tax Relief and Job Creation Act of 2012 imposed a 2 percent reduction and was scored as saving $2.7 billion over 10 years (2013–2022).
Discussion
Although Medicare savings can be achieved by reducing provider payment rates, including those for clinical lab services, reducing fees does nothing to encourage more efficient use of clinical lab services. Reductions in Medicare fees may affect beneficiary access to services, particularly in rural areas served by smaller laboratories. Data that might be used to determine the adequacy of Medicare payment rates—comparing payments with the cost of providing laboratory services, for example—are not available.
Expand Value-Based Purchasing and Reduce Hospital Readmissions
In Medicare’s FFS payment systems, providers generally are paid more when they deliver more services without regard to the quality or value of the additional services. The Affordable Care Act begins to move Medicare toward a “value-based” purchasing (VBP) system, linking a percentage of the Medicare payment to quality and imposing penalties on hospitals for excessive readmission rates. The VBP payment adjustment is based on each hospital’s performance score for selected quality measures. Current measures primarily involve clinical process of care but also include patient experience of care, mortality and other patient outcomes, and Medicare spending per beneficiary as a measure of efficiency. In Fiscal Year 2013, the hospital VBP program affects only 1 percent of payments, increasing to 1.25 percent for FY 2014, 1.5 percent for FY 2015, 1.75 percent for FY 2016, and 2 percent for FY 2017 and thereafter.
Options related to strengthening and expanding the VBP programs and expanding the hospital readmissions reduction program are discussed below
OPTION 2.31
Use value-based purchasing (VBP) programs to achieve savings (rather than being budget neutral), increase the percentage of Medicare payments subject to VBP, and place greater emphasis on patient outcomes and efficiency
The ACA required value-based purchasing to be budget neutral—that is, the total amount of withheld payments must be paid out as value-based incentive payments to hospitals participating in the VBP program. This option would remove the budget neutrality requirement and a hospital’s VBP adjustment would be determined based on performance standards set in statute or by the HHS Secretary (for example, a hospital might be required to have a VBP performance score at or above the 75th percentile). This option also would restructure the hospital VBP program to emphasize measures of outcomes and reduce Medicare payments when lower quality, lower value care is provided. It also would gradually increase the proportion of Medicare payments subject to VBP to 5 percent, from a fully phased-in 2 percent under current law.
Budget effects
No cost estimate is available for this option. Savings from this option would depend on the proportion of payments subject to VBP and hospital performance on the quality measures. CMS has estimated that the VBP incentive pool for FY 2013 will total $963 million. Illustratively, if removing budget neutrality resulted in about 10 percent of the pool not being paid to hospitals and reverting to Medicare, potential 10-year savings would be in the range of $2.5 billion to $3.5 billion.
Discussion
This option seeks to improve patient outcomes and increase the efficiency of Medicare purchasing as it responds to current and future financing challenges. Adjusting a greater portion of Medicare’s payment for performance on quality measures moves Medicare further in the direction of becoming a prudent purchaser of services and provides an additional incentive for hospitals to improve the quality and efficiency of care. When payments are reduced for care delivered by lower-quality providers, Medicare would not pay other providers more, as budget neutrality requires.
Hospitals generally have argued that the VBP program should be budget neutral to ensure the focus is on quality improvement and not on generating budget savings. Budget neutrality allows the VBP incentive system to make larger bonus payments to top-performing hospitals, which gives an additional incentive for improved quality of care. Hospitals also may prefer a smaller share of payments to be determined based on quality performance to maintain predictability of payments.
OPTION 2.32
Expand value-based purchasing to other Medicare services
Medicare currently includes some level of performance-based payment in inpatient hospital and ESRD facilities. Beginning in 2012, an ESRD facility must achieve a total quality performance score that meets or exceeds a level determined by CMS in order to receive full payment. The assessment of each ESRD facility includes a range of performance standards, such as anemia management and dialysis adequacy.8 A value-based payment modifier will be applied to the physician fee schedule beginning in 2015 for some physicians, and will be extended to all physicians beginning in 2017. The adjustment, which is budget-neutral, will modify 1 percent of the physician fee schedule payment based upon the quality and cost of care.
The ACA directed the Secretary of Health and Human Services to develop VBP implementation plans for SNFs, HHAs, and ASCs. The plans address several issues including measure development, reporting and validation of data, setting performance thresholds, the structure and financing of payment adjustments, and public reporting. Implementation of VBP for these other programs, however, requires legislation.
Potentially avoidable hospital admissions and readmissions are elements of performance identified by HHS for possible inclusion in VBP for skilled nursing facilities and are incorporated into the Nursing Home VBP Demonstration. Reducing such admissions would have benefits in terms of both quality and greater efficiency. Unnecessary hospitalizations can be harmful to patients’ physical and mental well-being, and represent a significant expense for Medicare. A study by RTI International of dual eligibles estimated 42 percent of re-hospitalizations during a Medicare-covered SNF stay and 47 percent of hospitalizations of longer-stay Medicaid-covered nursing home residents were preventable. These admissions cost Medicare $2.6 billion in hospital payments in 2005.
(Exhibit 2.6) shows when quality reporting began for Medicare services not subject to VBP.
Budget effects
No cost estimate is available for this option. Savings from value-based purchasing would depend on the portion of payments put at risk and the performance of providers on the quality measures. Illustrative savings from extending VBP to other Medicare services are shown in (Exhibit 2.7), based on assumed savings of one-tenth of one percent of expenditures.9 Additional savings would accrue to the extent VBP spurred quality improvements that reduce program spending, such as fewer health care-acquired infections or lower critical care utilization.
Discussion
There is broad consensus among employers, beneficiary groups, and payers, both public and private, that health care services should deliver better outcomes and become more efficient. Various organizations have called for more performance measurement and value-based programs to help induce that improvement. Expanding VBP to other Medicare services would build on current quality initiatives and move other Medicare services toward more prudent purchasing.
Protecting beneficiaries is another consideration in designing VBP. Incentives should be structured to reward more efficient care and not stinting on care. For example, in encouraging reductions in avoidable hospitalizations and readmissions, safeguards to assure that necessary hospitalizations are not avoided should also be in place.
The effectiveness of VBP programs may depend on the efficacy of the measures, their focus on outcomes and efficiency, and proportion of payments subject to VBP. Poorly designed or inadequately risk-adjusted outcomes measures may affect access for the sickest patients.
OPTION 2.33
Expand the readmissions reduction program to post-acute care providers such as skilled nursing facilities, long-term care and rehabilitation hospitals, and home health agencies
The ACA includes a provision, effective October 1, 2012, to reduce inpatient hospital payments for hospitals with risk-adjusted readmissions exceeding a certain level. In FY 2013, the program applies to three conditions—heart attack, heart failure, and pneumonia—using standardized hospital readmission measures that currently are in the hospital quality reporting program. In future years, CMS plans to expand the list of applicable conditions beyond the initial three conditions and add conditions that have been identified by MedPAC.
In its March 2012 report to Congress, MedPAC recommended implementing a similar re-hospitalization policy for SNFs. This proposal also was included in President Obama’s FY 2013 budget. If modeled after the hospital readmission policy, this option would reduce payment rates to SNFs with above-average re-hospitalization rates.
Initially, the re-hospitalizations penalty may apply to a limited number of conditions for which hospitalization has been demonstrated as largely preventable with higher-quality nursing care. With experience and evidence, policies could be extended to apply to a broader set of conditions and to excessive rates, whether or not above average. For example, research has identified five conditions (respiratory infections, congestive heart failure, kidney and urinary tract infections, electrolyte imbalance, and sepsis) accounting for three-quarters of re-hospitalizations from SNF and preventable with high-quality nursing care. Risk adjusters also are available for these conditions to allow distinctions among preventable and unavoidable readmissions. A readmission policy also could be extended to long-term care hospitals. MedPAC found that long-term care hospital patients with certain conditions had experienced increases in readmissions disproportionate to their volume growth. Extending a readmissions policy to rehabilitation facilities and home health agencies would establish a consistent policy across post-acute care providers.
This option could be expanded to address additional preventable hospital admissions from Medicare SNFs. That is, Medicare SNF payments could be reduced for facilities with high rates of preventable hospital admissions for any nursing home resident who is a Medicare beneficiary, not just those in a Medicare Part A-covered SNF stay. Nursing home residents experience higher rates of preventable hospital use than other Medicare beneficiaries (Jiang et al. 2010). In part, these hospitalizations reflect inadequacies in physician and nurse staffing in nursing homes (Ouslander and Berenson 2011). They also reflect financial incentives for nursing homes, whereby admitting long-stay Medicaid patients to hospitals and then readmitting them to the SNF creates a post-acute stay, and the nursing home receives the higher Medicare SNF payment rate. Just as with the hospital readmissions policy, however, a potential downside to a penalty-based approach is that lowering payments to poor-performing facilities could make it less likely that they will invest the resources needed to provide nursing home residents with the level of care that precludes the need for a hospital stay.
Budget effects
CBO estimated that the President’s FY 2013 budget proposal to adjust SNF payments to reduce preventable hospital readmissions would save $1.4 billion over 10 years (2013–2022). No cost estimate is available for extending a readmissions reduction program to other post-acute services.
Discussion
Avoidable readmissions are a bad health outcome for patients and costly to Medicare. The current penalty for excessive readmissions is leading hospitals to give greater attention to the problem of readmissions. Extending the readmissions reduction policy to SNFs and other post-acute providers would provide a similar incentive for them to focus on the problem. Having all providers in the care episode face similar incentives could provide new incentives for improved communication and cooperation. According to MedPAC analysis, risk-adjusted re-hospitalization rates for patients with potentially avoidable conditions vary almost threefold across SNFs, suggesting a significant potential for improvement for many facilities.
However, hospitals treating a high proportion of low-income patients may have higher readmission rates and could be unfairly penalized. CMS has committed to working with stakeholders to undertake additional analysis. Concerns have been raised about potential overcrowding in hospital emergency departments if the hospital readmissions reduction program leads hospitals to avoid readmitting patients. Patients may be kept in observation status for an extended period of time and not admitted to the hospital. Rising use of observation care is a current Medicare issue for beneficiary advocates because the practice increases beneficiary coinsurance payments and represents hospital care that does not meet the requirement of a prior three-day hospital stay to qualify for Medicare SNF care.
Extension of the readmissions program could require refinement in other areas as well. One area of significant concern is patients under “extreme circumstances” such as transplants, end-stage renal disease, burn, trauma, psychosis, and substance abuse.
Reduce Medicare Payments for Graduate Medical Education
Medicare makes two types of payments to hospitals for costs associated with training medical residents. Direct graduate medical education (GME) payments are made to cover Medicare’s share of the costs of resident salaries and other direct costs borne by hospitals that operate medical residency programs. GME payments are projected to average about $3 billion annually through 2022. The indirect medical education (IME) adjustment further increases the amount paid to teaching hospitals for each Medicare beneficiary discharged from an inpatient hospital stay. These payments will total almost $7 billion in 2013, growing to nearly $12 billion by 2022.
OPTION 2.34
Reduce the indirect medical education adjustment
The IME adjustment is calculated using a formula intended to recognize the additional costs of patient care that teaching hospitals incur, taking into account the more complex mix of patients they treat and other cost factors. The formula essentially pays teaching hospitals an additional 5.5 percent per Medicare stay for every 10 percent increase in the hospital’s ratio of medical residents to beds.
MedPAC, the Simpson-Bowles commission, and others have recommended reducing the IME adjustment factor to a level consistent with the empirical estimates of the cost of providing patient care in hospitals that have medical residents compared to costs of care in other hospitals. The most recent published estimate justifies a factor of 1.88 percent, about one-third the current level (Nguyen and Sheingold 2011). Similar earlier estimates by MedPAC estimated that costs increase about 2 percent for every 10 percent increase in a hospitals’ resident to bed ratio.
Budget effects
In 2010, MedPAC estimated that reducing the IME adjustment from 5.5 percent to 2 percent would reduce annual IME payments by about $3.5 billion, or 54 percent of current spending. Applying that savings percentage to the most recent CBO projections of IME spending produces a savings estimate of approximately $50 billion over 10 years. The President’s budget for FY 2013 proposed to phase down the IME adjustment by a total of 10 percent, which CBO estimates would save $6 billion over 10 years (2013–2022).
Discussion
Paying more than the empirically justified level is viewed as excessive because additional funds are not needed to cover the costs associated with resident training. Moreover, other features of the Medicare payment policy for hospitals recognize higher costs borne by teaching hospitals. MedPAC has reported that Medicare revenue margins are much higher for teaching hospitals than non-teaching hospitals, in part due to the IME additional payments.
Teaching hospitals would have to make changes to accommodate what would be, for many, a substantial revenue reduction. Some of these changes might affect the availability of services or the quality of patient care provided to Medicare beneficiaries and others in teaching hospitals. In addition, some hospitals may decide to reduce the number of residents they train or residency programs they operate if the IME adjustment is reduced. Depending on which programs are reduced, long-term access to care could be reduced if fewer physicians are trained in needed specialties.
OPTION 2.35
Reduce direct graduate medical education payments
Direct graduate medical education payments generally are based on historical hospital-specific per-resident amounts, which are slightly higher for primary care residents than those in other specialties and are reduced for lengthy subspecialty training. Through 2013, the amounts are also subject to a floor and a ceiling based on the national average salary amount adjusted for local area costs. Finally, there are hospital-specific caps on the number of residents for which a hospital may receive reimbursement.
One option for reducing direct GME payments included in the Simpson-Bowles commission report would limit direct GME payments to 120 percent of the national average salary paid to residents in 2010, updated annually thereafter.
Budget effects
No cost estimate is available for this option.
Discussion
Per-resident payment amounts vary widely across hospitals, in part due to differences that are not directly tied to the current cost of operating the residency program, such as historical allocation of hospital overhead costs. Over time, Medicare policies have been modified to reduce this variation by instituting a floor on per-resident amounts as well as limiting updates to per resident amounts below a certain level. The approach recommended by the Simpson-Bowles commission would achieve program savings by limiting per-resident amounts and would base the limits using recent information on salaries paid to medical residents.
While achieving savings and reducing potentially unnecessary variation on payments for medical residency programs, a cap is a blunt instrument that could harm some residency programs. Some teaching hospitals with current costs that exceed the cap could reduce the resources they devote to resident training in ways that have negative effects on the quality of the resident training experience or that reduce the number of available residency positions. In addition, this option does not take steps to ensure that residency programs are producing the mix of physician specialties needed to address national health care needs.
OPTION 2.36
Reduce and restructure graduate medical education payments to hospitals
This option would pool IME and direct GME funding and create a new mechanism for distributing these payments to teaching hospitals. The initial aggregate pooled amount may or may not include reductions in IME funding as described in Option 2.34; MedPAC has recommended that savings from a reduction in IME be transferred to such a pool and combined with direct GME funds. Once an initial pool amount is established, it could be indexed to grow over time along with general inflation, health care price inflation, or some other measure.
The new pooled funds would be delinked from Medicare payment for inpatient stays and could be distributed in a number of ways. Under the model recommended by MedPAC, the HHS Secretary would establish performance-based standards for distributing the pool of graduate medical education funds. These standards would be designed to achieve certain educational goals and outcomes aimed at producing a health care workforce that delivers care at lower costs while improving quality. Funds could be paid to teaching hospitals, medical schools and other organizations sponsoring residency programs, and the level of funding tied to performance on the specified measures.
Additional ideas for distribution of Medicare’s GME funding may be identified in a forthcoming report by the Institute of Medicine (IOM), which currently is engaged in a consensus study of GME financing and organization aimed at addressing the health care workforce needs. The pooled funds could be limited to Medicare contributions or could be complemented by payments from other health care purchasers.
Budget effects
The budget effects of this approach depend on the extent to which the types of cuts discussed in Options 2.34 and 2.35 are included, and which indexing measure is used. In 2011, CBO estimated that pooling the excess IME funds, direct GME funds, and Medicaid GME funds, and indexing the pooled amount to annual growth in the CPI minus 1 percentage point would generate savings of $69.4 billion over 10 years (2012–2021). The vast majority of these savings would come from Medicare.
Discussion
This approach would allow Medicare’s contributions toward financing medical education to be allocated in ways that better meet national goals in the nature of graduate medical education training and the composition of the health care workforce. However, like the other options, reductions in funding could negatively affect some residency programs, and could make it more difficult to achieve improvements in the health care workforce aimed at meeting national needs.
Expand Competitive Bidding and Adopt Selective Contracting
Medicare generally contracts with all providers and suppliers that meet specified program standards. Use of competitive bidding and selective contracting offers potential for using markets to set program payment rates and opportunities to obtain lower prices in exchange for higher volume of Medicare business. Medicare has been phasing in a competitive bidding program for certain durable medical equipment, prosthetics, orthotics, and supplies (DMEPOS), beginning with nine metropolitan statistical areas (MSAs) in 2011. This program is slated to expand to an additional 91 MSAs effective July 1, 2013, and will then include a national mail order component for diabetes supplies.
OPTION 2.37
Expand the use of competitive bidding
Competitive bidding could be expanded to other items and services, such as clinical laboratory tests, diagnostic imaging services, medical devices, Part B drugs, and other commodities and could involve increased reliance on regional or national mail order companies. The approach is likely to work best for items and services that vary little in terms of quality (e.g., manufactured products meeting general standards and tests conducted using automated equipment) or for which there are adequate means to monitor supplier performance. For some items, competitive bidding might be conducted at the manufacturer level, rather than at the provider or supplier level, as is done today, for example, by the Veterans Health Administration through national contracts.
Budget effects
No cost estimate is available for this option. In the first year of operation, the DMEPOS competitive bidding program saved Medicare about $202 million, and CMS projects that the program will save the program $26 billion over 10 years (2013–2022), with an additional $17 billion in savings for beneficiaries during that period (CMS 2012b). This amounts to savings of 20 percent to 30 percent. Savings projections for other possible uses of competitive bidding are not available and could differ in percentage terms from the reductions projected for DMEPOS.
Discussion
Average payment reductions of 35 percent in the DMEPOS Round 1 Rebid suggest the potential for additional Medicare savings through expanded use of competitive bidding. Early experience under the DMEPOS competitive bidding program appears to have been generally positive, with relatively few beneficiary complaints and no obvious negative effects on beneficiary access or health status. Nonetheless, competitive bidding means that only some providers or suppliers can furnish competitively bid items and services to Medicare beneficiaries, making the characteristics of these providers—such as their geographic distribution—of obvious importance to beneficiaries. Doing business with a limited pool of providers or suppliers may, however, make it easier for CMS to monitor performance, require improved beneficiary service, and prevent fraud and abuse.
Critics have faulted the methodology used by CMS under the DMEPOS competitive bidding program for failing to make bids binding, basing payments on the median of winning bids, and having other perceived flaws, and have argued that these problems may cause the program to “degenerate into a ‘race to the bottom’ in which suppliers become increasingly unreliable, product and service quality deteriorates, and supply shortages become common” (Letter to Pete Stark 2010). There also are concerns that beneficiaries might be denied access to higher quality products, need to travel far to obtain the products they need, or suffer other, perhaps subtle changes in quality or service over time.
OPTION 2.38
Adopt selective contracting for provider or service categories
CMS could be authorized to use selective contracting, and this authority could be limited to urban areas or selected provider or service categories.10 Selective contracting could be used to negotiate payment levels lower than those that would otherwise apply or providers could be asked to offer Medicare a discount in return for being designated a Medicare preferred provider. In addition, selective contracting could be limited to providers meeting certain quality and efficiency thresholds, possibly leading to higher quality of care and improved beneficiary service.
Under one approach to selective contracting, Medicare beneficiaries would be required to select only from providers having contracts with Medicare. Alternatively, beneficiaries could retain the option of seeking care from any Medicare-enrolled provider, but would qualify for reduced cost-sharing or other incentives whenever they use a Medicare “preferred” provider.
Budget effects
No cost estimate is available for this option.
Discussion
Selective contracting would be a major departure for Medicare, especially if it restricted beneficiary choice. However, it could be used to reduce Medicare expenditures in locales with large numbers of providers of a certain type or for service categories where there is evidence that Medicare payment rates are overly generous. Some of the resulting savings could be used to encourage beneficiaries to use Medicare preferred providers. Selective contracting also could facilitate anti-fraud and anti-abuse efforts.
Selective contracting would not likely be a viable strategy in rural areas with few providers, or for provider or service categories in relatively short supply. Even in urban areas, CMS might find it challenging to identify providers meeting certain quality and efficiency thresholds who are also willing to agree to Medicare contract terms, but this might depend on the nature of these terms and CMS’ expectations with respect to per-service payment reductions. Also, in using selective contracting, CMS would need to ensure adequate beneficiary access throughout the affected geographic areas. Providers failing to secure contracts with Medicare might not be economically viable, especially if Medicare beneficiaries made up a substantial share of their current patient mix. Selective contracting also could end up imposing high barriers to entry of new providers and suppliers.
Rationalize Payments Across Settings and Circumstances
These options address the potential for Medicare to equalize payments for the same service across care settings, identify whether Medicare payment rates are reasonable relative to the broader marketplace and/or Medicare’s purchasing power, and encourage the delivery of care in the lowest-cost setting appropriate for the patient.
OPTION 2.39
Equalize payments across settings
Medicare maintains a large number of independent payment systems, sometimes producing very different payment rates for the same or similar services across settings of care. In recent years, Medicare has taken steps to address this issue, including limiting payments for the technical component of advanced imaging services furnished in physician offices at levels paid for these services in hospital outpatient departments, and limiting payments for certain surgical procedures furnished in ambulatory surgical centers but commonly provided in physician offices at the level paid in the physician office setting.
CMS could be directed to identify additional circumstances warranting payment equalization. MedPAC has called for such equalization with respect to outpatient visits furnished in hospital outpatient departments. MedPAC also has identified additional hospital outpatient department (OPD) payments that should be reduced to the levels paid when the same services are furnished in physicians’ offices or where current payment differentials between hospital OPD and physician office settings should be narrowed substantially. In addition, other options discussed in this section provide specific examples of approaches to payment equalization across post-acute care settings.
Budget effects
MedPAC has estimated that equalizing payments for outpatient visits furnished in hospital outpatient departments (phased in over three years with special safeguards for hospitals that serve a relatively large share of low-income patients) could reduce Medicare spending by between $250 million and $750 million in 2013 and by between $1 billion and $5 billion over five years (MedPAC 2012e). MedPAC has estimated that Medicare payment reductions for an additional 86 hospital OPD services, with the goal of producing a site-neutral payment policy for these services, would yield one-year Medicare savings of $900 million and reduce Medicare beneficiary cost sharing by $250 million. The potential savings from this option would depend upon the types of services affected, their Medicare utilization trends, and the amount of resulting per-service payment reductions, but could be substantial.
Discussion
MedPAC argues that Medicare should base payment rates on the resources needed to treat patients in the most efficient setting, taking into account any differences in patient severity. In doing so, MedPAC has noted that hospitals’ acquisition of physician practices has essentially had the effect of converting physician office buildings into hospital outpatient departments, thereby increasing Medicare expenditures for what had previously been physician office visits. Payment equalization also can have the added benefit of reducing beneficiary cost-sharing obligations.
A key challenge in equalizing payments across settings is making certain that “apples to apples” comparisons are being made. Providers argue that differences in patient characteristics, provider service or regulatory obligations, uncompensated care burdens, or the services covered by a Medicare payment amount in a given setting are among the factors that could easily make equalizing payments an inequitable undertaking. These differences might be addressed by reducing but not eliminating payment differentials across settings of care. Even when equalization is considered fair and proper, careful monitoring of beneficiaries’ access to the affected services is warranted.
OPTION 2.40
Use inherent reasonableness authority to reduce overpayments
In December 2005, CMS published a final rule specifying a process for correcting Medicare payments found to be “inherently unreasonable” because they are either grossly excessive or grossly deficient. This process, which applies to items and services not paid under a prospective payment system, has not been used since then, but CMS hosted a public meeting in 2012, to explore the possibility of using the process to reduce payments for non-mail order diabetic testing supplies. Although the American Taxpayer Relief Act of 2012 recently mandated equal payment for mail order and non-mail order diabetic testing supplies upon implementation of the national mail order competitive bidding program, CMS could apply the inherent reasonableness process to other items and services on an annual or other periodic basis. In addition, Congress could revise the inherent reasonableness authority to facilitate its use, such as by modifying procedural or data requirements.
Budget effects
No cost estimate is available for this option. CMS has characterized the savings potential for non-mail order diabetic testing supplies as significant.
Discussion
Successful application of inherent reasonableness to correct excessive Medicare payments would produce not only Medicare savings but also a reduction in beneficiary cost-sharing amounts. Application of the inherent reasonableness authority would allow Medicare to use means other than competitive bidding to determine market prices, such as surveys of retail prices for equipment and supplies that are generally available on a retail basis. Identifying valid and reliable data justifying a payment reduction (or a payment increase in the case of “grossly deficient” Medicare payments) may be a limiting factor in applying this authority. The procedural requirements related to use of inherent reasonableness may explain why this tool has not been used in the seven years since the associated regulatory framework was put in place.
OPTION 2.41
Encourage care in lower-cost settings
Medicare coverage and payment policies can influence the site of care. For example, if Medicare payments for one or more medically necessary services in one setting are considered inadequate by providers, a patient may be transferred to a higher-cost setting even though the services could have been furnished safely and effectively elsewhere at lower cost to Medicare. Addressing this problem may require adjustments to Medicare’s usual payment policies in order to provide more appropriate incentives. MedPAC recently discussed the potential for Medicare home infusion policies to produce Medicare savings by allowing patients to be treated at home rather than in higher-cost hospital or nursing home settings. One randomized clinical trial also demonstrated that savings could be produced by making supplemental payments to nursing homes to treat residents with pneumonia and other lower respiratory tract infections with a clinical pathway or treatment protocol rather than the usual practice of transferring them for inpatient hospital care. CMS could identify, on an annual or other basis, opportunities for modifying Medicare coverage and payment policies to incentivize appropriate care in lower-cost settings and a target Medicare savings amount could be specified.
Budget effects
No cost estimate is available for this option.
Discussion
Encouraging appropriate shifts in site of care is difficult. Shifts in site of service would need to result in savings that exceed the effects of other potentially confounding factors. For example, payment improvements relating to the provision of a service in one setting, such as home infusion therapy, could provide incentives for increased use of the service in such setting even when other, lower-cost services would have sufficed. In other words, unless policymakers proceed cautiously, Medicare could find that more patients end up receiving home infusion therapy rather than lower-cost oral medications, thus reducing any savings from shifting medically necessary infusion therapy from higher-cost settings.
Government-induced shifts in site of care should be predicated on reasonably solid evidence that such shifts are appropriate for Medicare beneficiaries, and not simply a means to produce Medicare savings. Finding the data needed to develop payment policies that properly encourage such shifts also is likely to be challenging. Nonetheless, taking advantage of the savings potential from shifts in site of care also could affect beneficiaries if their cost-sharing obligations end up being reduced in the process.
Change Payments for Post-Acute Care and Hospice Care
For patients leaving an acute care hospital, Medicare covers post-acute care in multiple settings—in institutions that include SNFs, inpatient rehabilitation facilities (IRFs), and long-stay hospitals, and at home with care from home health agencies. Some post-acute care, such as home health care, can be covered without a prior hospital stay, which is intended in part to prevent a hospitalization. Post-acute care, broadly defined, accounted for more than one-seventh (15 percent) of traditional Medicare spending in 2011, up from 12.9 percent in 2001, making it the third largest category of program spending (following hospital and physicians services).
Medicare payments for post-acute care services have grown rapidly in recent years. From 2006 through 2011, while overall Medicare spending growth averaged 4.6 percent annually, SNF and home health spending growth averaged 10.2 percent and 8.6 percent, respectively. Growth patterns differed for different types of providers. For SNFs, the number of providers across the nation held steady, but the number of home health agencies increased by almost 40 percent. Episodes of home health care grew substantially at 6.9 percent per year from 2002 to 2009.
Growth in the number of service providers and in benefits claimed is not by itself evidence of excessive spending. However, the geographic pattern of growth raises questions. The bulk of the new home health agencies are concentrated in a very small number of states and do not appear to be a response to a deficient supply. Growth is also disproportionately fueled by for-profit providers (MedPAC 2012e). In addition, profit margins show that payments to post-acute providers are well above costs. In 2010, average profit margins for free-standing or non-hospital SNFs (90 percent of all SNFs) reached 18.9 percent—according to MedPAC, the tenth consecutive year with margins above 10 percent. A quarter of SNFs had margins of 26.9 percent or higher. Home health agency margins have averaged 17.5 percent since 2001 and, in 2010, averaged 19.4 percent. These averages are more than twice the margins other provider types earn from Medicare.
This section examines several options for reducing costs and assuring quality of post-acute services.
OPTION 2.42
Modify skilled nursing facility (SNF) and home health payment
Medicare payments for SNF and home health services could be modified in a number of ways. One approach is an across-the-board reduction in the prospective payment rates paid to these providers, also called rebasing. Shared savings and risk is an alternative to rebasing under which the Medicare program would make retrospective adjustments to a provider’s payment. Another payment policy change would pay for therapy services based on a patient’s prospectively determined need for therapy rather than on the amount of therapy services provided.
OPTION 2.42A
Rebase SNF and home health payment rates
This option would reduce SNF and HHA payment rates to bring payments more in line with costs, a process referred to as rebasing. MedPAC has recommended rebasing SNF rates with a 4 percent reduction in 2014 and applying subsequent reductions, as determined by the HHS Secretary, over an appropriate transition until Medicare’s payments better track providers’ costs. MedPAC also recommended accelerating the rebasing of HHA rates—scheduled to begin in 2014—to 2013.
President Obama’s FY 2013 budget described an alternative approach to address SNF and HHA payment levels by reducing statutory payment updates for SNFs and HHAs and other post-acute care providers (inpatient rehabilitation facilities and long term care hospitals) by 1.1 percentage points each year for eight fiscal years, 2014 through 2021, or to zero if the result would have been a payment reduction.
Budget effects
MedPAC estimates its proposals to rebase SNFs and HHAs would each save between $5 billion and $10 billion over five years (MedPAC 2012c). CBO estimated that the update reductions for post-acute care included in President Obama’s FY 2013 budget would save $45 billion over 10 years (2013–2022).
Discussion
MedPAC recommends rebasing SNF and home health rates because the cost experience on which they are based has changed significantly since the implementation of the PPS more than a decade ago. PPS implementation led to a change in service mix with substantially lower-than-expected average costs compared to the historical experience used to set PPS rates. Persistently high average Medicare margins for both provider types reflect the resulting excess of average payments over average costs. Rebasing would align rates to reflect the costs of serving current patients.
MedPAC’s ongoing monitoring of beneficiary access and the quality of SNF and home health care has found no significant issues of concern. MedPAC believes the phased in SNF and HHA reductions it recommended would not have a significant negative effect on provider supply, beneficiary access, or the quality of care.
Rebasing, however, has limitations. Although it would narrow the gap between current payments and average service delivery costs, its application would not reflect the significant variation in the needs and costs of individual patients that is not captured by the patient classification categories used by the SNF and home health payment systems. Providers can therefore be advantaged by serving patients whose care needs are less than average for the category or disadvantaged by serving patients with above-average care needs. Rebasing to align average payments and average costs would particularly affect providers now serving patients with above average care needs who would be more likely to incur losses and would exacerbate incentives to avoid high cost patients. Moreover, for post-acute services, the absence of measurable standards of adequate care allows providers to profit from under-provision of care, regardless of the population they serve. Hence, even with rebasing to better tie average payments to average costs, profit margins may well continue to vary widely independent of providers’ efficiency in delivering care.
OPTION 2.42B
Modify SNF and home health payment to combine prospective payment with shared savings and risk
This alternative to rebasing would adjust payments to reflect actual service provision through retrospective adjustment to prospectively-set rates—sharing the difference between prospective payment rates and actual service costs with individual providers. At the end of each year, provider experience would be assessed to determine the difference between prospective payments and actual costs. Providers would receive a share, rather than the full amount, of any excess of rates over costs. Similarly, Medicare would pay a share of provider costs that exceeded prospective rates. To encourage efficiency, providers would be able to earn a sufficient share of profits and bear the larger share of losses. This policy option could be adopted with or without rebasing of current Medicare prospective rates.
Budget effects
No cost estimate is available for this option. MedPAC indicated that this type of option could be budget neutral. It also could be designed to result in an average margin level that represented what a prudent purchaser may be willing to pay. A 10 percentage point reduction in the average margin would have resulted in savings of approximately $3 billion in SNF spending and $2 billion in home health spending in 2011.
Discussion
Modifying post-acute payments to share savings and risk could reduce excess Medicare payments without the risks to patients posed by rebasing with across-the-board rate cuts. A system of shared savings and risk can achieve the same reduction in average payments while recapturing any excessive payments appropriately from each provider, depending on its actual patient mix and service costs. Retrospective adjustment payments to share profits and risks would reduce current incentives to under-provide without penalizing efficient providers or their patients.
A downside to risk-sharing is that it reduces the incentives to maximize the efficiencies that are associated with retention of all profits and absorption of all losses. Arguably, however, the absence of standards and inability to ensure adequate care mean providers’ financial gains may not reflect efficiencies, but, instead, reflect under-provision of care. Thus, risk-sharing improves the balance between the incentives for efficiency and patient protection. Some home health agencies may cease to participate in Medicare or close without the opportunity for a high return. Such exits could affect access to services, although most areas are served by multiple agencies and remaining agencies may be able to expand to serve more beneficiaries.
OPTION 2.42C
Refine SNF and home health prospective payments to fully incorporate therapies on a prospective basis
Both SNFs and home health agencies are paid prospectively based on how much therapy is provided, not on a prospective assessment of need. This option would replace payment for therapy services based on services received with payment based on predicted need for services. MedPAC recommended such a modification for SNFs in 2008 and for home health in 2011.
Budget effects
No cost estimate is available for this option. These modifications may be introduced in a budget neutral manner. The budgetary impact would then be related to changes in growth in the number of beneficiaries inappropriately receiving therapy or excessive amounts of therapy.
Discussion
Current payment methods encourage the provision of unnecessary or inappropriate therapy services and can produce greater profit margins. A prospective rate would link Medicare’s payment to a patient’s therapy needs, based on clinical factors, rather than allowing nursing homes or home health agencies to determine use and costs. This option could reduce excessive SNF and home health spending and reduce incentives to over-provide therapies relative to patient needs.
At the same time, however, paying prospectively, without regard to service actually delivered, has the potential to reward under-provision of therapy services, and requires additional steps to assure adequate quality care such as monitoring the receipt of services and/or the outcomes of care.
OPTION 2.43
Modify payments to Inpatient Rehabilitation Facilities (IRFs) to apply a blended rate for specific diagnoses and raise minimum case-mix requirements
IRFs provide care to Medicare beneficiaries for whom recovery from an illness, injury, or surgery requires intensive and complex rehabilitation services. Coverage of IRF services is subject to multiple requirements—including documentation of patients’ needs for multiple types of therapy, service delivery by a qualified (and medically supervised) interdisciplinary team, and a patient-mix (referred to as a compliance threshold) emphasizing a specific set of diagnoses.
Questions exist as to whether IRF care appropriately targeted achieves better results than less costly care in other post-acute settings where similar patients are commonly treated. Payment increases have exceeded increases in costs per case, and average margins are relatively high (8.8 percent in 2010) while freestanding and for-profit IRFs, dominated by a single chain, averaged margins of 21.4 percent and 19.8 percent respectively (MedPAC 2012e).
To address concerns that IRFs are overpaid, relative to SNFs, for roughly equivalent treatment of specific conditions, this option would set IRF payments equal to a blended SNF-IRF rate. The SNF rate would be adjusted upward for a portion of the difference between SNFs and IRFs in the average costs of care. This could be modified to also increase the compliance threshold, from 60 percent to 75 percent of IRF case-mix. Raising the threshold would better assure that a facility’s patients are likely to warrant the higher payment rate.
Budget effects
CBO estimated the President’s FY 2013 budget proposal to blend SNF and IRF rates for three diagnoses would reduce spending by $1.4 billion over 10 years (2013–2022). The estimated savings from increasing the compliance threshold to 75 percent was an additional $0.8 billion over 10 years (2013–2022).
Discussion
This option would reduce the rates paid to IRFs admitting patients requiring lower-intensity care and further dampen remaining financial incentives to inappropriately admit lower-cost patients. Savings from this option would be limited by the number of conditions affected. To the extent that current measures of rehabilitation needs and the outcomes of therapy do not fully capture differences among patients being served in SNFs and IRFs, this option may have an impact on care of some beneficiaries served in IRFs.
OPTION 2.44
Modify the hospital inpatient prospective payment system to include payment for long-term care hospitals
Long-term care hospitals (LTCHs) are a category of hospitals (more than a third are units within hospitals) that Medicare pays, with prospectively set rates, to treat patients with medically complex problems requiring exceptionally long stays (averaging a minimum of 25 days). No criteria exist for defining who does, or does not, belong in an LTCH. Respiratory conditions predominate among LCTH patients, with conditions requiring ventilator support for 96 or more hours the most frequent.
This option would pay the same rate for the same patient, whether served in a hospital or in an LTCH. Adjustments to Diagnosis Related Group (DRG) classifications might be necessary to appropriately accommodate patients requiring exceptionally long stays rather than relying on outlier payments for such stays.
Budget effects
No cost estimate is available for this option.
Discussion
Many parts of the country are without LTCHs. While there has been substantial growth in the number of LTCHs over the past decade, that growth often is in areas with existing providers rather than those with none. A higher concentration of LTCHs in an area appears to reduce the average severity of need among the patients being served. In the absence of LTCHs, patients with long-term acute care needs receive care in acute-care hospitals or SNFs—with no apparent differences in mortality or readmissions from similar patients treated in LTCHs. Although research indicates that for the most severely ill patients, care in LTCHs may be appropriate and no more costly than alternatives, criteria that can actually target service to these patients are lacking. In the absence of such criteria, prospective payment rates reward the admission of less severely ill patients who can be served as effectively elsewhere at lower costs. That LTCHs in areas with multiple facilities serve less severely ill patients validates this concern. In addition to payment of excessive rates for care in LTCHs, prospective payment per hospital stay encourages discharges to LTCHs, further increasing Medicare costs.
With little evidence to counter the conclusion that hospitals provide equivalent patients similar care at lower cost than LTCHs, there is little justification for supporting these institutions as a distinct class of Medicare provider.
OPTION 2.45
Modify prospective per diem payments to hospices to reflect variation in service intensity over the course of an episode
Medicare spending on hospice care totaled $13 billion in 2010 and has been growing at a 7.2 percent annual rate since 2006, making it one of the fastest growing components of Medicare. Between 2000 and 2010, hospice admissions more than doubled, enrollment in hospice care among beneficiaries who died during the year increased from 23 percent to 44 percent, and the number of hospices increased by 30 percent. This growth was disproportionately (90 percent) among for-profit providers. This option would align payments with beneficiary needs by varying the per diem payment rate over the course of an episode. Hospices would be paid a higher per diem rate for the first part of an episode (the first 30 days, for example) than for the remainder of the episode. At a patient’s death, the hospice would receive an additional payment, to compensate for higher costs associated with the end of life. The Affordable Care Act requires the HHS Secretary to revise hospice payment methods in a budget neutral manner after collecting more detailed data about hospice services. It suggests varying payment over the course of an episode, but does not require such a change.
Budget effects
No cost estimate is available for this option. The potential for savings exists if the entry of for-profit hospices is slowed by the prospect of less profit from extended stays.
Discussion
MedPAC has found a very skewed distribution of hospice stay lengths. The median stay is relatively short (17 days). Although longer stays (greater than 180 days) account for only a small proportion of hospice use, they generate higher hospice profit margins, due in large part to variation in the intensity of service over the course of a patient’s enrollment. Patients receive more frequent visits when they first enroll and in the period close to their death. In between, they receive fewer services, increasing the profitability of a long stay.
Varying the prospective per diem rates paid for hospice care to better reflect the “U-shaped” pattern of hospice services would reduce profit incentives in current payment policy that reward inappropriately long stays. At the same time, it would be more protective of hospices with shorter, more intensive stays. This change could better align payment to service costs and thereby reduce average profit margins and profit margin variation and, if accompanied by oversight, could improve quality of care. However, as in all prospective payment systems, the new arrangement would continue to reward efficient providers as well as those serving lower-need/lower-cost patients or delivering inadequate care. Excessive profit margins and profit margin variation may therefore continue.
Modify or Eliminate Special Provider Payments
The various payment systems under traditional Medicare include special payments and adjustments that either add to the total amount of payments made by Medicare or are made on a budget-neutral basis, meaning payments for some providers are reduced in order to increase payments to others. Some of these adjustments, such as special payments for low-volume or rural providers, are aimed at preserving access to services for certain beneficiaries. Others, such as local area wage or practice cost adjustments, recognize variation in provider costs. Still others, such as the inpatient medical education and disproportionate share hospital adjustments, provide a means for the Medicare program to support broader social goals.
Medicare currently classifies about 1,300 small, rural inpatient facilities as Critical Access Hospitals and pays them 101 percent of their Medicare reasonable costs. Another 385 hospitals, classified as sole community hospitals, are paid the higher of the normal inpatient payments or several different payment rates. A similar policy applies to about 200 other small rural hospitals termed Medicare-dependent because Medicare beneficiaries represent a high proportion of stays.
Eliminating or reducing some of these special payment rules and adjustments could lower Medicare expenditures.
OPTION 2.46
Reduce or eliminate special payments to rural hospitals
Special payments to rural providers could be modified in a number of ways. Payments to Critical Access Hospitals could be reduced to 100 percent of costs and qualifying criteria could be changed to reduce the number of hospitals paid higher rates (for example, by limiting designation to hospitals that do not have another hospital close by.) Alternatively, special rural hospital payment classifications could be eliminated entirely in favor of retargeting special payments to assist those hospitals with higher costs for reasons that are not otherwise recognized in the payment system.
Budget effects
The President’s FY 2013 budget proposals related to CAHs would save about $2 billion over 10 years (2013–2022)—$1.3 billion from reducing reimbursement to 100 percent of costs and $0.7 billion from prohibiting CAH designation for facilities less than 10 miles from another hospital. In 2011, CBO estimated that eliminating the Critical Access Hospital, Sole Community Hospital and Medicare-Dependent Hospital programs would reduce Medicare expenditures by $62 billion over 10 years (2012–2021).
Discussion
MedPAC has concluded that use of services and Medicare beneficiary satisfaction with access are similar in rural and urban areas. Modifying, eliminating, and retargeting special payments for rural and low-volume hospitals would arguably eliminate Medicare payments that are not needed to preserve access to care in rural areas.
Despite the potential benefits, if the extra payments are reduced or eliminated quickly or without a thorough analysis of the potential impacts, it could result in some hospitals closing or cutting back services in ways that are harmful to Medicare beneficiaries and others living in affected rural communities. Continuing cost-based reimbursement may prove the simplest payment system for some rural hospitals that offer limited inpatient services and have a widely fluctuating patient volume.
OPTION 2.47
Reduce or eliminate payments for Medicare bad debt
Medicare reimburses hospitals and skilled nursing facilities a portion (currently 65 percent) of the bad debt they incur when Medicare beneficiaries do not pay the cost sharing they owe for services received. Reducing bad debt payments was recommended by the Simpson-Bowles commission and proposed in President Obama’s budget for Fiscal Year 2013. A reduction from 70 percent to 65 percent beginning in 2013 was enacted in February 2012.
Budget effects
CBO estimated that the President’s FY 2013 budget proposal to phase down reimbursement of bad debt over three years to 25 percent would save $24 billion over 10 years (2013–2022). The Simpson-Bowles commission assumed a similar level of 10-year savings.
Discussion
Arguably, the Medicare program should not be expected to reimburse providers for unpaid beneficiary cost sharing, which is not a practice of private payers and may reduce provider incentives for collecting amounts owed by beneficiaries.11 Many Medicare beneficiaries purchase private Medigap coverage that covers most or all cost sharing obligations, and some have retiree health coverage that cover cost sharing. However, for lower income beneficiaries who do not qualify for Medicaid coverage and who cannot afford Medigap, Medicare cost sharing can be very expensive, especially for a hospital stay. Hospitals and skilled nursing facilities that tend to treat lower income patients can incur significant bad debt as a result. Moreover, for dual eligibles, state Medicaid programs have the option of limiting coverage for Medicare cost sharing to the amount that would be covered if the state’s Medicaid payment rate were in effect. As a result, providers are not always paid the cost sharing owed to them when Medicaid coverage is in effect, and these losses are counted as bad debt.
OPTION 2.48
Limit Medicare disproportionate share hospital payments to large urban hospitals
Medicare provides an add-on payment for inpatient services provided by hospitals serving a relatively high proportion of low-income patients. The payments are made using a series of formulas that vary based on urban and rural location and hospital size. The ACA reduces the DSH payments that would otherwise be made under these formulas by 75 percent beginning in 2015 and provides for a system of distributing some of the savings to hospitals with high levels of uncompensated care. This option would limit future DSH add-on payments to those hospitals for which there is a demonstrated relationship between higher costs and care for low-income patients, generally large urban hospitals.
Budget effects
No cost estimate is available for this option. In 2011, about 11 percent of DSH payments went to rural hospitals or hospitals in urban areas with fewer than 100 beds. Applying this proportion to CBO projections of DSH payments, 10-year savings would be approximately $13 billion.
Discussion
The aggregate reductions in DSH payments enacted under the ACA are consistent with empirical analyses conducted by MedPAC and others of the relationship between serving low-income patients and hospital costs. That analysis associates serving the poor with higher hospital costs even after other Medicare payment factors are taken into account, such as those recognizing the severity of patient illness, local area wages, and training of medical residents. However, the empirical finding is limited to hospitals located in urban areas with 100 beds or more. No similar cost effect is found for other hospitals. Therefore, continuing to provide DSH payments, even at the lower ACA levels, to small urban and rural hospitals arguably overcompensates them. The rationale for retaining these payments is that over time the DSH adjustment has evolved to reflect a broader notion of preserving access for low-income populations by assisting hospitals that serve them, regardless of whether there is an empirical finding of higher costs that result.
Reduce Geographic Variation in Medicare Spending
Medicare spending varies widely across geographic areas and at least a good share of these differences does not appear to be explained by Medicare reimbursement or other factors. The ACA put in place several reforms intended to reduce this variation. The Accountable Care Organization (ACO) program, for example, updates the target spending level during their initial three years of operation by the average increase in nationwide Medicare spending expressed in dollars, which has the effect of providing a larger percentage increase in lower spending geographic areas and a lower percentage increase in higher spending geographic areas. Additional options discussed here focus on areas with unusually high spending.
OPTION 2.49
Reduce Medicare’s fees for physicians and other providers in areas in high-spending regions
Medicare could attempt to achieve savings in high-spending regions by reducing provider payment rates for services in these areas. In 2008, CBO outlined how this might be implemented with respect to physician fees, payment rates for hospitals, and all Parts A and B services. These options are discussed below.
OPTION 2.49A
Reduce physician payments in areas with unusually high spending
Under this option, local spending on physician payments could be compared across regions that are defined on the basis of hospital service areas (HSAs). A spending target for physician payments could be developed for each region based on the number of Medicare beneficiaries, adjusted by health. CMS could calculate an annual local adjustment factor for each region based on comparing the local target with the local spending and apply the local adjustment factor to all physicians with a primary practice location in the region. Under this approach, CMS could phase in the local adjustment factor over five years. CMS could provide regular reports to state medical associations showing how it calculated the local adjustment factor and information on patterns of health care utilization.
OPTION 2.49B
Reduce hospital payments in areas with a high volume of elective admissions
Under this option, CMS could identify certain hospital admissions that are elective and could group these elective admissions into clinically related diagnosis and resource utilization groups. These elective admissions would account for at least 8 percent of current Medicare spending on short-stay hospital admissions. CMS could evaluate admission rates based on demographics for the local population and identify areas as having an unusually high volume of admissions for a specific group of elective admissions. The payment rate for high-volume elective admissions could be reduced based on comparison with the national average.
OPTION 2.49C
Reduce all Medicare payment rates in high-spending areas
Under this option, spending per beneficiary could be computed for each defined region of a state, adjusted to reflect the price of inputs and the health status of the local population, divided by the nationwide average spending per beneficiary. In areas where relative spending was 10 percent more than the national average, payment rates for all providers could be reduced. For example, a region spending 20 percent above the national average would experience reductions in Medicare payment rates amounting to 5 percent. As with the other proposals, the reduction in payment rates could be phased in over five years and capped at 20 percent. A variation in this option would be to only apply the reduction to specific services with high-spending instead of to all services in a high spending area.
Budget effects
No recent cost estimates are available for these options. In 2008 (prior to enactment of the ACA), CBO estimated spending reductions of approximately $5 billion for Option 2.49a (the physician payment option), $3 billion for Option 2.49b (the hospital elective admission option), and $51 billion for Option 2.49c (reducing Medicare payments across-the-board in high spending regions) over 10 years (2010–2019).
Discussion
It generally is agreed that there is some level of unnecessary variation in Medicare spending that, if reduced, could save a substantial amount of money. A recent analysis of 12 hospital referral regions showed significant geographic variation in Medicare spending, averaging $10,145 per beneficiary in Miami, Florida, compared with $4,959 in Honolulu, Hawaii. However, reductions in payments based on geography is certain to create large numbers of “losers” and engender considerable opposition and debate. Such changes also could result in reduced health outcomes for beneficiaries in areas that received lower payments. The Department of Health and Human Services has commissioned a study by the IOM; the IOM Committee on Geographic Variation in Health Care Spending and Promotion of High-Value Care is reviewing a comprehensive range of factors associated with geographic variation, and is expected to report in the first half of 2013.
References
Click to expand/collapse
Jonathan Blum. 2012. Centers for Medicare & Medicaid Services, Letter to Glenn M. Hackbarth, Chairman, Medicare Payment Advisory Commission. March 6, 2012.
Centers for Medicare & Medicaid Services (CMS). 2005. “Medicare Program; Application of Inherent Reasonableness Payment Policy to Medicare Part B Services (Other Than Physician Services), Final Rule,” Federal Register Vol. 70, No. 238, December 13, 2005.
Centers for Medicare & Medicaid Services. (CMS). 2012a, ”Clinical Laboratory Fee Schedule, Payment System Fact Sheet Series,” January 2012.
Centers for Medicare & Medicaid Services (CMS). 2012b. Competitive Bidding Update—One Year Implementation Update, April 17, 2012.
Centers for Medicare & Medicaid Services. (CMS). 2012c. “Medicare Program: Payment Policies Under the Physician Fee Schedule, DME Face-to-Face Encounters, Elimination of the Requirement for Termination of Non-Random Prepayment Complex Medical Review and Other Revisions to Part B for CY 2013,” Federal Register, November 16, 2012.
Centers for Medicare & Medicaid Services (CMS). 2012d. “Medicare Program; Public Meeting Regarding Inherent Reasonableness of Medicare Fee Schedule Amounts for Non-Mail Order (Retail) Diabetic Testing Supplies, Notice of Meeting,” Federal Register Vol. 77, No. 123, June 26, 2012.
Congressional Budget Office (CBO). 2008. Health Care Options, “Geographic Variation in Spending for Medicare,” December 2008.
Congressional Budget Office (CBO). 2011. Reducing the Deficit: Spending and Revenue Options, March 2011.
Congressional Budget Office (CBO). 2012a. Estimate of the Effects of Medicare, Medicaid, and Other Mandatory Health Provisions Included in the President’s Budget Request for Fiscal Year 2013, March 2012.
Congressional Budget Office (CBO). 2012b. Medicare Baseline, March 2012.
Congressional Budget Office (CBO). 2012c. Medicare’s Payments to Physicians: The Budgetary Impact of Alternative Policies Relative to CBO’s March 2012 Baseline, July 2012.
Robert F. Coulam, Roger D. Feldman, and Bryan E. Dowd. 2011. “Competitive Pricing and the Challenge of Cost Control in Medicare,” Journal of Health Politics, Policy and Law, August 2011.
Ezekiel Emanuel et al., Center for American Progress. 2012. “A Systemic Approach to Containing Health Care Spending,” New England Journal of Medicine, August 1, 2012.
Government Accountability Office (GAO). 2009. Medicare Physician Payments: Fees Could Better Reflect Efficiencies Achieved When Services are Provided Together, July 31, 2009.
Government Accountability Office (GAO). 2011. Medicare: Issues for Manufacturer-Level Competitive Bidding for Durable Medical Equipment, May 31, 2011.
HHS Office of Inspector General. 2012. Department of Health and Human Services, 2012, Comparison of Fourth-Quarter 2011 Average Sales Prices and Average Manufacturer Prices: Impact on Medicare Reimbursement for Second Quarter 2012, August 2012.
Institute of Medicine, Committee on the Future Health Care Workforce for Older Americans. 2008. Retooling for an Aging America: Building the Health Care Workforce, 2008.
H. Joanna Jiang, Lauren M. Wier, D.E.B. Potter, and Jacqueline Burgess. 2010. “Hospitalizations for Potentially Preventable Conditions among Medicare-Medicaid Dual-Eligibles, 2008,” Statistical Brief #96, Agency for Healthcare Research and Quality, Healthcare Cost and Utilization Project, September 2010.
Letter from 166 Concerned Auction Experts on Medicare Competitive Bidding Program to the Honorable Pete Stark, Chairman, Subcommittee on Health, Committee on Ways and Means, (Letter to Pete Stark), September 26, 2010.
L&M Policy Research LLC. 2011. Evaluation of Practice Models for Dual Eligibles and Medicare Beneficiaries with Serious Chronic Conditions. 2011. Report Prepared for CMS, July 25, 2011.
Mark Loeb et al. 2006. “Effect of a Clinical Pathway to Reduce Hospitalizations in Nursing Home Residents With Pneumonia,” Journal of the American Medical Association, June 7, 2006.
Medicare Payment Advisory Commission (MedPAC). 2008. Report to the Congress: Medicare and the Health Care Delivery System, March 2008
Medicare Payment Advisory Commission (MedPAC). 2009. Report to the Congress: Medicare Payment Policy, March 2009.
Medicare Payment Advisory Commission (MedPAC). 2010a. Letter to Congress, August 23, 2010.
Medicare Payment Advisory Commission (MedPAC). 2010b. Report to the Congress: Aligning Incentives in Medicare, June 2010.
Medicare Payment Advisory Commission (MedPAC). 2010c. Report to the Congress: Medicare Payment Policy, March 2010.
Medicare Payment Advisory Commission (MedPAC). 2011a. Report to the Congress: Medicare and the Health Care Delivery System. June 2011.
Medicare Payment Advisory Commission (MedPAC). 2011b. Report to the Congress: Regional Variation In Medicare Service Use, January 2011.
Medicare Payment Advisory Commission (MedPAC). 2012a.Clinical Laboratory Services Payment System, October 2012.
Medicare Payment Advisory Commission (MedPAC). 2012b. A Data Book: Health Care Spending and the Medicare Program, June 2012.
Medicare Payment Advisory Commission (MedPAC). 2012c. Letter to Congress, “Moving Forward from the Sustainable Growth Rate (SGR) System” (dated October 14, 2011); cited in Report to the Congress: Medicare Payment Policy, March 2012.
Medicare Payment Advisory Commission (MedPAC). 2012d. Report to the Congress: Medicare and the Health Care Delivery System, June 2012.
Medicare Payment Advisory Commission (MedPAC). 2012e. Report to the Congress: Medicare Payment Policy, March 2012.
National Commission on Fiscal Responsibility and Reform. 2010. The Moment of Truth: Report of the National Commission on Fiscal Responsibility and Reform, December 2010.
Nguyen Xuan Nguyen and Steven H. Sheingold. 2011. “Indirect Medical Education and Disproportionate Share Adjustments to Medicare Inpatient Payment Rates,” Medicare and Medicaid Research Review, 2011.
Frank Opelka. 2012. “Medicare Physician Payments: Perspectives from Physicians.” Statement before the Senate Finance Committee, July 2012.
Joseph G. Ouslander and Robert M. Berenson. 2011. “Reducing Unnecessary Hospitalizations of Nursing Home Residents,” New England Journal of Medicine, September 29, 2011.
Senate Finance Committee. 2012. “Summary of The
Middle Class Tax Relief and Job Creation Act of 2012,” February 16, 2012.
Laurence D. Wilson, Director, Chronic Care Policy Group, Centers for Medicare & Medicaid Services. 2012. Statement Before the House Committee on Ways and Means, Subcommittee on Health, May 9, 2012.
U.S. Department of Health and Human Services, Report to Congress: Plan to Implement a Medicare Skilled Nursing Facility Value-Based Purchasing Program (publication not dated).
Medical Malpractice
Options Reviewed
This section discusses options in two categories relating to medical malpractice, using labels assigned to them in a 2010 study commissioned by the Medicare Payment Advisory Commission (MedPAC) (Mello and Kachalia 2010):
» Adopt “traditional” tort reforms at the Federal level
» Adopt more “innovative” tort reforms
While medical malpractice is not exclusively or primarily a Medicare issue and policy debates in this area do not typically focus on Medicare as a driver of change, medical malpractice-related policy changes have the potential to reduce Medicare expenditures. There continues to be considerable interest in finding ways to reduce medical malpractice insurance premiums paid by doctors and other health care providers, along with the costs associated with unnecessary defensive medical practices, as a means of reducing health expenditures under Medicare and other public and private programs
Background
The current system for adjudicating medical malpractice claims, which involves civil suits typically in State courts, often has been criticized. Research indicates that relatively few patients who are injured by negligence file claims; only about half of claimants recover money; and the outcome of litigation is sometimes unrelated to the merit of the claim (Kachalia and Mello 2011). Evidence on other key issues related to medical malpractice, such as the extent and cost of defense medicine that might result from efforts to avoid malpractice claims, the impact of alternative reform proposals, and potential savings from malpractice reform is often lacking or contradictory. Therefore, it is not surprising that malpractice reforms often engender considerable controversy and sharp differences of opinion.
The National Commission on Fiscal Responsibility and Reform (Simpson-Bowles commission) included malpractice reforms in its comprehensive proposal to reduce the Federal budget deficit (National Commission on Fiscal Responsibility and Reform 2010). Several bills have been introduced in Congress but, so far, none has been enacted. The Agency for Healthcare Research and Quality (AHRQ) is funding a series of demonstration projects to test various reform models (AHRQ 2012) and President Obama’s Fiscal Year 2013 budget included funding to provide grants to States to test various models of reform.
A 2010 study done for MedPAC examined eight “traditional” tort reforms and six “more innovative” ones (Mello and Kachalia 2010). For each reform, the study identified key design features and decisions and evaluated the available evidence for its effects on a range of variables, including health care providers’ medical malpractice premiums and defensive medicine.
Policy Options
OPTION 2.50
Adopt traditional tort reforms at the Federal level
Tort reforms affect some aspect of the process for filing and adjudicating malpractice claims, including the payment of damages and other fees when such claims are successful. Although medical malpractice litigation typically has been handled as a State issue, Congress arguably has the power, under the Commerce Clause of the U.S. Constitution, to enact Federal tort reform laws. (Exhibit 2.8) briefly describes eight traditional tort reforms.
Each of these reforms could involve many design variations. For example, for caps on noneconomic damages, the amount of the cap could vary for different kinds of injuries, the cap might or might not be indexed over time for inflation, and the cap might or might not be subject to judicial waiver.
The Simpson-Bowles commission included in its deficit reduction plan a package of tort reforms, including modifying the collateral source rule, imposing a statute of limitations on medical malpractice lawsuits, replacing joint-and-several liability with a fair share rule, creating “health courts,” and adopting “safe haven” rules for providers who follow best practices of care.
Another recent example of the traditional tort reform approach is provided by the Help Efficient, Accessible, Low-Cost, Timely Healthcare (HEALTH) Act (H.R. 5), which was approved by the House of Representatives in March 2012. As introduced, H.R. 5 included the following provisions:
» A three-year statute of limitations for medical malpractice claims, with certain exceptions, from the date of discovery of an injury;
» A cap of $250,000 on awards for noneconomic damages;
» A cap on awards for punitive damages that would be the larger of $250,000 or twice the economic damages, and restrictions on when punitive damages may be awarded;
» Replacement of joint-and-several liability with a fair-share rule, under which a defendant in a lawsuit would be liable only for the percentage of the final award that was equal to his or her share of responsibility for the injury;
» Sliding-scale limits on the contingency fees that lawyers can charge;
» Authorization for periodic payments of future damage awards of $50,000 or more;
» A safe harbor from punitive damages for products that meet applicable FDA safety requirements; and
» Permission to introduce evidence of income from collateral sources (such as life insurance payouts and health insurance) at trial (this last element was deleted from the version of the bill reported by the House Committee on the Judiciary and subsequently passed by the House of Representatives).
The bill would not preempt state laws that are more protective of providers and organizations with respect to liability, loss, or damages, nor would it preempt any state law that specified a particular monetary limit on economic, noneconomic, or punitive damages, whether such limit was higher or lower than the comparable one specified in the bill.
Budget effects
CBO has estimated that the tort reforms in H.R. 5 would produce a roughly 0.5 percent decrease in overall health spending and a reduction in the Federal budget deficit of $40 billion to $57 billion over a 10-year period (2012–2021); the range of estimates arises from the fact that one Congressional committee reported a version of H.R. 5 lacking the collateral source provision, as noted above. This estimated impact on the deficit combines an estimated $34 billion to $48 billion in reduced spending under Medicare, Medicaid, the State Children’s Health Insurance Program, and the Federal Employees Health Benefits Program over a 10-year period, and a $6 billion to $10 billion increase in Federal revenues (because employers would pay less for health insurance for employees, meaning that more of their employees’ compensation would be in the form of taxable wages). CBO notes that its savings estimates for Medicare are greater, in percentage terms, than for other programs or national health spending in general because empirical evidence shows that the impact of tort reform on the utilization of health care services is greater for Medicare than for the rest of the health care system. By comparison, the Simpson-Bowles commission’s package of tort reforms was estimated to produce Federal savings of $2 billion in 2015 and $17 billion through 2020; the commission did not estimate Medicare savings separately.
Discussion
Tort reforms typically are intended to reduce the number of frivolous law suits and the total size of awards, thereby reducing malpractice insurance premiums and the amount of defensive medicine. A report done for MedPAC found that caps on noneconomic damages appear to moderately constrain the growth of malpractice premiums over time and lower the rate of defensive medicine, but the report also says that the available evidence underlying these conclusions is imperfect. For the remaining tort reforms, the report generally concludes that evidence regarding their impact on malpractice premiums and defensive medicine is limited, equivocal, or non-existent, or even suggests that they have no significant impact on these variables.
Critics of caps on noneconomic damages worry they could limit awards for seriously injured patients or disadvantage older people or others receiving relatively low economic damage awards. Similarly, limits on attorneys’ contingency fees could make it difficult for some patients to obtain legal representation. CBO also has noted that imposing caps on noneconomic damages might have a negative impact on health outcomes, but concluded that the evidence for such negative effects is less clear than the evidence regarding expected reductions in health care costs. And other research has found that physicians’ concern about being sued was modestly lower in states that had established caps on total damages (not just noneconomic damages) or abolished joint-and-several liability, but was not significantly affected by the other reforms, including caps on noneconomic damages.
OPTION 2.51
Adopt more innovative tort reforms
In addition to “traditional” tort reforms, a range of other “innovative” malpractice reforms have been proposed and are briefly described in (Exhibit 2.9). Each of the reforms could encompass a wide range of variants.
Budget effects
No cost estimates are available for these options.
Discussion
Most of the above reforms have no real-world examples, have undergone only limited trials, or have not been rigorously evaluated. Administrative systems are in place in countries such as Denmark, New Zealand and Sweden. The few administrative systems currently in place in the United States—Florida’s Birth-Related Neurological Injury Compensation Plan, Virginia’s Birth-Related Neurological Injury Compensation Program, and the U.S. National Vaccine Injury Compensation Program—serve limited purposes. While such administrative systems do reduce overhead costs by making it easier to pursue a malpractice claim, they could increase the total number of claims (claim rates per million persons are about four to five times higher in Denmark, New Zealand, and Sweden than they are in the United States), and they also could have uncertain impacts on total malpractice costs and defensive medicine. On the other hand, by increasing the number of claims, they could allow creation of a rich database of medical injuries and contributing factors, thereby facilitating patient safety efforts. Four states—Florida, Maine, Minnesota, and Vermont—experimented with practice guideline-related safe harbors, but none has adopted these policies on a permanent basis. The 2010 study done for MedPAC concludes that the evidence base underlying the above reforms is “extremely small” but that most of the reforms “show sufficient promise…to merit controlled experimentation.” As noted earlier, the Agency for Healthcare Research and Quality is currently funding demonstrations of several of these concepts.
References
Click to expand/collapse
Agency for Healthcare Research and Quality (AHRQ). 2012. Medical Liability Reform and Patient Safety Demonstration Grants Fact Sheet.
Randall Bovbjerg and Robert A. Berenson. 2012. The Value of Clinical Practice Guidelines as Malpractice ‘Safe Harbors’, Robert Wood Johnson Foundation Issue Brief, April 2012.
Emily Carrier et al. 2010. “Physicians’ Fears of Malpractice Lawsuits Are Not Assuaged By Tort Reforms,” Health Affairs, September 2010.
Congressional Budget Office (CBO). 2009. Letter to the Honorable Orrin G. Hatch regarding the effects of proposals to limit costs related to medical malpractice, October 9, 2009.
Congressional Budget Office (CBO). 2011. Cost Estimates, H.R. 5, Health Efficient, Accessible, Low-cost, Timely Healthcare (HEALTH) Act of 2011, March 10, 2011 and May 23, 2011.
Allen Kachalia and Michelle M. Mello. 2011. “New Directions in Medical Liability Reform,” New England Journal of Medicine, April 21, 2011.
Michelle Mello and Allen Kachalia. 2010. Evaluation of Options for Medical Malpractice System Reform; A Study Conducted for the Medicare Payment Advisory Commission, April 2010.
National Commission on Fiscal Responsibility and Reform. 2010. The Moment of Truth: Report of the National Commission on Fiscal Responsibility and Reform, December 2010.

Exhibit 2.1: Total Medicare Private Health Plan Enrollment, 2000–2012
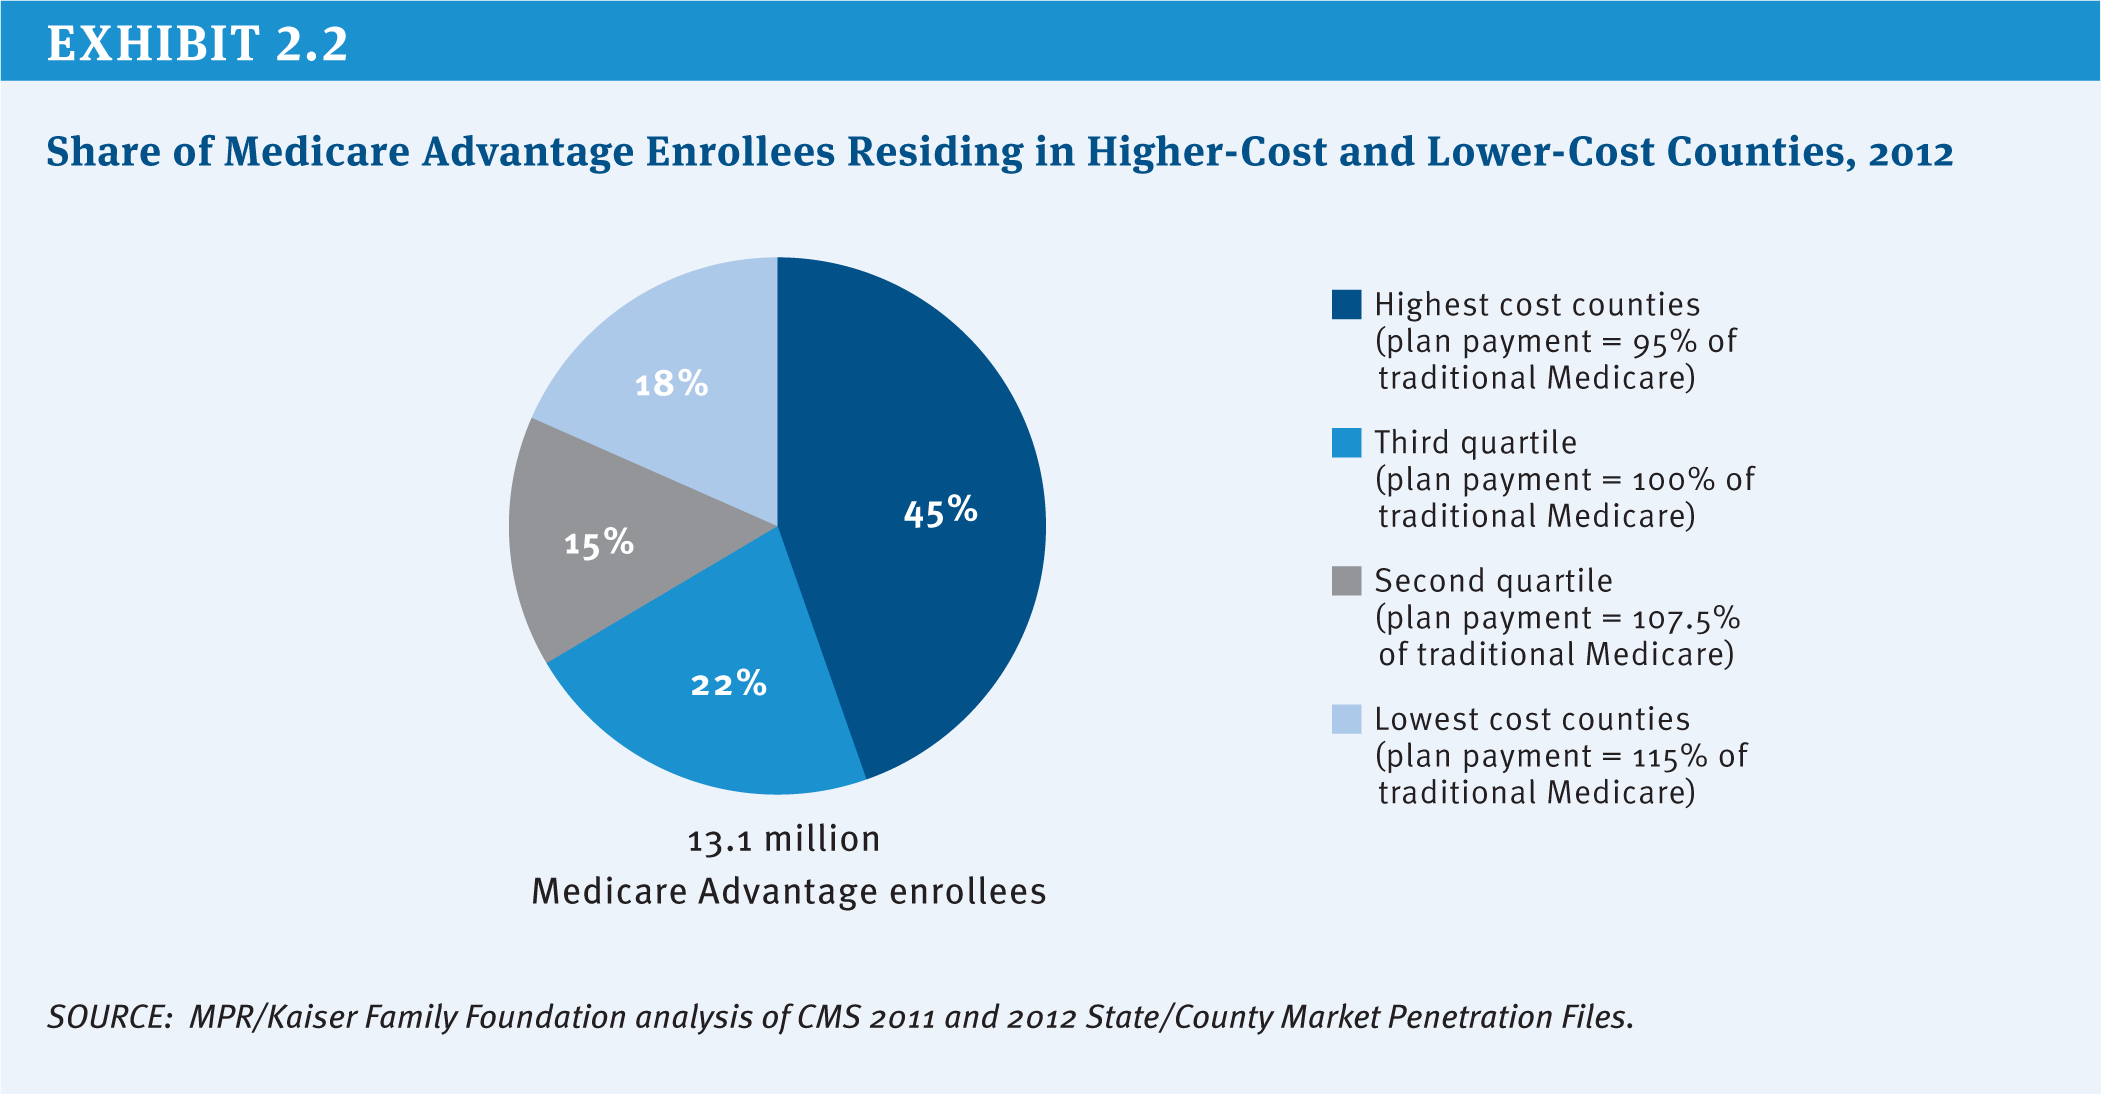
Exhibit 2.2: Share of Medicare Advantage Enrollees Residing in Higher-Cost and Lower-Cost Counties, 2012
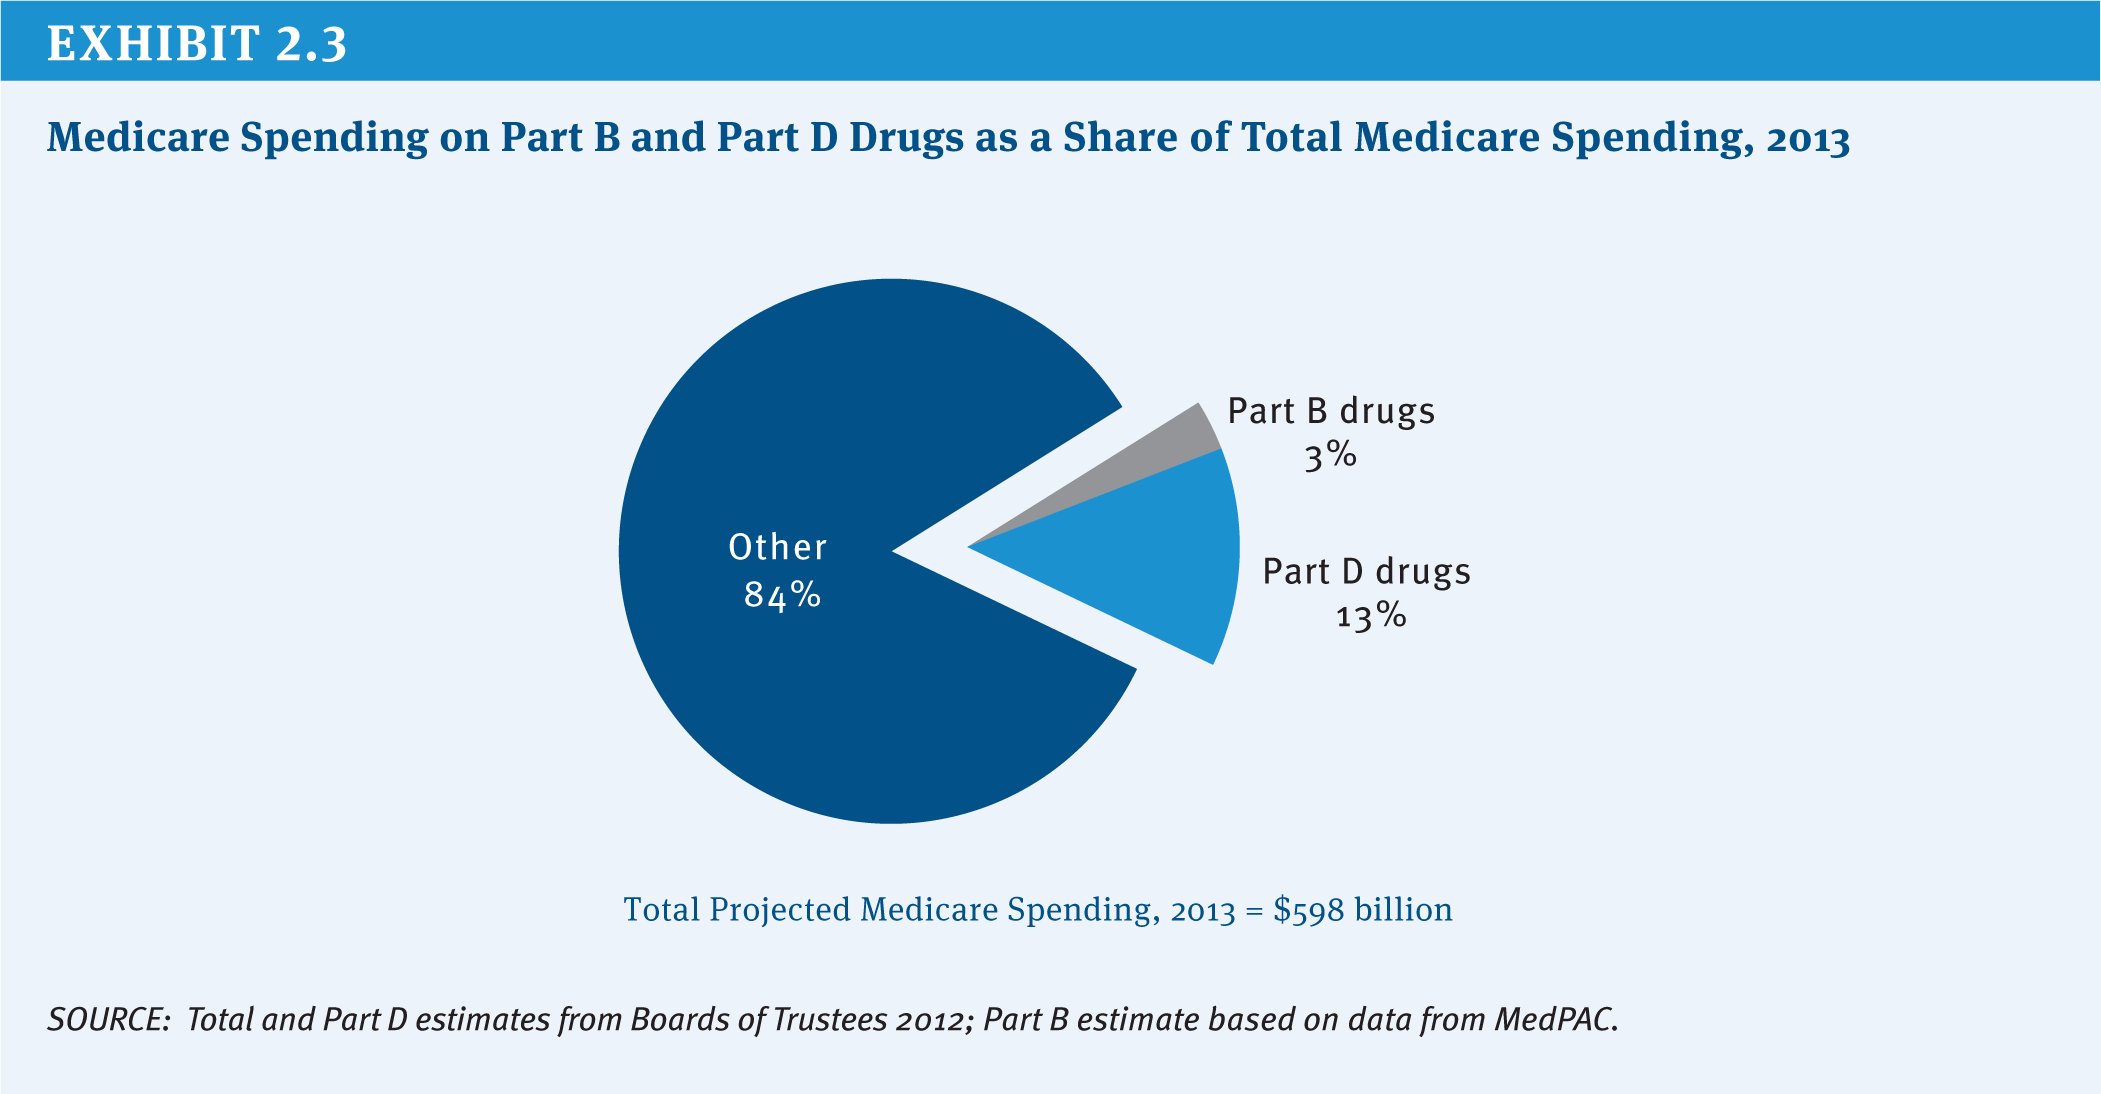
Exhibit 2.3: Medicare Spending on Part B and Part D Drugs as a Share of Total Medicare Spending, 2013
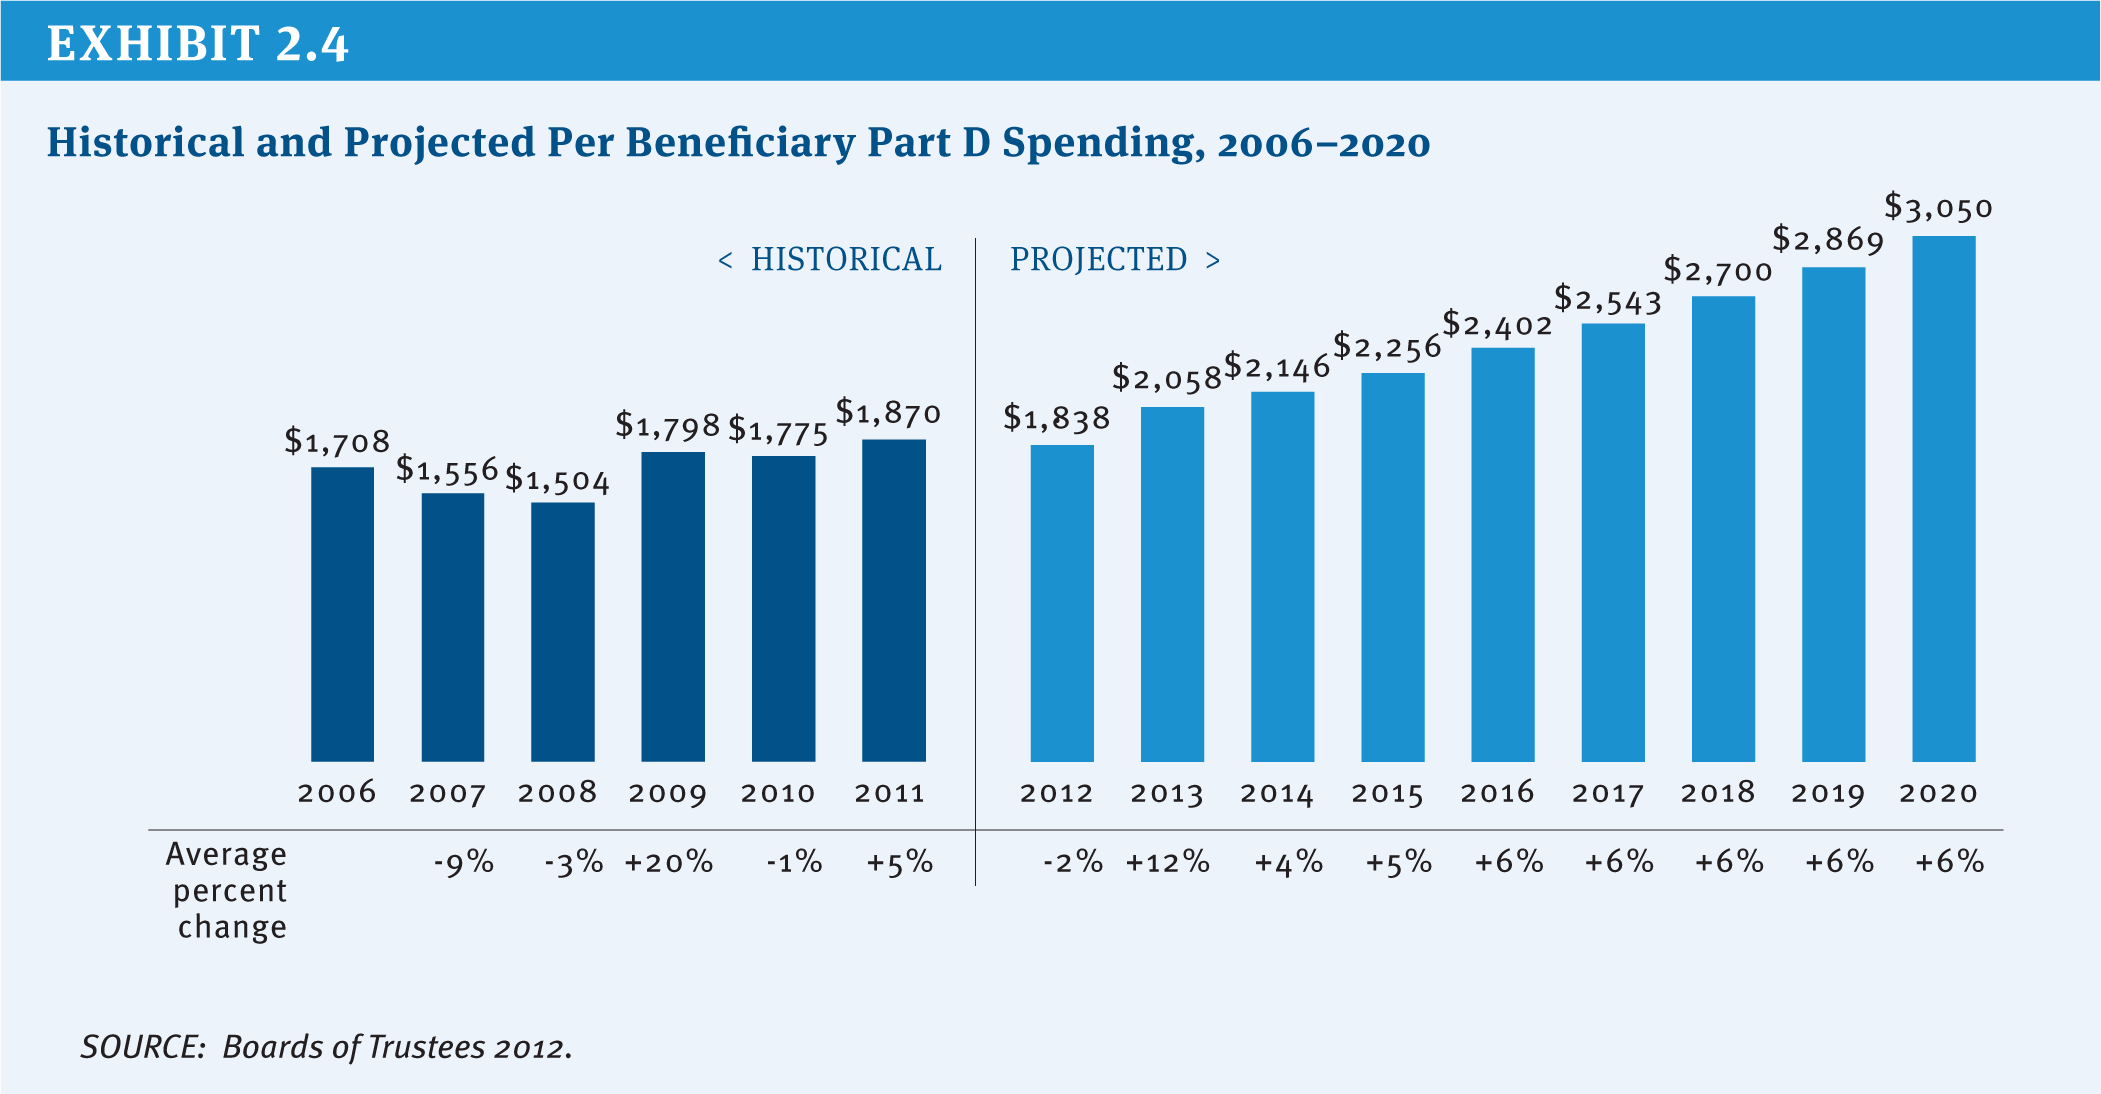
Exhibit 2.4: Historical and Projected Per Beneficiary Part D Spending, 2006–2020
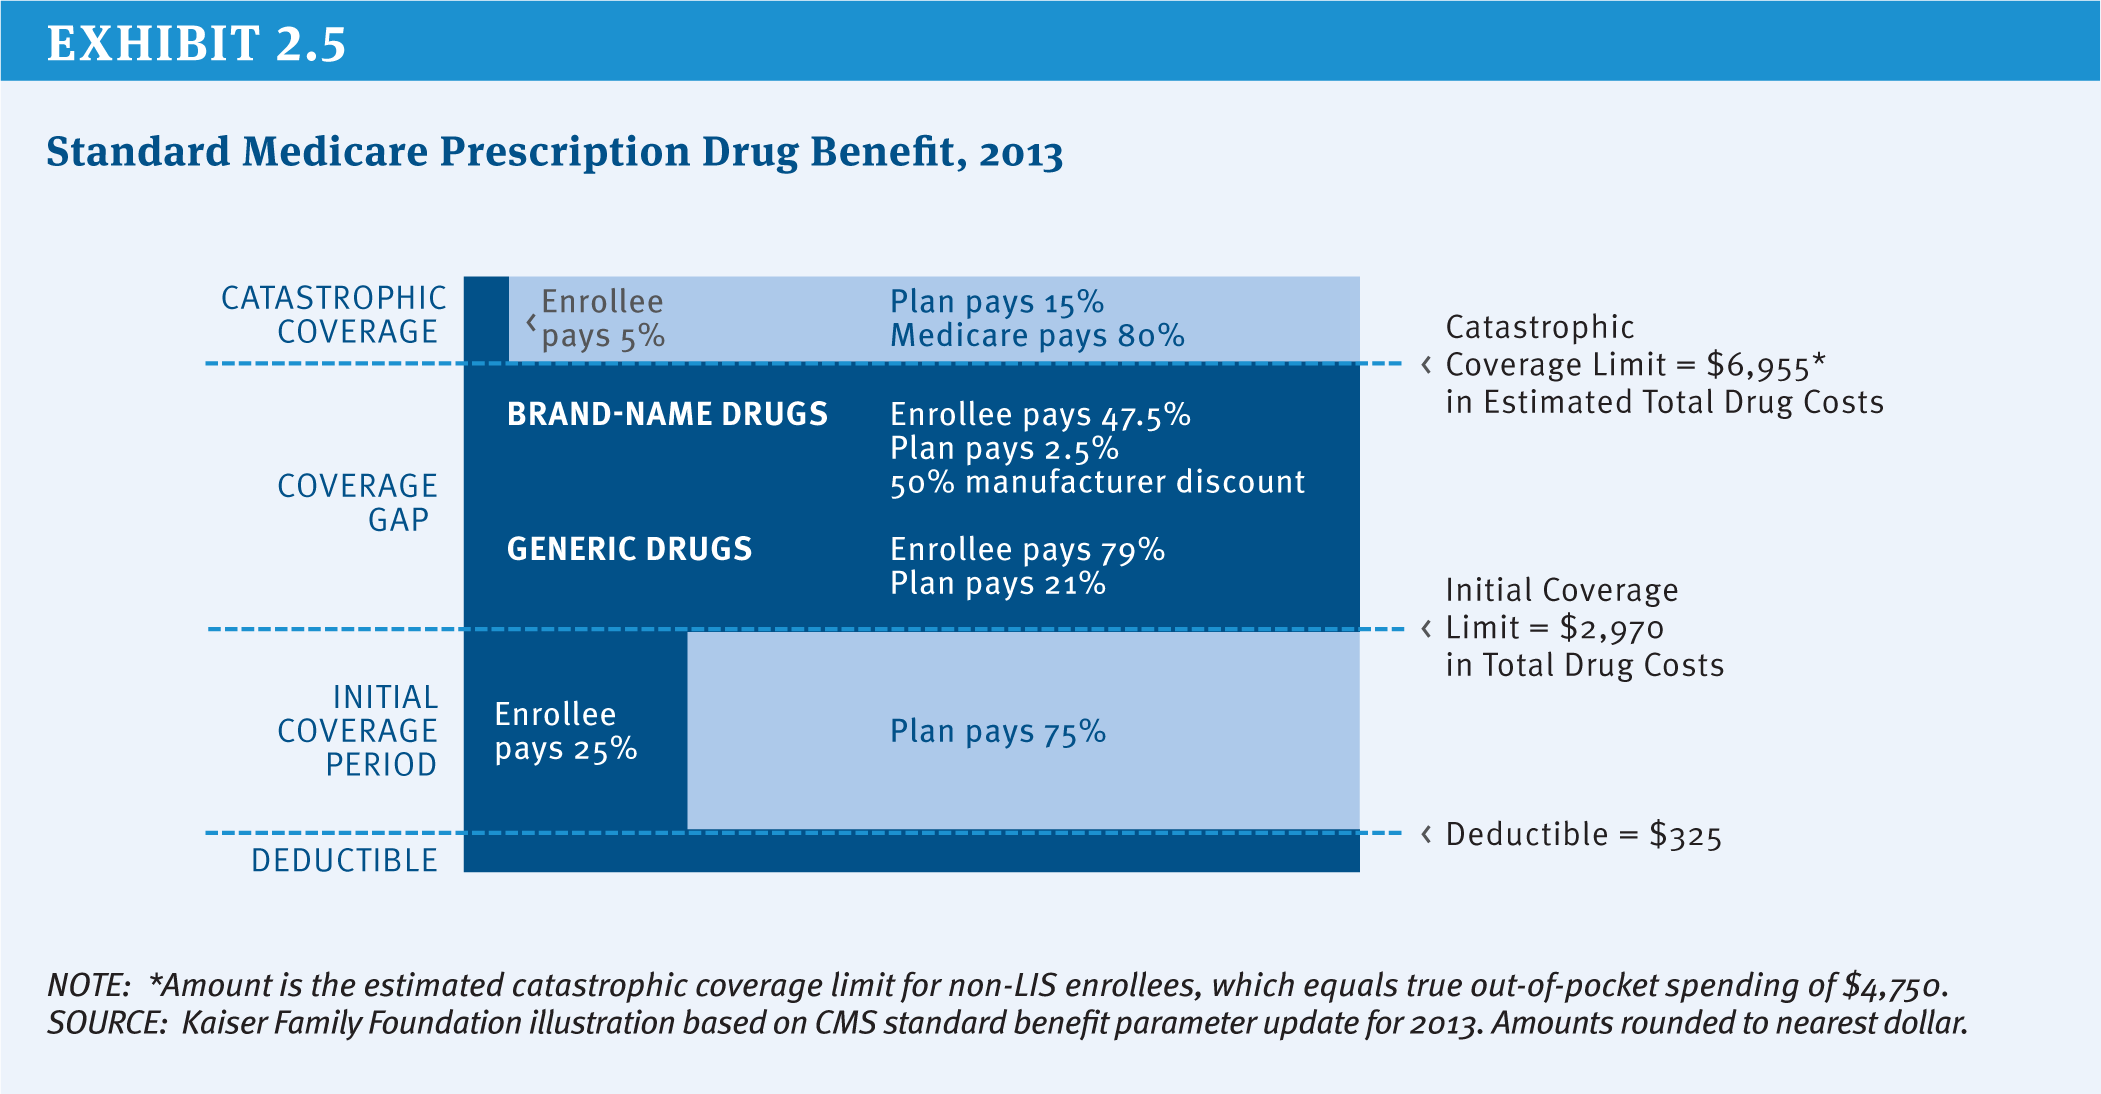
Exhibit 2.5: Standard Medicare Prescription Drug Benefit, 2013
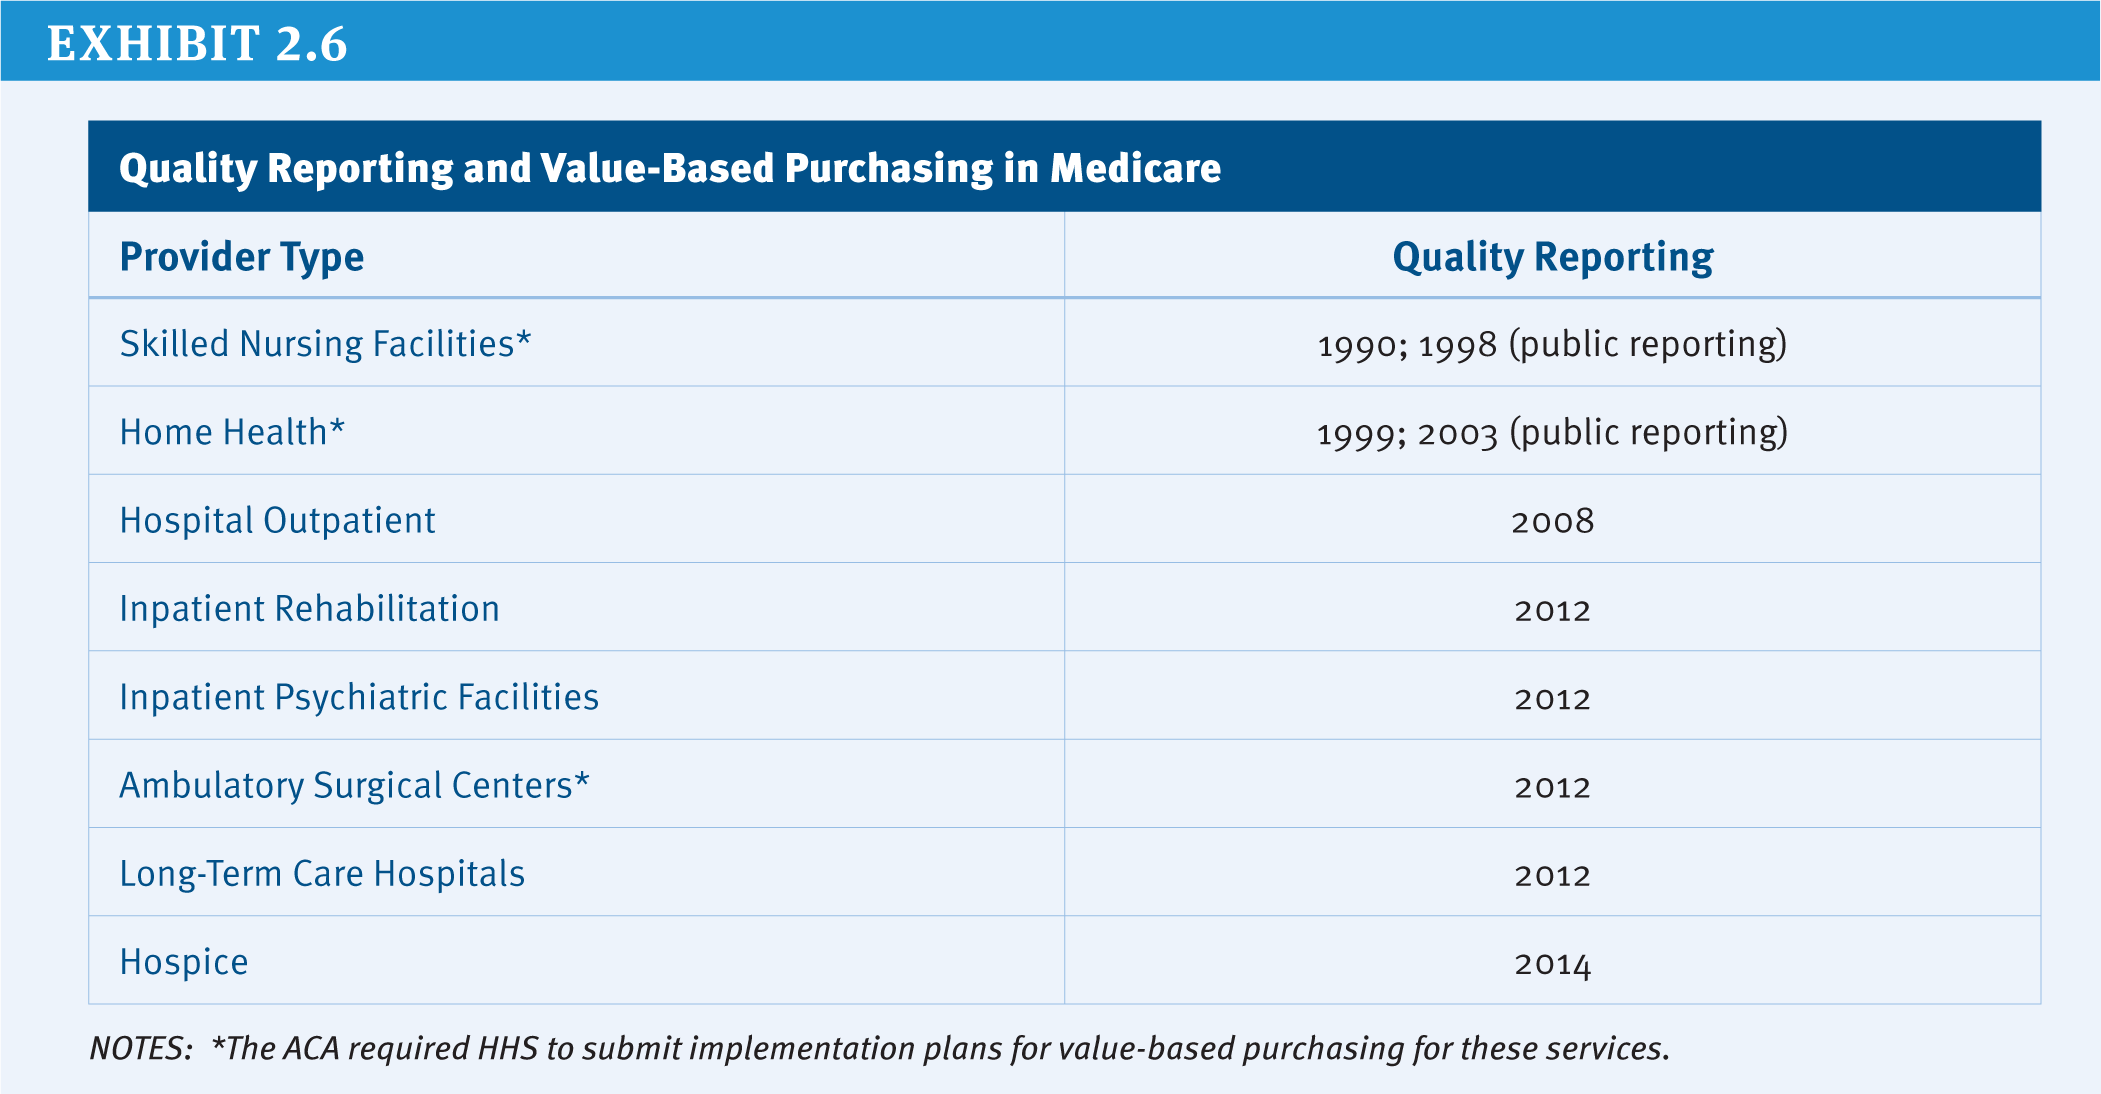
Exhibit 2.6: Quality Reporting and Value-Based Purchasing in Medicare
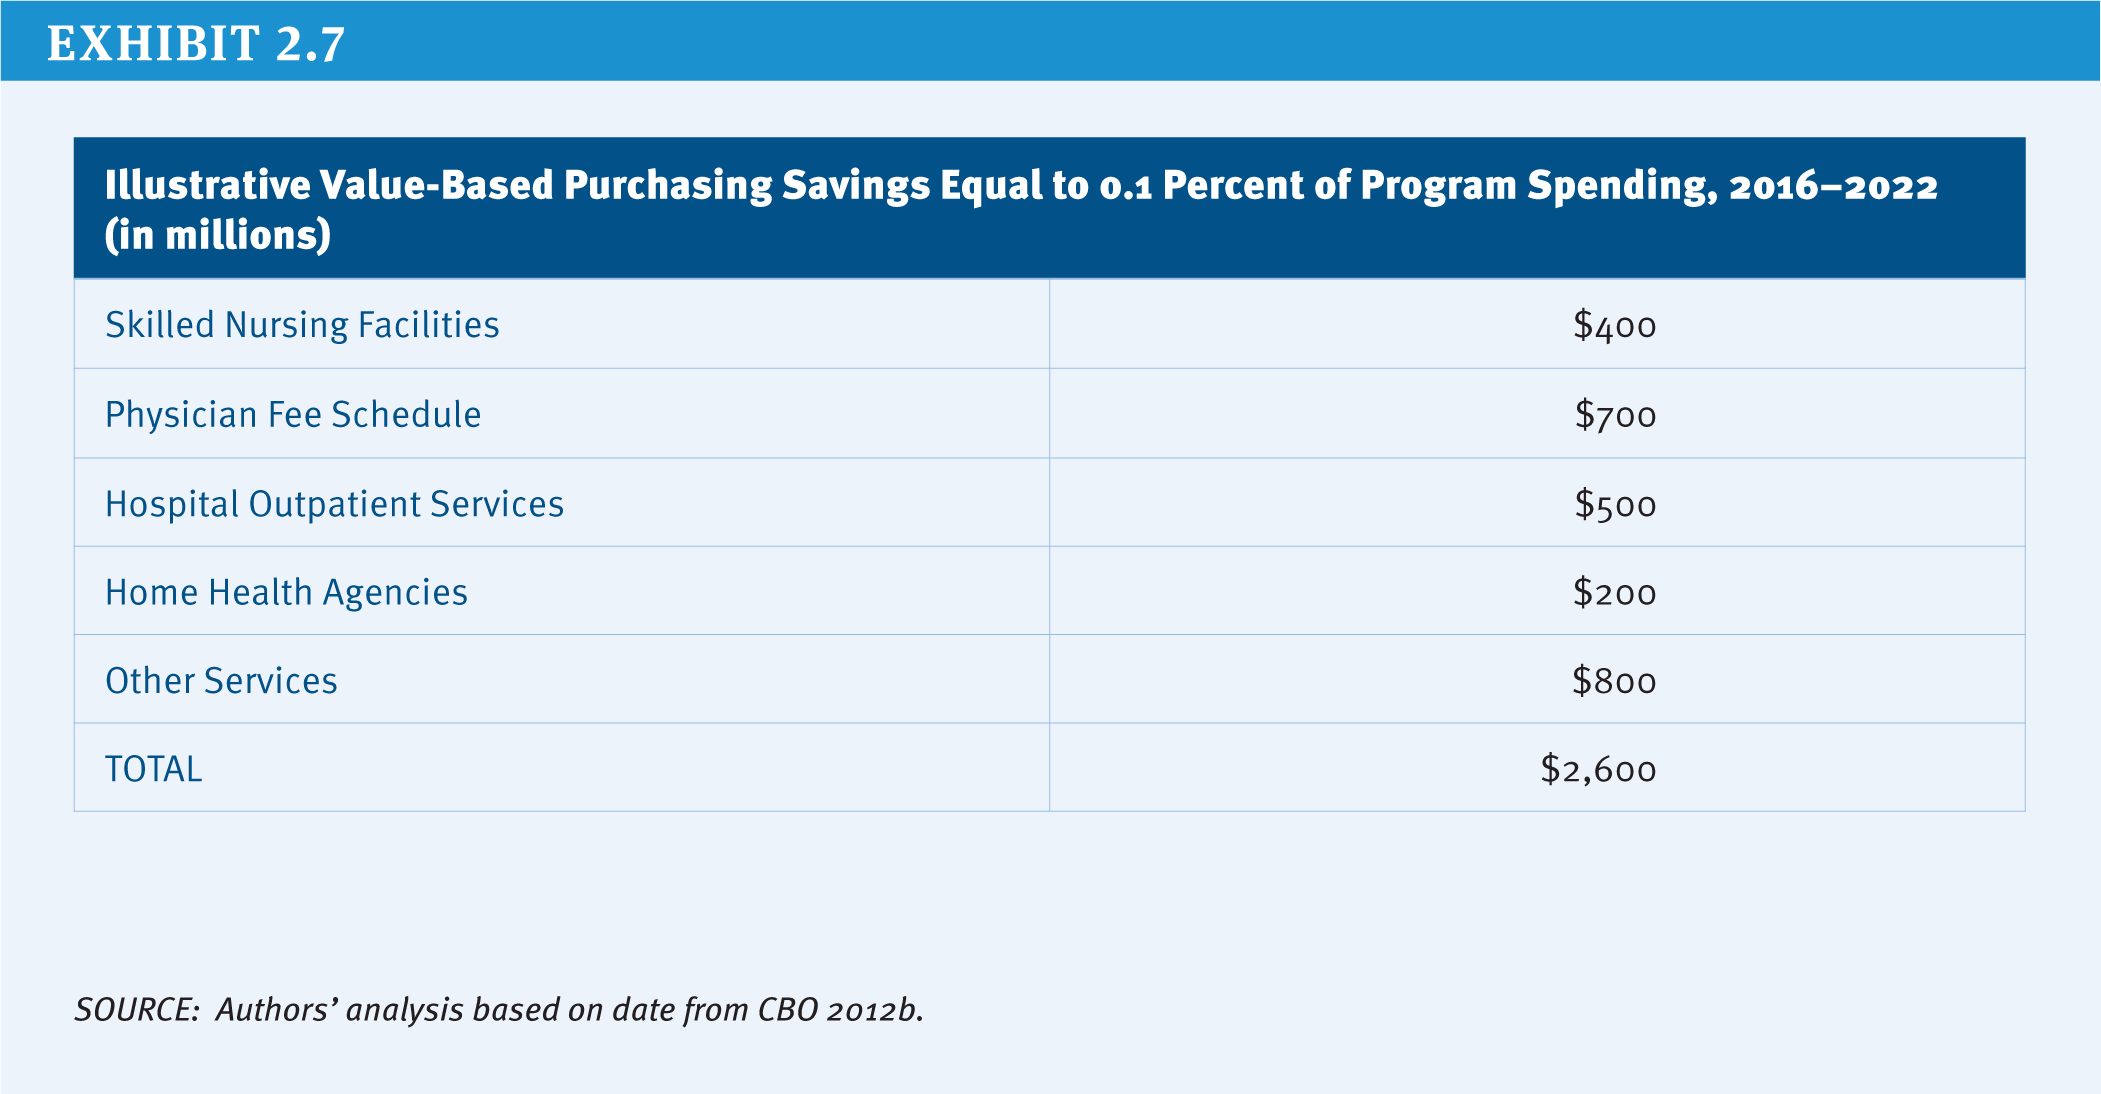
Exhibit 2.7: Illustrative Value-Based Purchasing Savings Equal to 0.1 Percent of Program Spending, 2016–2022
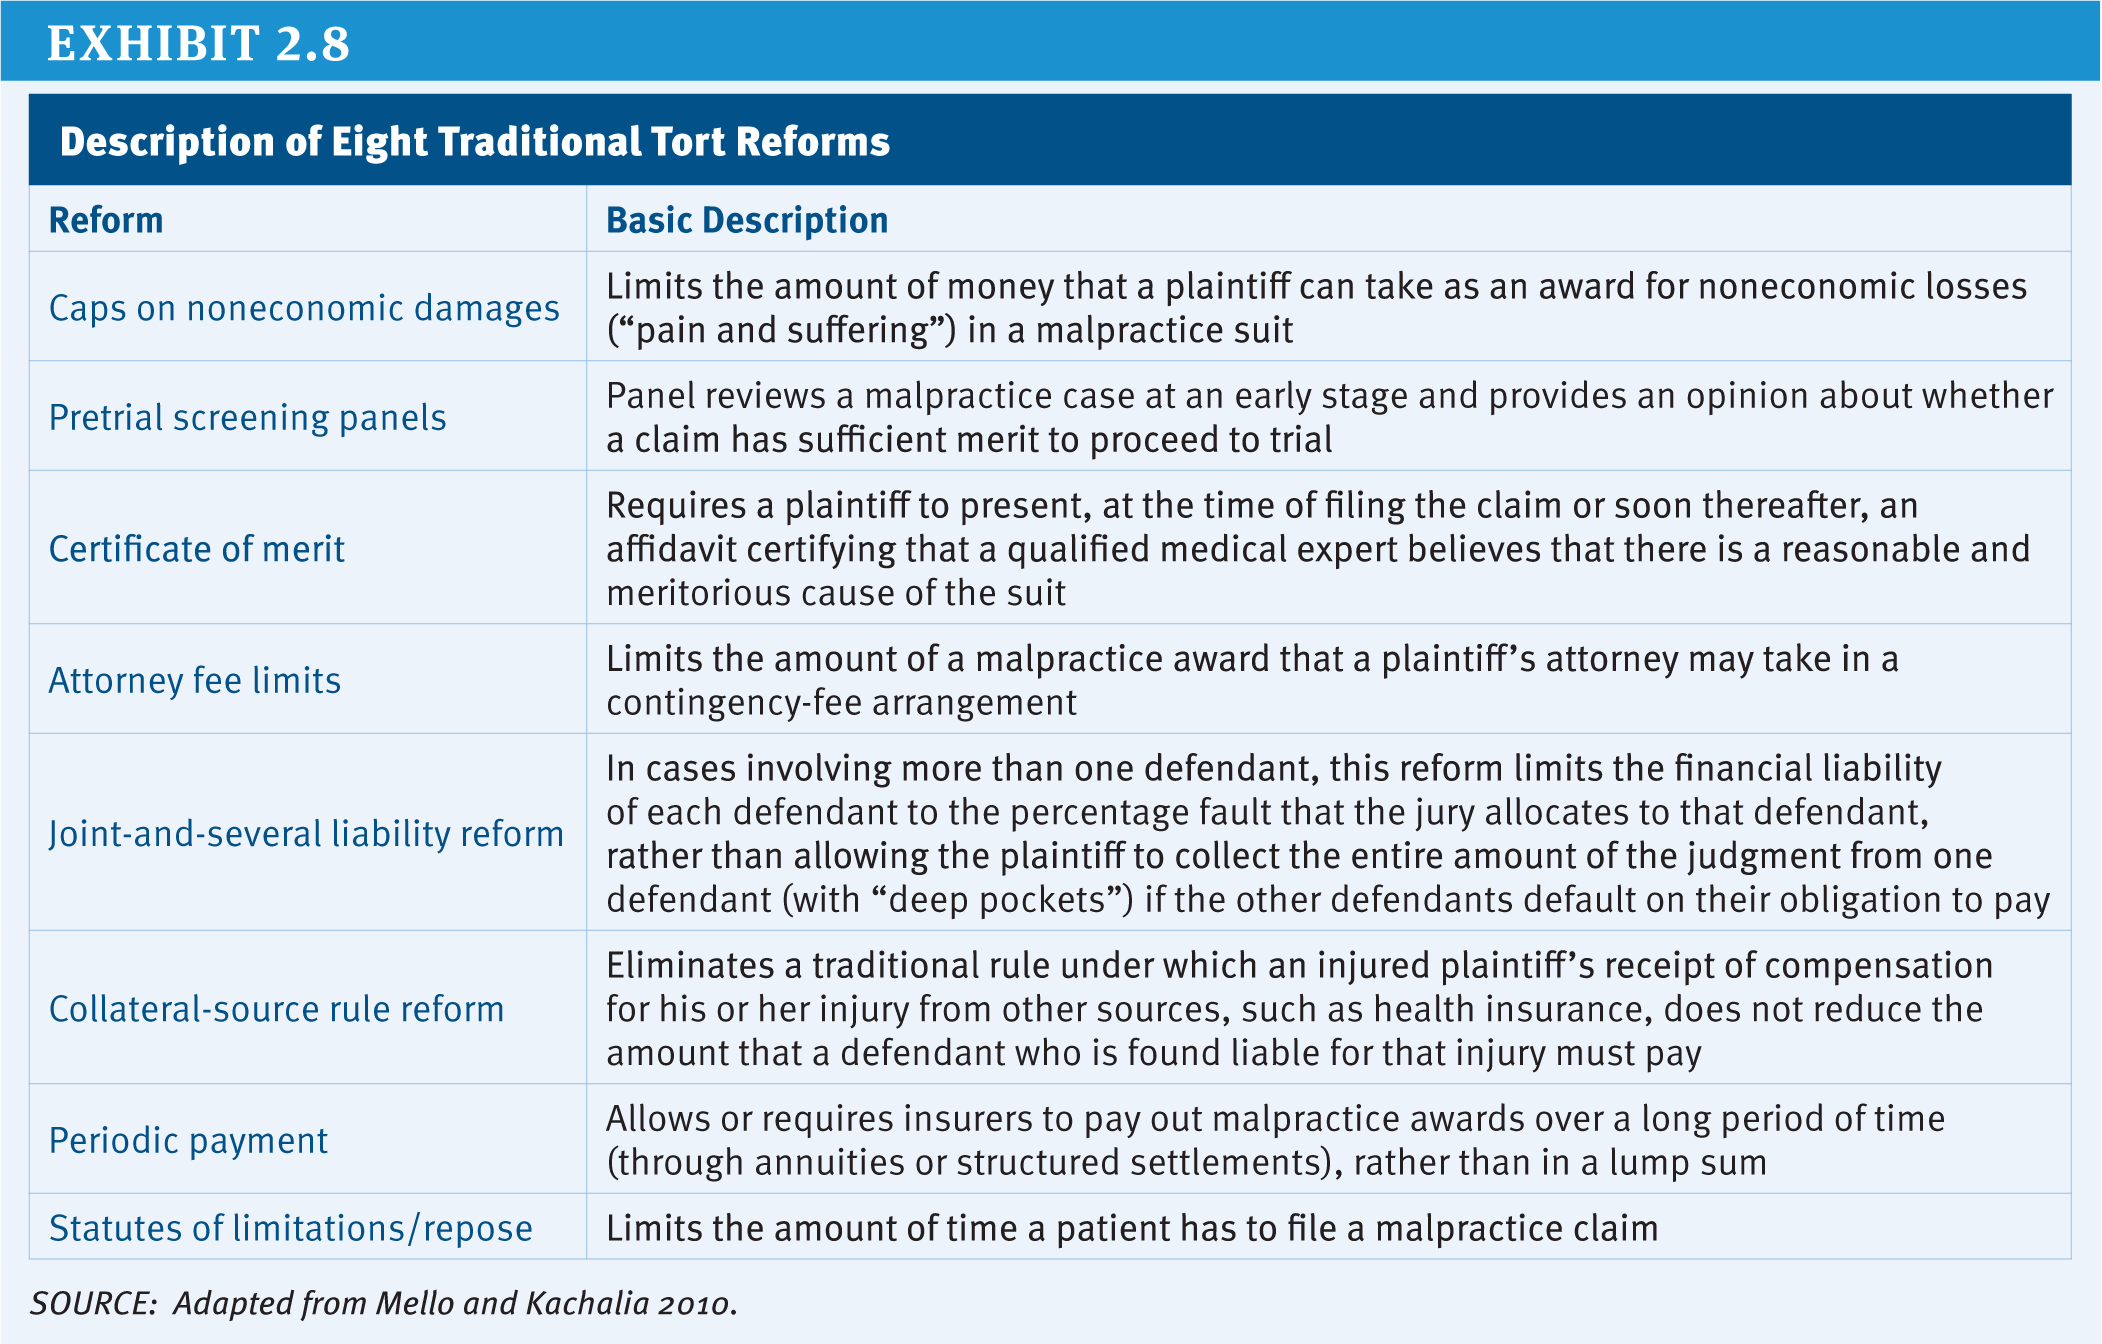
Exhibit 2.8: Description of Eight Traditional Tort Reforms