Medicare Part D at Ten Years: The 2015 Marketplace and Key Trends, 2006-2015
Section 2: Part D Premiums
National Premium Trends
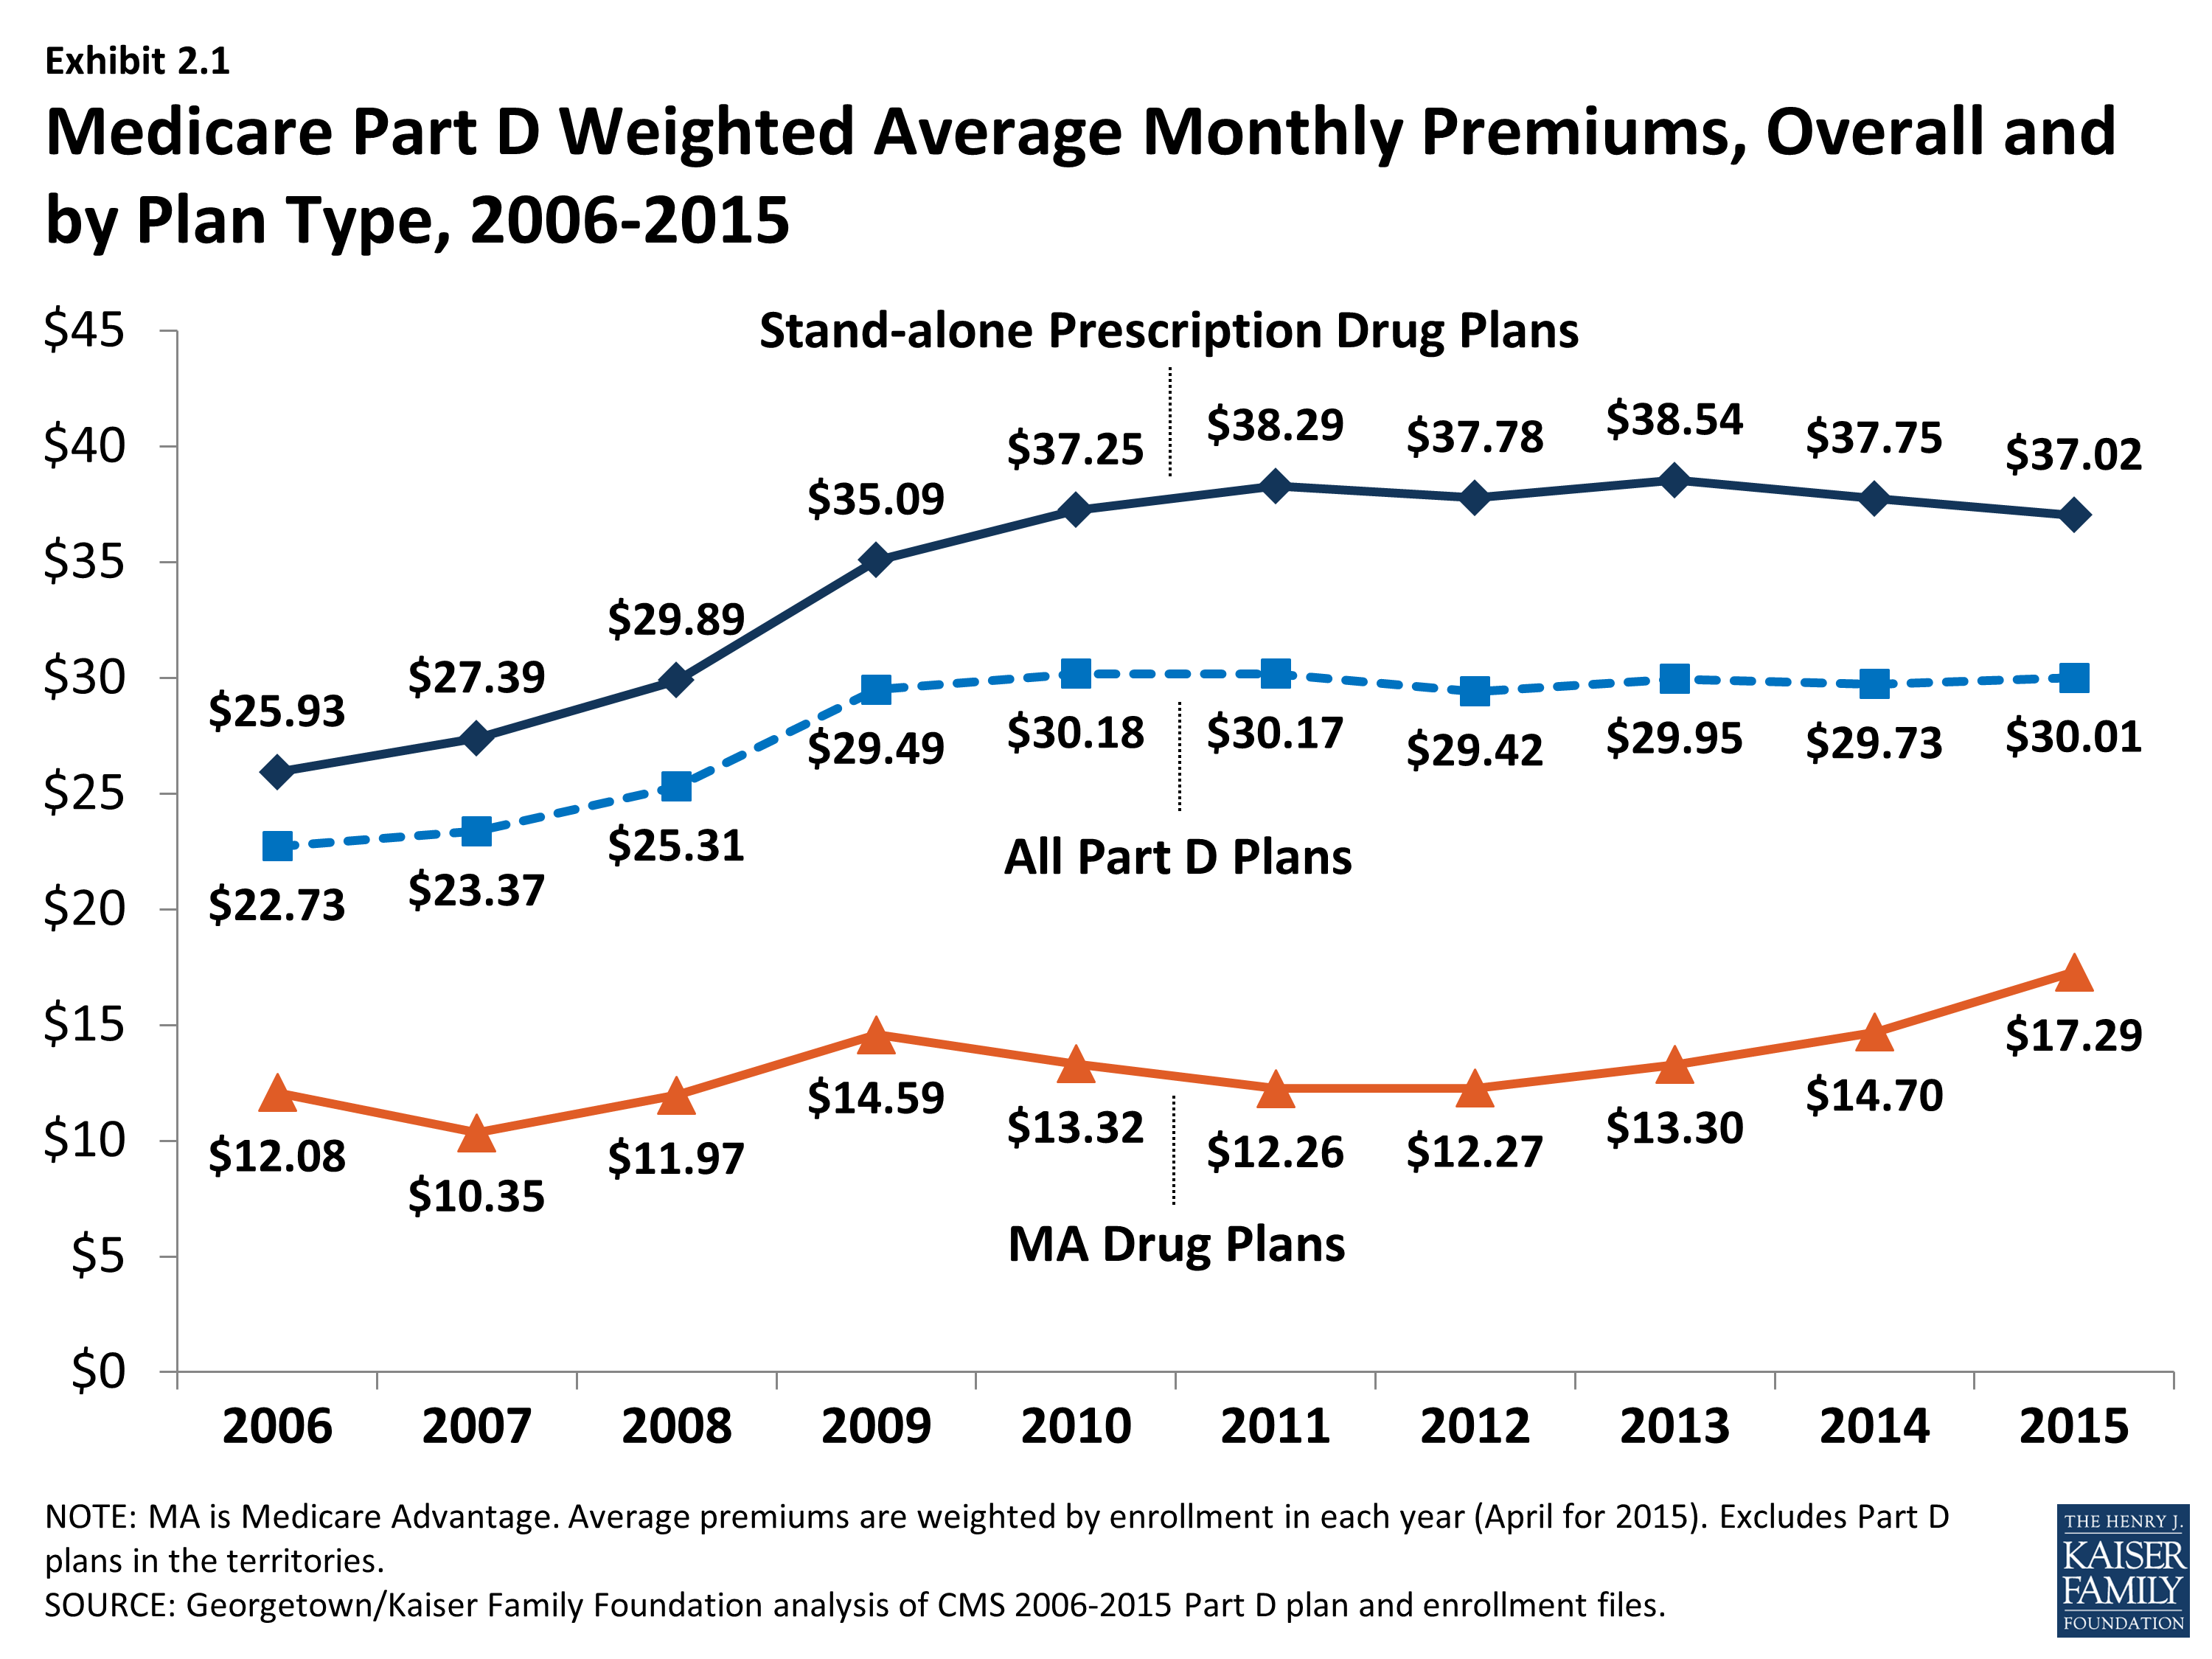
Since 2006, the average PDP premium, weighted by enrollment, has increased by 43 percent, but the 2015 average is 2 percent lower than in 2014 and 4 percent lower than at the peak in 2013. The weighted average monthly premium paid by beneficiaries for stand-alone Part D coverage has increased since the start of the program, from $25.93 in 2006 to $37.02 in 2015 (Exhibit 2.1).1,2 Premiums have been essentially flat since 2010, down slightly from 2010 to 2015. A key factor driving slow premium growth in recent years is the availability of generic versions of many drugs used for common chronic conditions, which helps to limit growth in total plan costs and hence premiums.3
The average monthly Part D premium, including both PDPs and MA-PDs, has increased from around $23 per month in 2006 to $30 per month in 2015, but has been essentially flat since 2010 (Exhibit 2.1).
Average monthly MA-PD plan premium are lower than average premiums for PDPs, but have been increasing since 2011 (compared to the flat premium trend for PDPs). The average 2015 monthly premium amount attributable to drug benefits in MA-PD plans is $17.29, up 18 percent from $14.70 in 2014 and up 30 percent from $13.30 in 2013. MA-PD premiums on average are higher in 2015 than in any year since the program began.4
At the same time, the MA-PD average monthly premium is about $20 below the PDP average monthly premium, because many MA-PD plans use a portion of rebates from the Medicare Advantage payment system to reduce or eliminate their premiums. In 2015, CMS calculated that the average MA-PD premium prior to rebates was about $3 per month lower than those for PDPs (a smaller differential than in previous years); thus, the average plan applied a rebate amount of about $17 to lower the premium in 2015.5 The increase in the MA-PD premium from 2013 to 2015 may reflect changes in the Medicare Advantage payment rules, which may have lowered these rebates. Nearly half (42 percent) of all MA-PD plans, with 52 percent of MA-PD enrollees, charge no premium for their drug benefit.
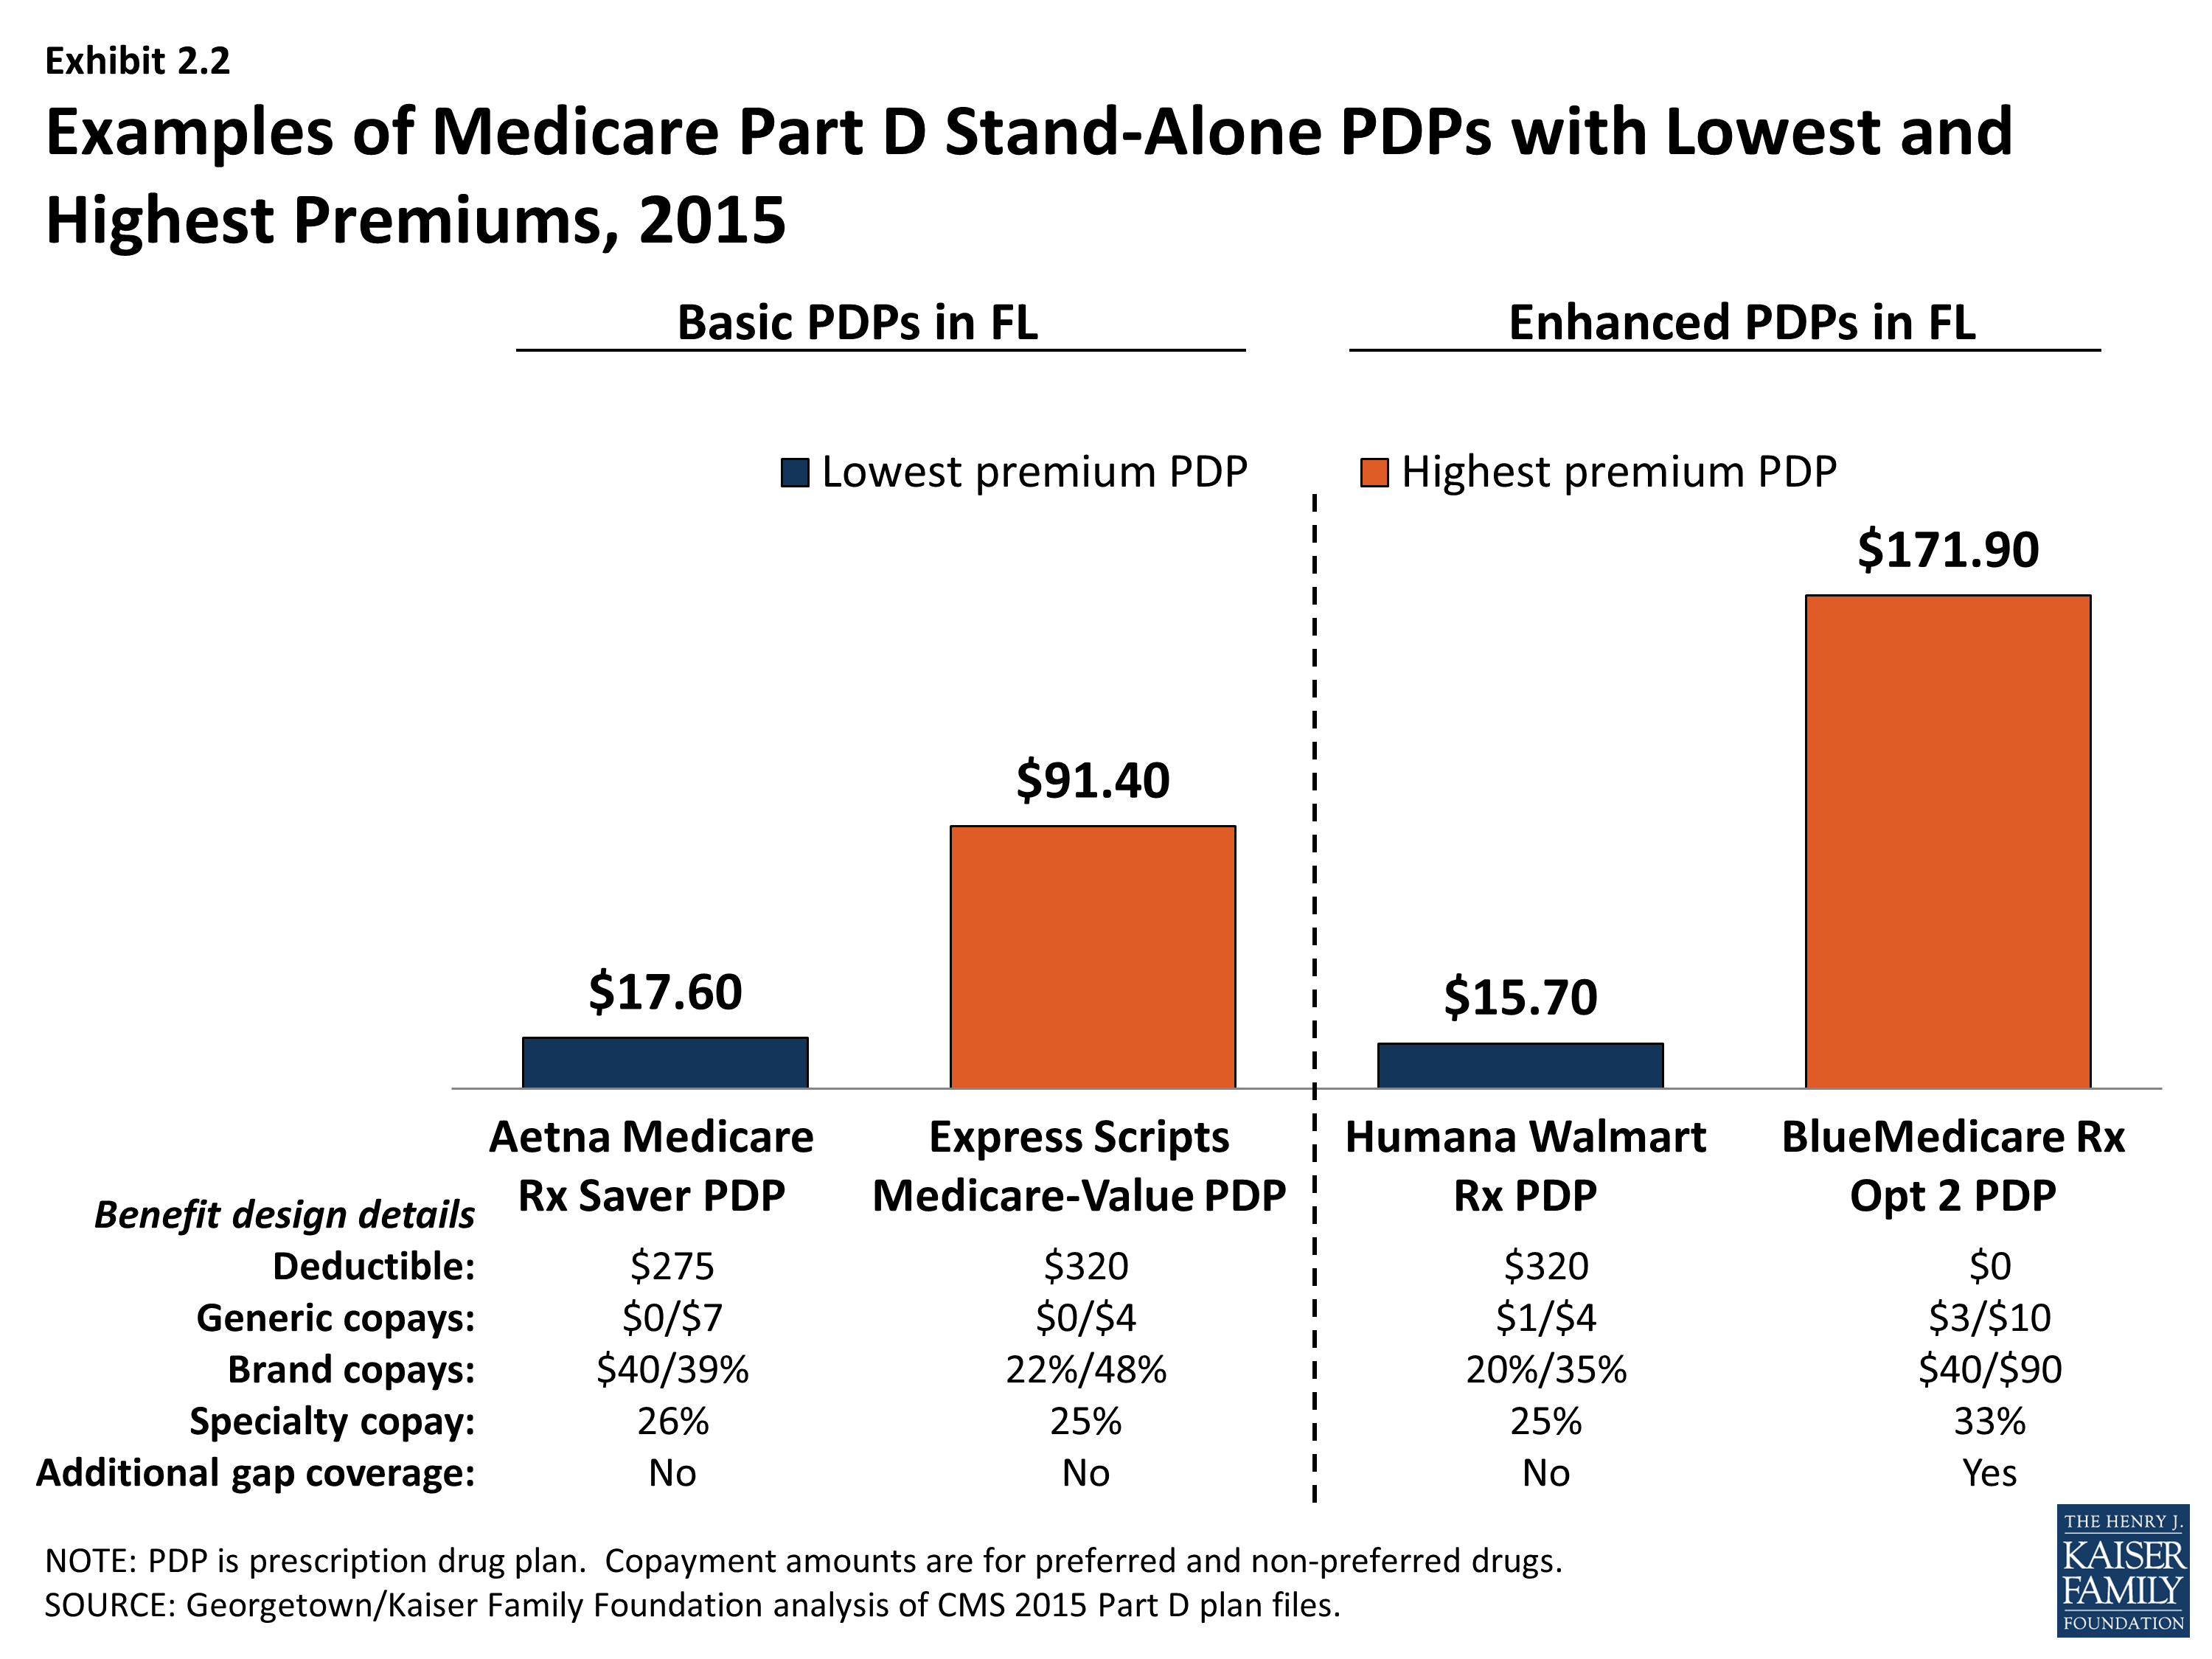
PDP premiums vary widely. Nationwide, the least expensive PDP has a $12.60 monthly premium, while the most expensive PDP has a $171.90 premium, a 14-fold difference. Although the difference can be explained partly by the relative generosity of the benefits offered or the relative efficiency across plans, these factors seem unlikely to explain the full difference. Even among plans with equivalent benefits (those offering the basic Part D benefit), premiums vary from $12.60 to $101.40 per month. As illustrated in the lowest and highest-premium PDPs in the Florida region, benefit differences are modest relative to the large premium differences (Exhibit 2.2). Although enrollees in the highest-premium enhanced plan have some coverage in the gap and no deductible and flat cost sharing for brand drugs, they face higher cost sharing for generic and specialty drugs than the lowest-premium enhanced PDP in Florida. Those enrolled in the highest-premium basic PDP have a higher deductible than those in the lowest-premium basic PDP and are subject to coinsurance for brand drugs.
Plan-Level Premium Trends
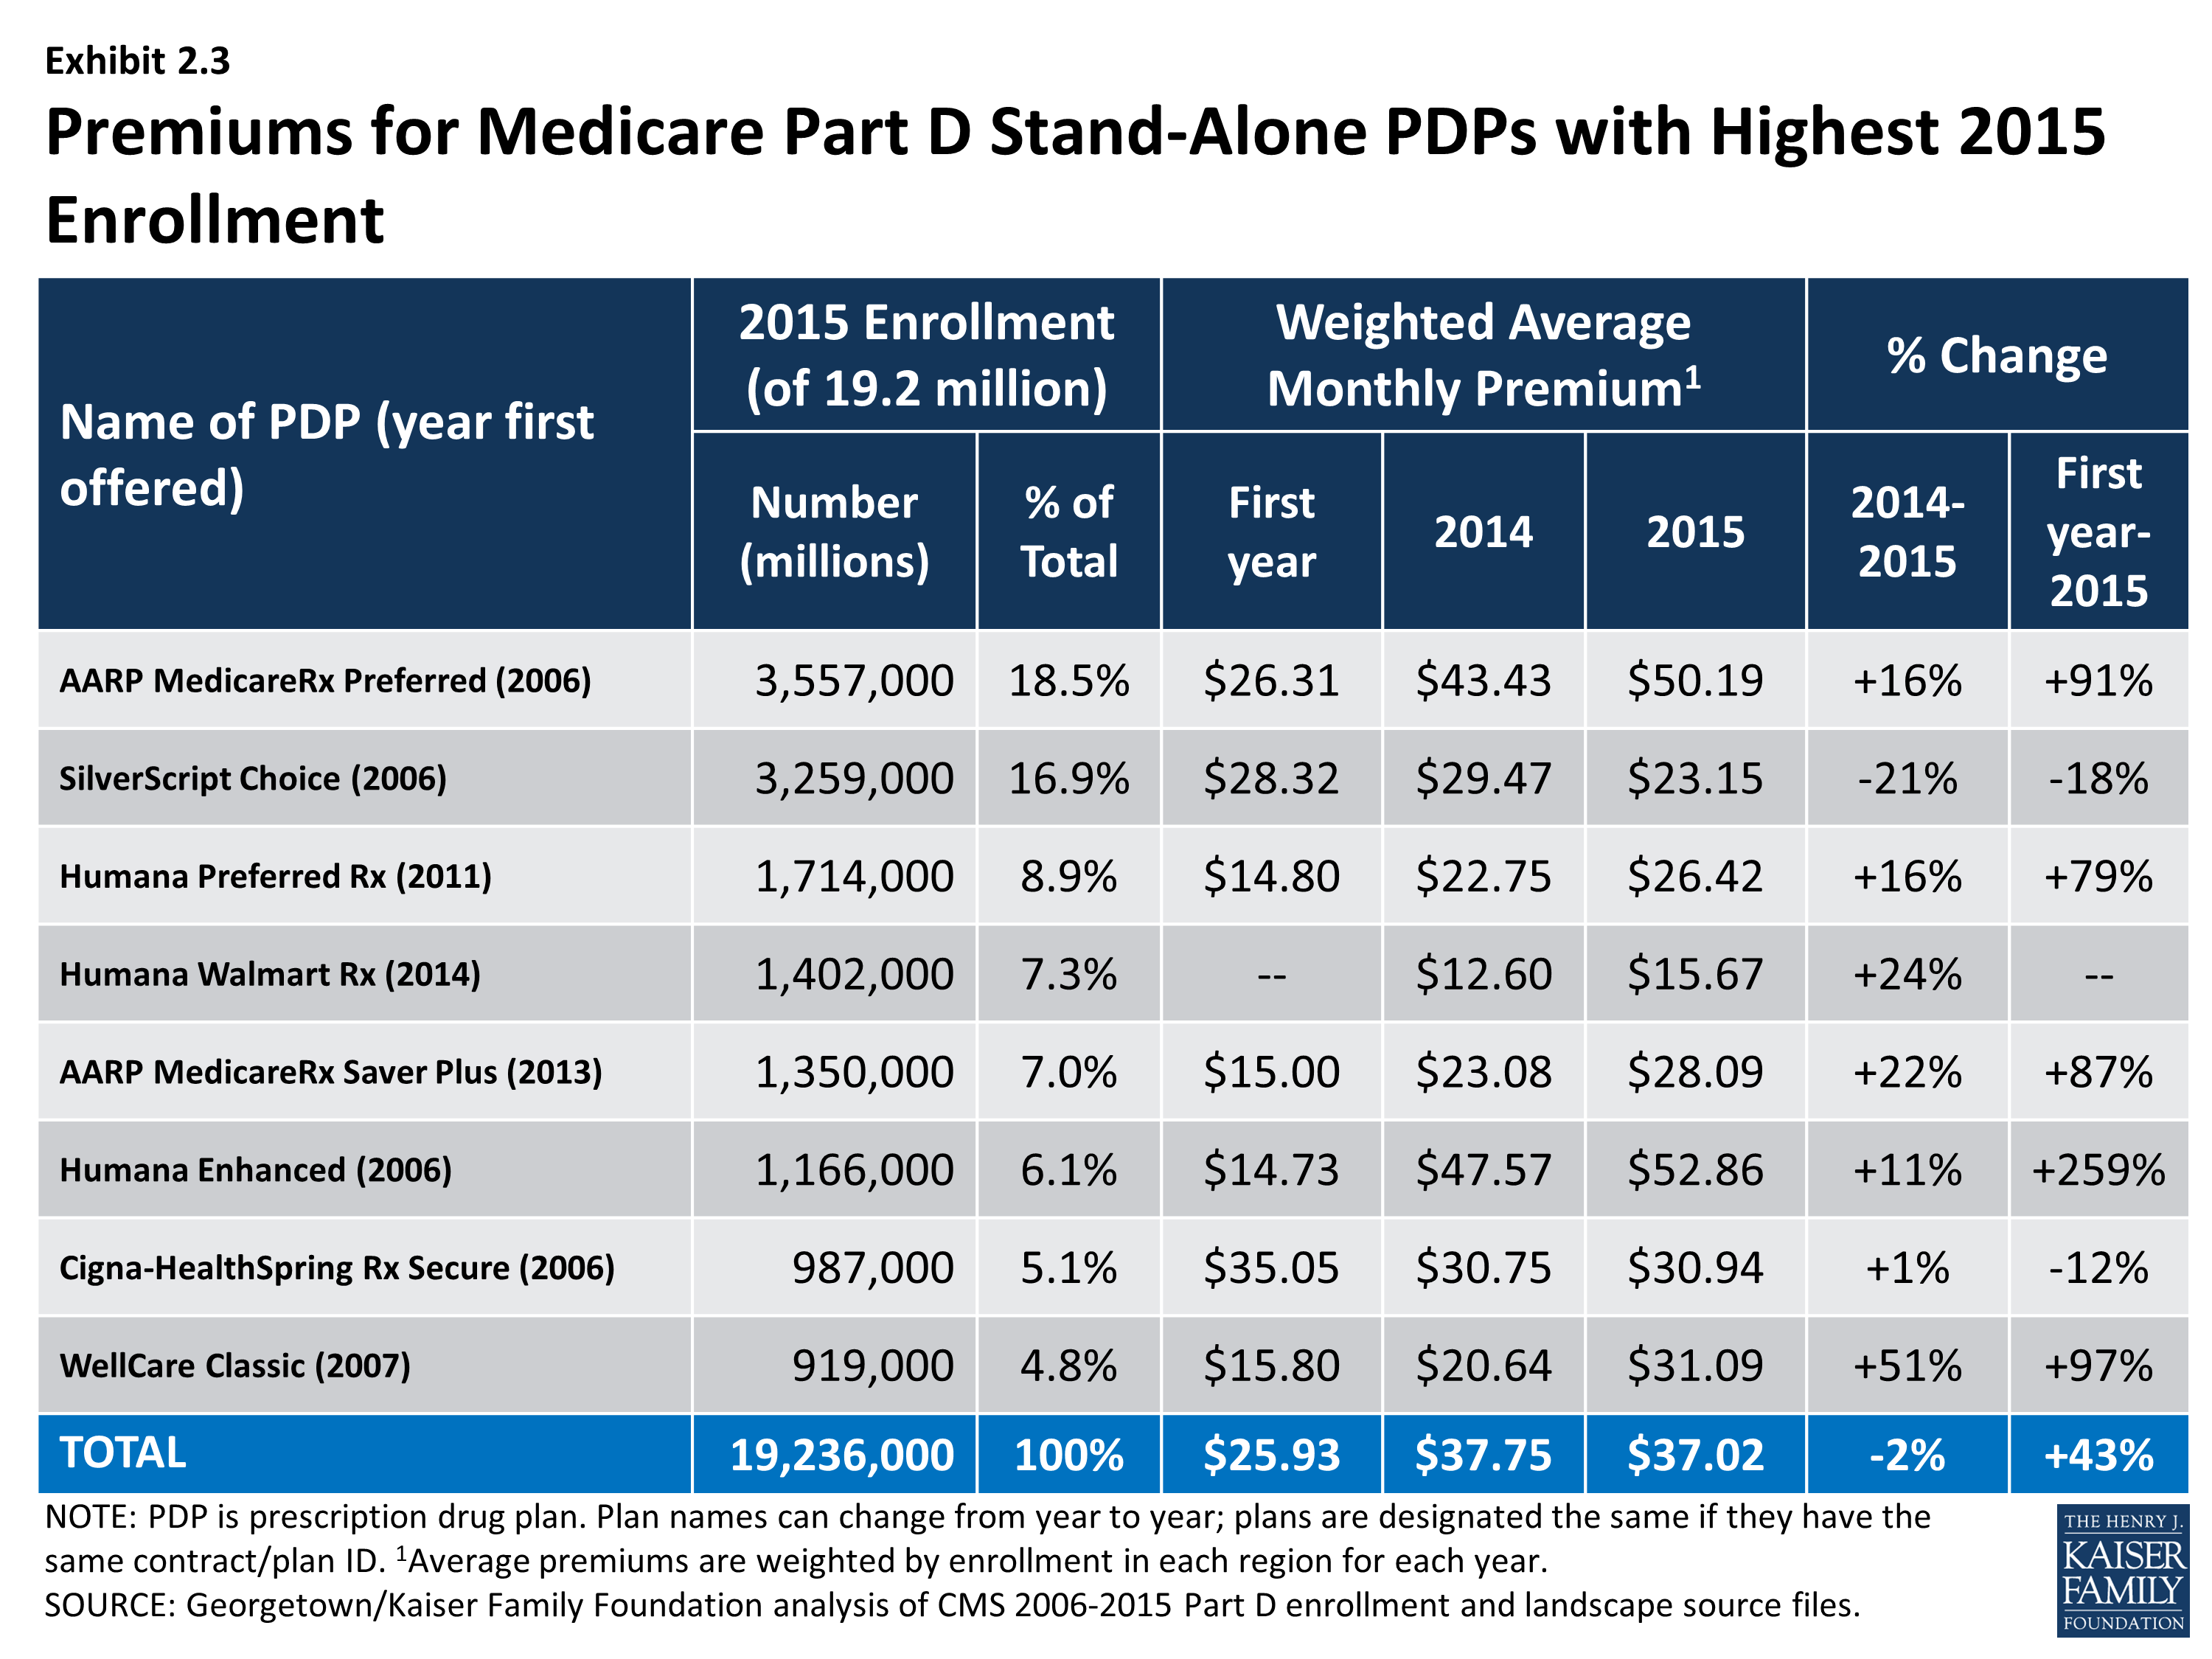
Seven of the eight PDPs with the highest enrollment charged higher average premiums in 2015 compared to 2014, whereas one lowered its average premium. More generally, the modest decrease in the average premium for all Part D enrollees hides larger changes at the plan level (Exhibit 2.3). For example, the plan with the highest enrollment, UnitedHealth’s AARP MedicareRx Preferred PDP, increased the monthly premium by 16 percent compared to 2014 (from $43.43 to $50.19). All three plans sponsored by Humana raised premiums by 11 percent or more. By contrast, the Silverscript Choice PDP, offered by CVS Health, lowered its average premium by 21 percent (from $29.47 to $23.13).
Some older, established plans have raised premiums more rapidly than the national average, while newer plans tend to set premiums low in order to build enrollment but may raise them rapidly in subsequent years. As a result, beneficiaries who stay in the same plan tend to pay more over time, as earlier research finds relatively few enrollees switch plans voluntarily in a given year.6 Established plans tend to retain enrollees as they age, when they typically use more drugs, whereas newer plans attract younger enrollees who are likely to have lower drug use and also more likely to shop based on premiums when they first enter the market. Premiums for some new plans have increased rapidly within a year or two of entering the market. For some plan sponsors, this strategy may be a conscious attempt to attract younger enrollees in newer, less expensive plans while still retaining their existing enrollees in older, more expensive plans.
Most plans that have been in the program since 2006 have increased premiums by more than the national average. Overall, of 315 PDPs that have operated under the same contract and plan numbers from 2006 to 2015 (despite some corporate acquisitions and name changes), about 40 percent have monthly premiums in 2015 that are at least double the premium in 2006, and two-thirds have raised premiums over this period by more than the national average increase. For example, the average monthly premium for Humana’s Enhanced PDP in 2015 is more than 3.5 times its 2006 average ($52.86 versus $14.73) (Exhibit 2.4). Over the same period, the premium for UnitedHealth’s AARP Medicare Rx Preferred PDP nearly doubled ($50.19 versus $26.31). By contrast, one-fourth of these continuously operating PDPs have a lower premium in 2015 than in 2006. Silverscript Choice PDP had a 18-percent lower premium in 2015 compared to 2006 ($23.15 versus $28.32).
Some of the program’s newer plans have experienced large percentage premium increases. The average premium for Humana’s Preferred Rx PDP is higher by 79 percent ($14.80 to $26.42) in four years after entering the program. UnitedHealth’s AARP MedicareRx Saver Plus PDP has experienced a net 87-percent premium increase ($15.00 to $28.09) in three years.
Overall, enrollment increased (by 13 percent) in plans that lowered premiums, while enrollment was generally flat (down by 1 percent) in plans that raised premiums. PDPs that lowered premiums by at least 20 percent had an average enrollment gain of 34 percent. By contrast, PDPs that raised premiums by at least 30 percent experienced a 15 percent average drop in enrollment. Patterns were not consistent, however, as PDPs that raised premiums 20 percent to 30 percent gained enrollment, and those that lowered premiums up to 10 percent lost enrollment. Some of the enrollment gain came from random assignment of LIS enrollees, but enrollment by non-LIS beneficiaries was considerably higher as well. Our analysis of plan switching from 2006 to 2010 found that 87 percent of beneficiaries in any particular annual enrollment period did not change plans.7 But generally consistent with patterns in 2015, those whose premiums were increasing by $10 or more were more likely to change to plans with lower premiums; 21 percent of those with a $10 to $20 premium increase and 28 percent of those with a premium increase of $20 or more changed plans.
As with PDPs, average premiums vary considerably by MA-PD plan sponsor. Plans offered by UnitedHealth, with 20 percent of the MA-PD market, have a weighted average premium of $11.44 for the drug benefit (in addition to a Part C premium of $5.02 that covers the medical benefits normally provided by traditional Medicare). The other leader in this market segment is Humana, also with 20 percent of MA-PD enrollees, which has a modestly higher average premium of $14.37 (plus $17.94 for Part C). The next two largest MA-PD sponsors are Kaiser Permanente, with a 9 percent market share and a $4.79 average premium (plus $35.85 for Part C), and Aetna, with a 6 percent market share and a $7.13 average premium (plus $16.62 for Part C).8
Geographic Variations in Premiums
Average premiums are considerably higher in certain regions than in others in 2015. Beneficiaries enrolled in a basic PDP pay an average of $36.89 in the Idaho/Utah, more than double the average ($16.97) in New Mexico (Exhibit 2.6).9 Regional differences in premiums have generally persisted from year to year and continued to grow wider in 2015. New Mexico and Arizona have been among the regions with the lowest average premiums since the program began, while the Idaho/Utah region has been among the most expensive regions.
At the same time, some regions have seen significant changes in their average PDP premiums relative to other regions. The average PDP premium in New York, for example, was below the national average from 2006 to 2010, and then increased to be above average each year since then. Regional differences in the average PDP premium were smaller in the program’s first two years, before plan sponsors could look at actual claims experience for guidance in setting premium levels.
Although persistent regional differences in premiums are driven in part by underlying regional differences in drug utilization, further explanations are not readily apparent. Plan risk scores, averaged by region for 2013 (the most recent year available) are correlated modestly (r=0.24) with that year’s average premium for basic PDPs, providing some support for the notion that utilization is a factor. In 2013, there was also a modest correlation (r=0.33) between the number of basic PDPs in each region with the average premium for those PDPs, counter to the notion that more competing plans leads to lower plan bids. In 2015, however, number of plans was not correlated with premiums, but was modestly correlated (r=-0.25) with a measure of concentration; regions that were more concentrated had lower premiums—again running counter to expectations. More research is needed to understand the patterns of geographic variation in Part D premiums.
Geographic differences in premiums are greater for some plan sponsors than others; some sponsors charge as much as three times more for the identical basic PDP from one region to another. Twelve plan sponsors offer a basic PDP in at least 30 of the 34 PDP regions. For seven of these national or near-national PDPs, premiums for the identical plan design are at least two times greater in one region than in another (Exhibit 2.6). The largest absolute premium difference is for the Cigna-HealthSpring PDP, which charges beneficiaries $20.50 in Arizona and $83.30 in Florida for the same coverage—a difference of $62.80 (a wider difference than in 2014). By contrast, the Humana Preferred Rx PDP has a difference of only $13.30 between its lowest and highest regions ($20.20 in New Mexico and $33.50 in New York), but that difference is also wider than in 2014. For six of these national or near-national PDPs, the highest premiums are in states (Florida, Missouri) where premiums overall are below the national average.
Within each region, some plan sponsors charge several times more than competing sponsors for their basic PDPs (Exhibit 2.7). In the region that includes Delaware, Maryland, and Washington, DC, the highest premium for a basic PDP is $34.30 for United American’s Select PDP, which is only one-third higher than the $25.30 premium for Aetna’s Medicare Rx Saver PDP. This region had the largest range of premiums in 2014, but several of the high-premium plans exited the market including the BlueRx Standard PDP with a 2014 premium of $111.40. The largest premium range among basic PDPs is in Florida, where the Express Scripts Medicare-Value PDP charges $91.40, seven times the lowest premium in its region ($17.60 for Aetna Medicare Rx Saver PDP). By law, all basic PDPs provide a benefit with the same actuarial value. Different utilization patterns by plan enrollees (adverse selection, beyond what can be compensated for by the risk-adjustment system used by CMS) may be a key factor driving the larger premium differences.
Premium Variations by Plan Type
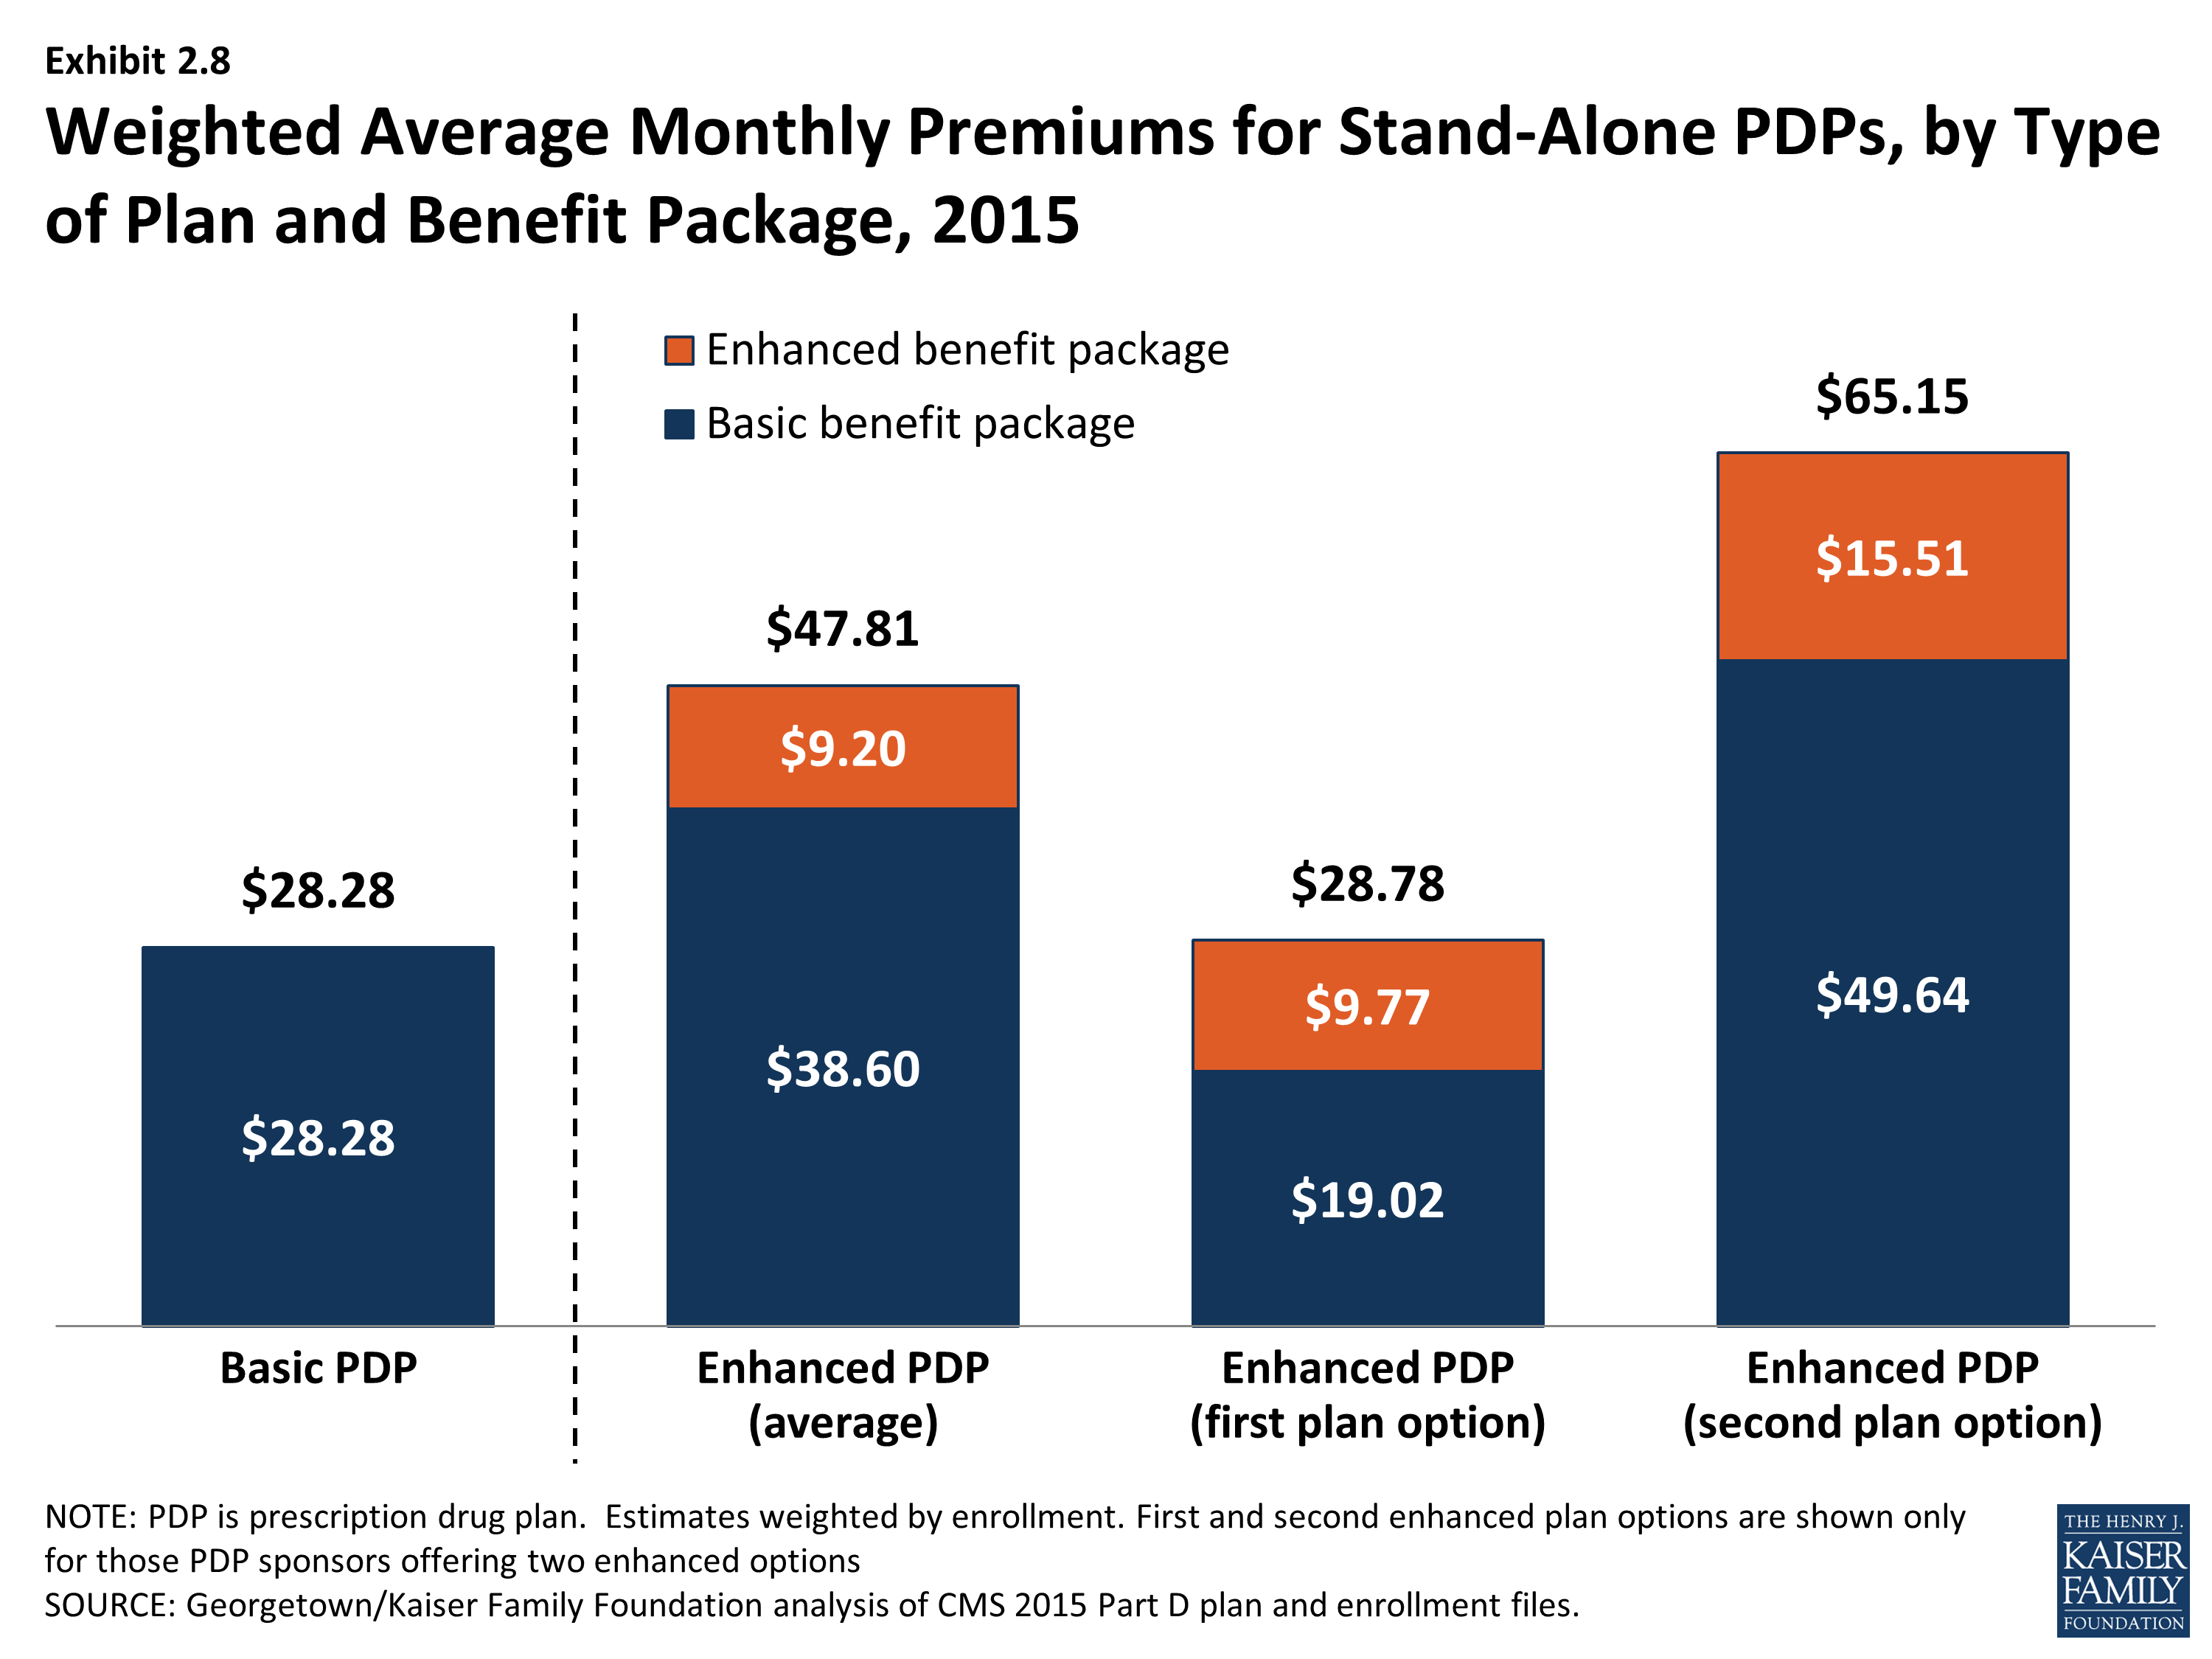
Beneficiaries selecting PDPs with an enhanced benefit package pay higher premiums on average for their Part D coverage, even for the part attributable to the basic benefit package. The weighted average monthly premium for PDPs with enhanced benefits is $47.81, compared to $28.28 for PDPs offering the basic benefit package (Exhibit 2.8). Thus, enrollees pay nearly 70 percent more to get enhanced benefits.
Plan sponsors mostly add value in their enhanced plans by lowering deductibles and sometimes adding coverage in the gap. Most enhanced plans lower or eliminate plan deductibles; 71 percent of enhanced PDPs have no deductible, compared to 7 percent of basic PDPs (the share of enhanced PDPs without a deductible is down from 89 percent in 2014). If eliminating the deductible were the only difference, beneficiaries would be paying an additional premium of $19.53 per month ($47.81 versus $28.28) or $234 annually to eliminate a $320 deductible. Some enhanced plans also expand the coverage of drugs during the coverage gap beyond the amount included in the basic benefit (48 percent of enhanced PDPs). Plans also may use lower cost sharing as part of an enhanced benefit, but as shown in the section below on cost sharing, enhanced PDPs on average charged higher cost sharing in 2015.
Starting with PDPs offered in 2011, CMS has required sponsors to ensure that benefits in enhanced PDPs are meaningfully different than the basic benefits and have a measurable added value. This policy has led to a larger spread between premiums for basic PDPs and enhanced PDPs than in previous years. In 2015, an enhanced PDP must have cost-sharing differences that result in at least $20 lower monthly out-of-pocket costs than the corresponding basic PDP—an amount that is essentially offset by the $19.53 average monthly premium difference between basic plans and enhanced PDPs.
Some PDP sponsors offer two enhanced plans, a less generous first option and a more generous second option; average monthly premiums for the more generous enhanced PDPs offered by these sponsors are much higher than the first option’s premium ($65.15 versus $28.78). As part of its policy on meaningful differences, CMS allows sponsors to offer a second enhanced PDP only if expected out-of-pocket cost sharing amounts are lower (by $25 per month) than for the first enhanced PDP and the second enhanced PDP has coverage for at least some brand-name drugs in the coverage gap. The $36 difference in premiums exceeds the required difference in out-of-pocket costs.
Although higher premiums partly reflect the cost of offering enhanced benefits, the portion of the premium that corresponds to the basic benefit ($38.60 on average for enhanced PDPs) is higher than the premium for basic PDPs ($28.28) (Exhibit 2.8). For some sponsors, the difference is much greater. Risk selection may be a factor in these higher premiums, although in 2013 enrollees in enhanced PDPs actually had lower risk scores (0.94) than those in basic PDPs (1.05), mostly attributable to enrollees in the less generous enhanced PDPs. But it may be that the enhanced plans have attracted beneficiaries with higher drug needs beyond differences captured by risk adjustment. Furthermore, even though program rules seem to disallow it, plan sponsors may cross-subsidize some of the supplemental portion of bids for enhanced plans with the basic component in order to maximize the government subsidy.10
Some plan sponsors offer enhanced PDPs that have the minimum level of enhanced coverage required by the meaningful difference tests and are offered at low premiums with the apparent goal of attracting beneficiaries with low expected drug costs. In 2015, for example, one of Humana’s enhanced PDPs (Walmart Rx) is offered at an average premium of $15.67 per month, whereas its basic PDP (Preferred Rx) is $26.42. For several other plan sponsors, the portion of the premium attributable to a plan’s basic benefits (thus excluding the value of any enhanced benefit) is lower for their enhanced PDPs compared to their basic PDPs. A key reason for lower premiums in these enhanced plans is favorable risk selection that occurs because they are attractive to non-LIS beneficiaries who are using few drugs and because there are relatively few LIS beneficiaries enrolled in enhanced plans. In 2013, the average risk score for enrollees in the less generous enhanced PDPs was 0.93, compared to 1.04 in the more generous enhanced PDPs.
Medicare Part D Weighted Average Monthly Premiums, Overall and by Plan Type, 2006-2015
Examples of Medicare Part D Stand-Alone PDPs with Lowest and Highest Premiums, 2015
Premiums for Medicare Part D Stand-Alone PDPs with Highest 2015 Enrollment
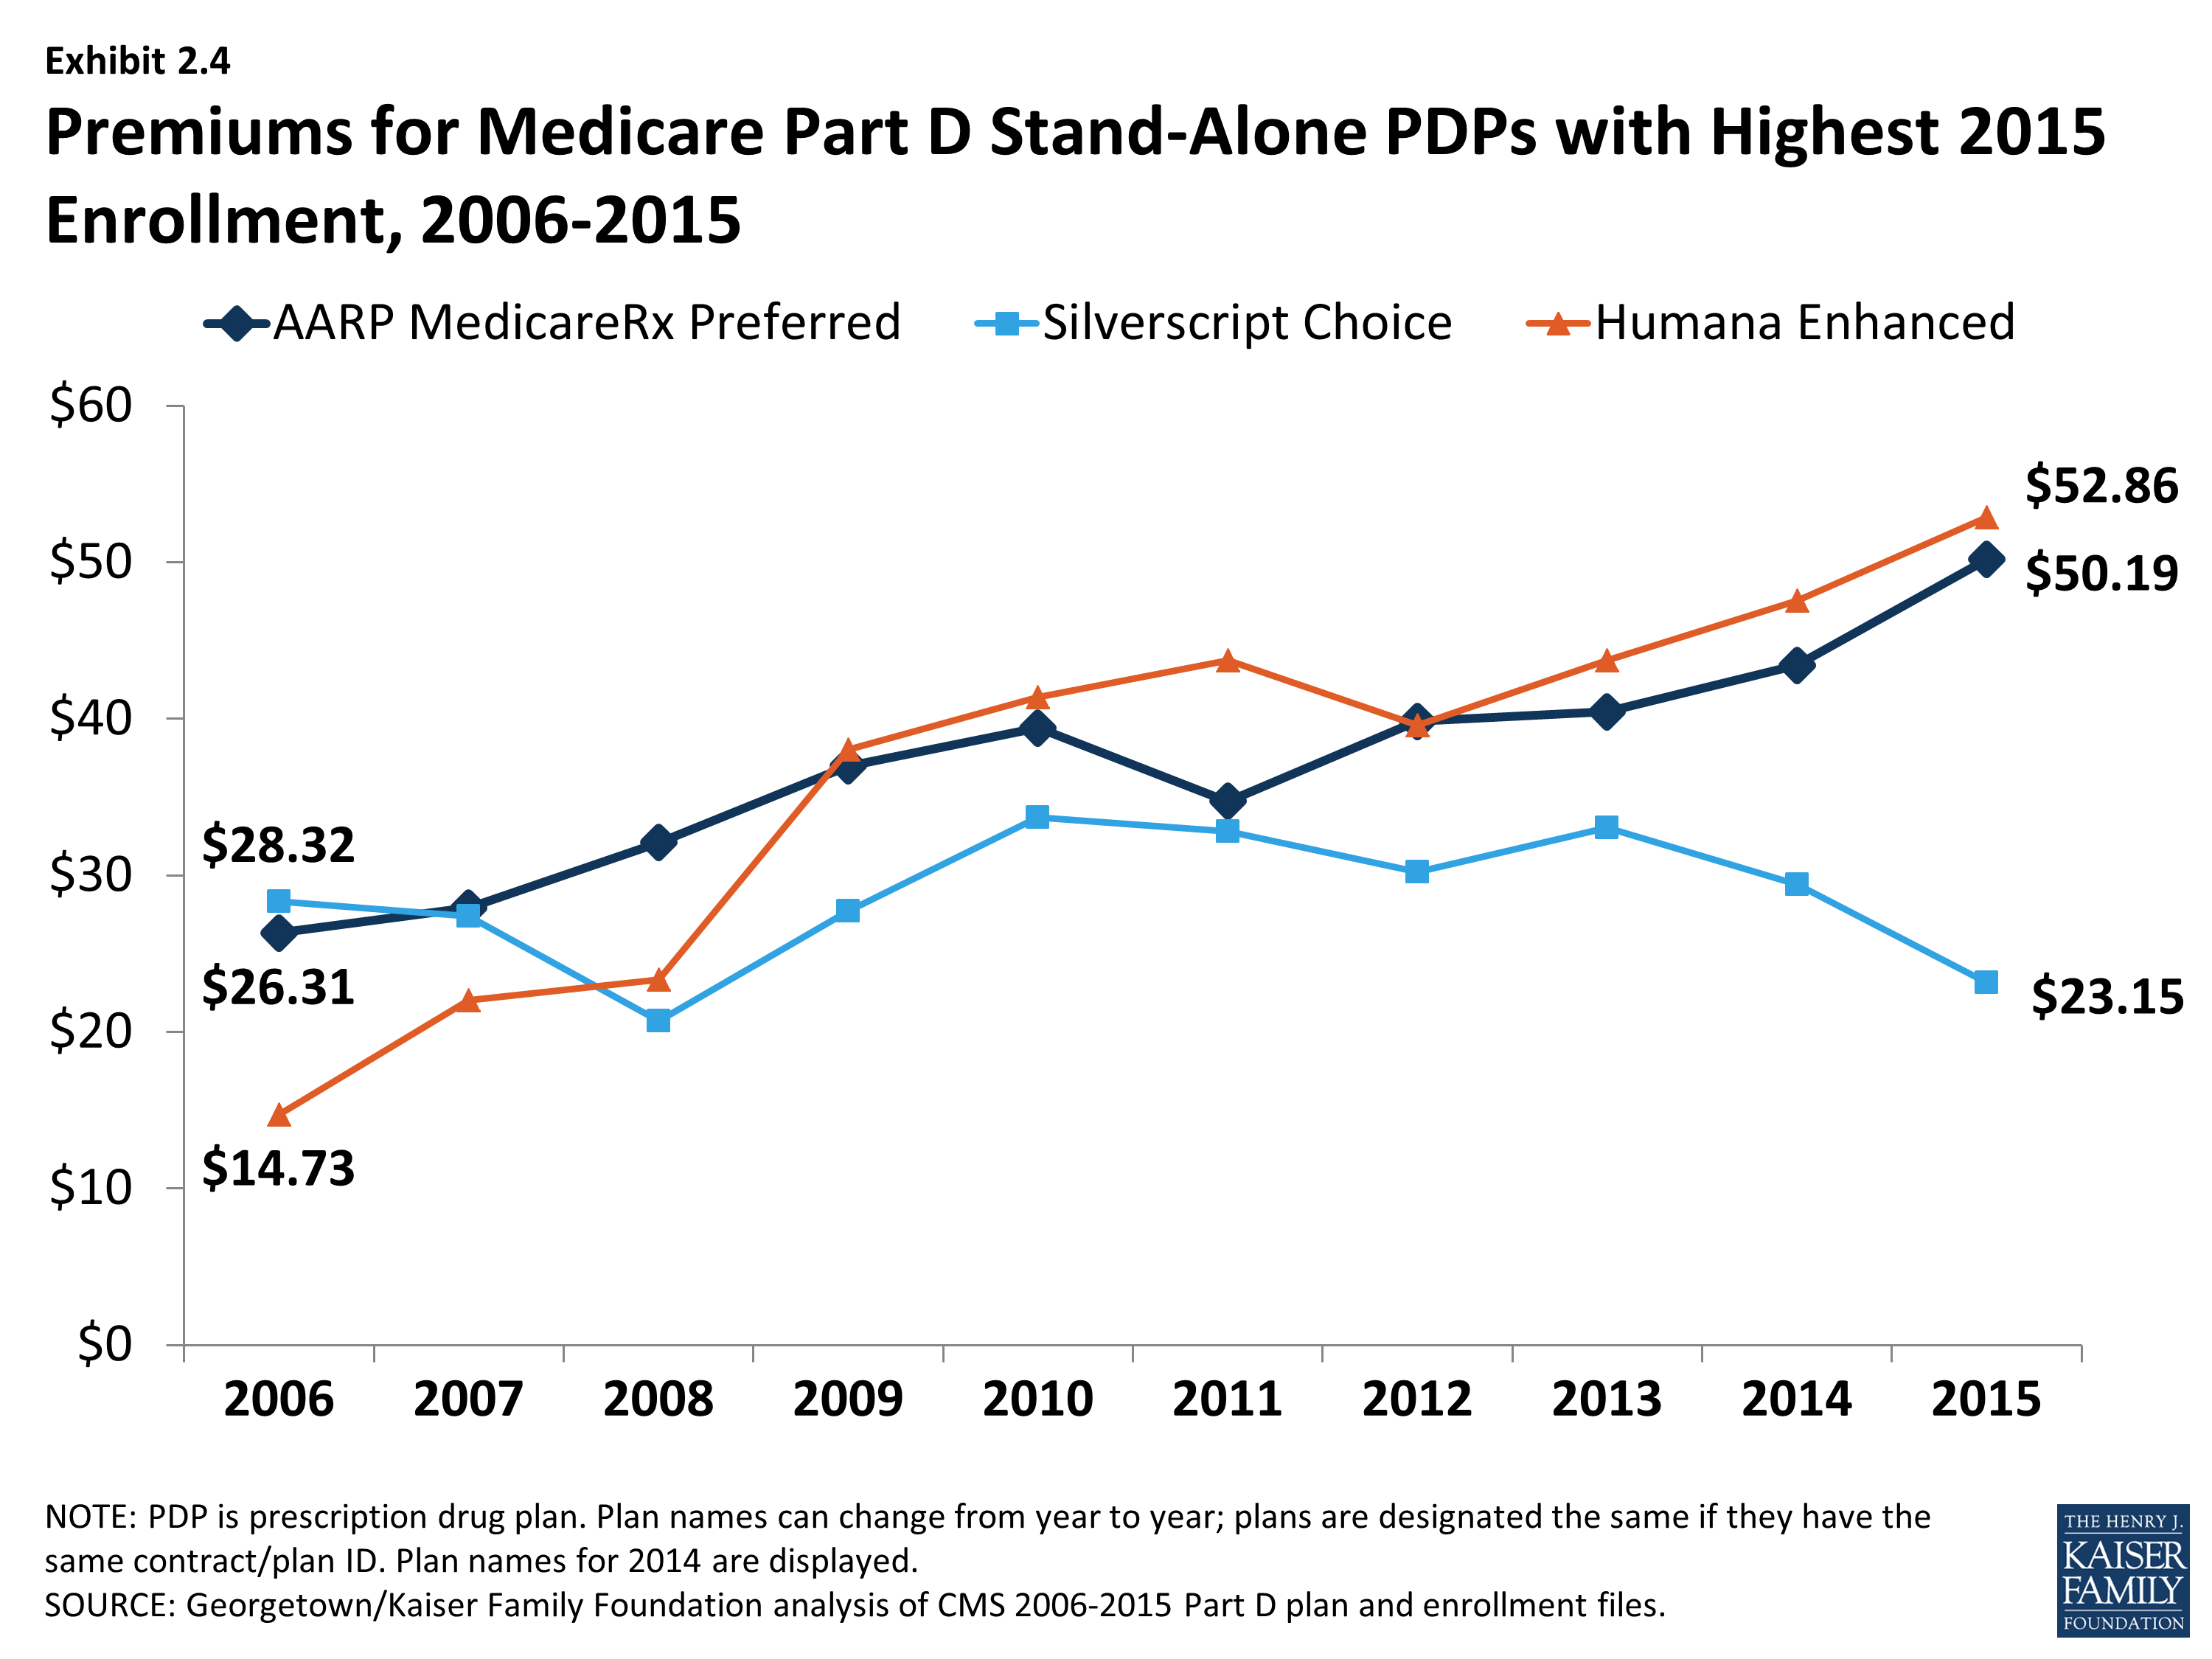
Premiums for Medicare Part D Stand-Alone PDPs with Highest 2015 Enrollment, 2006-2015

Weighted Average Premiums for Medicare Part D Basic Stand-Alone PDPs, by Region, 2015
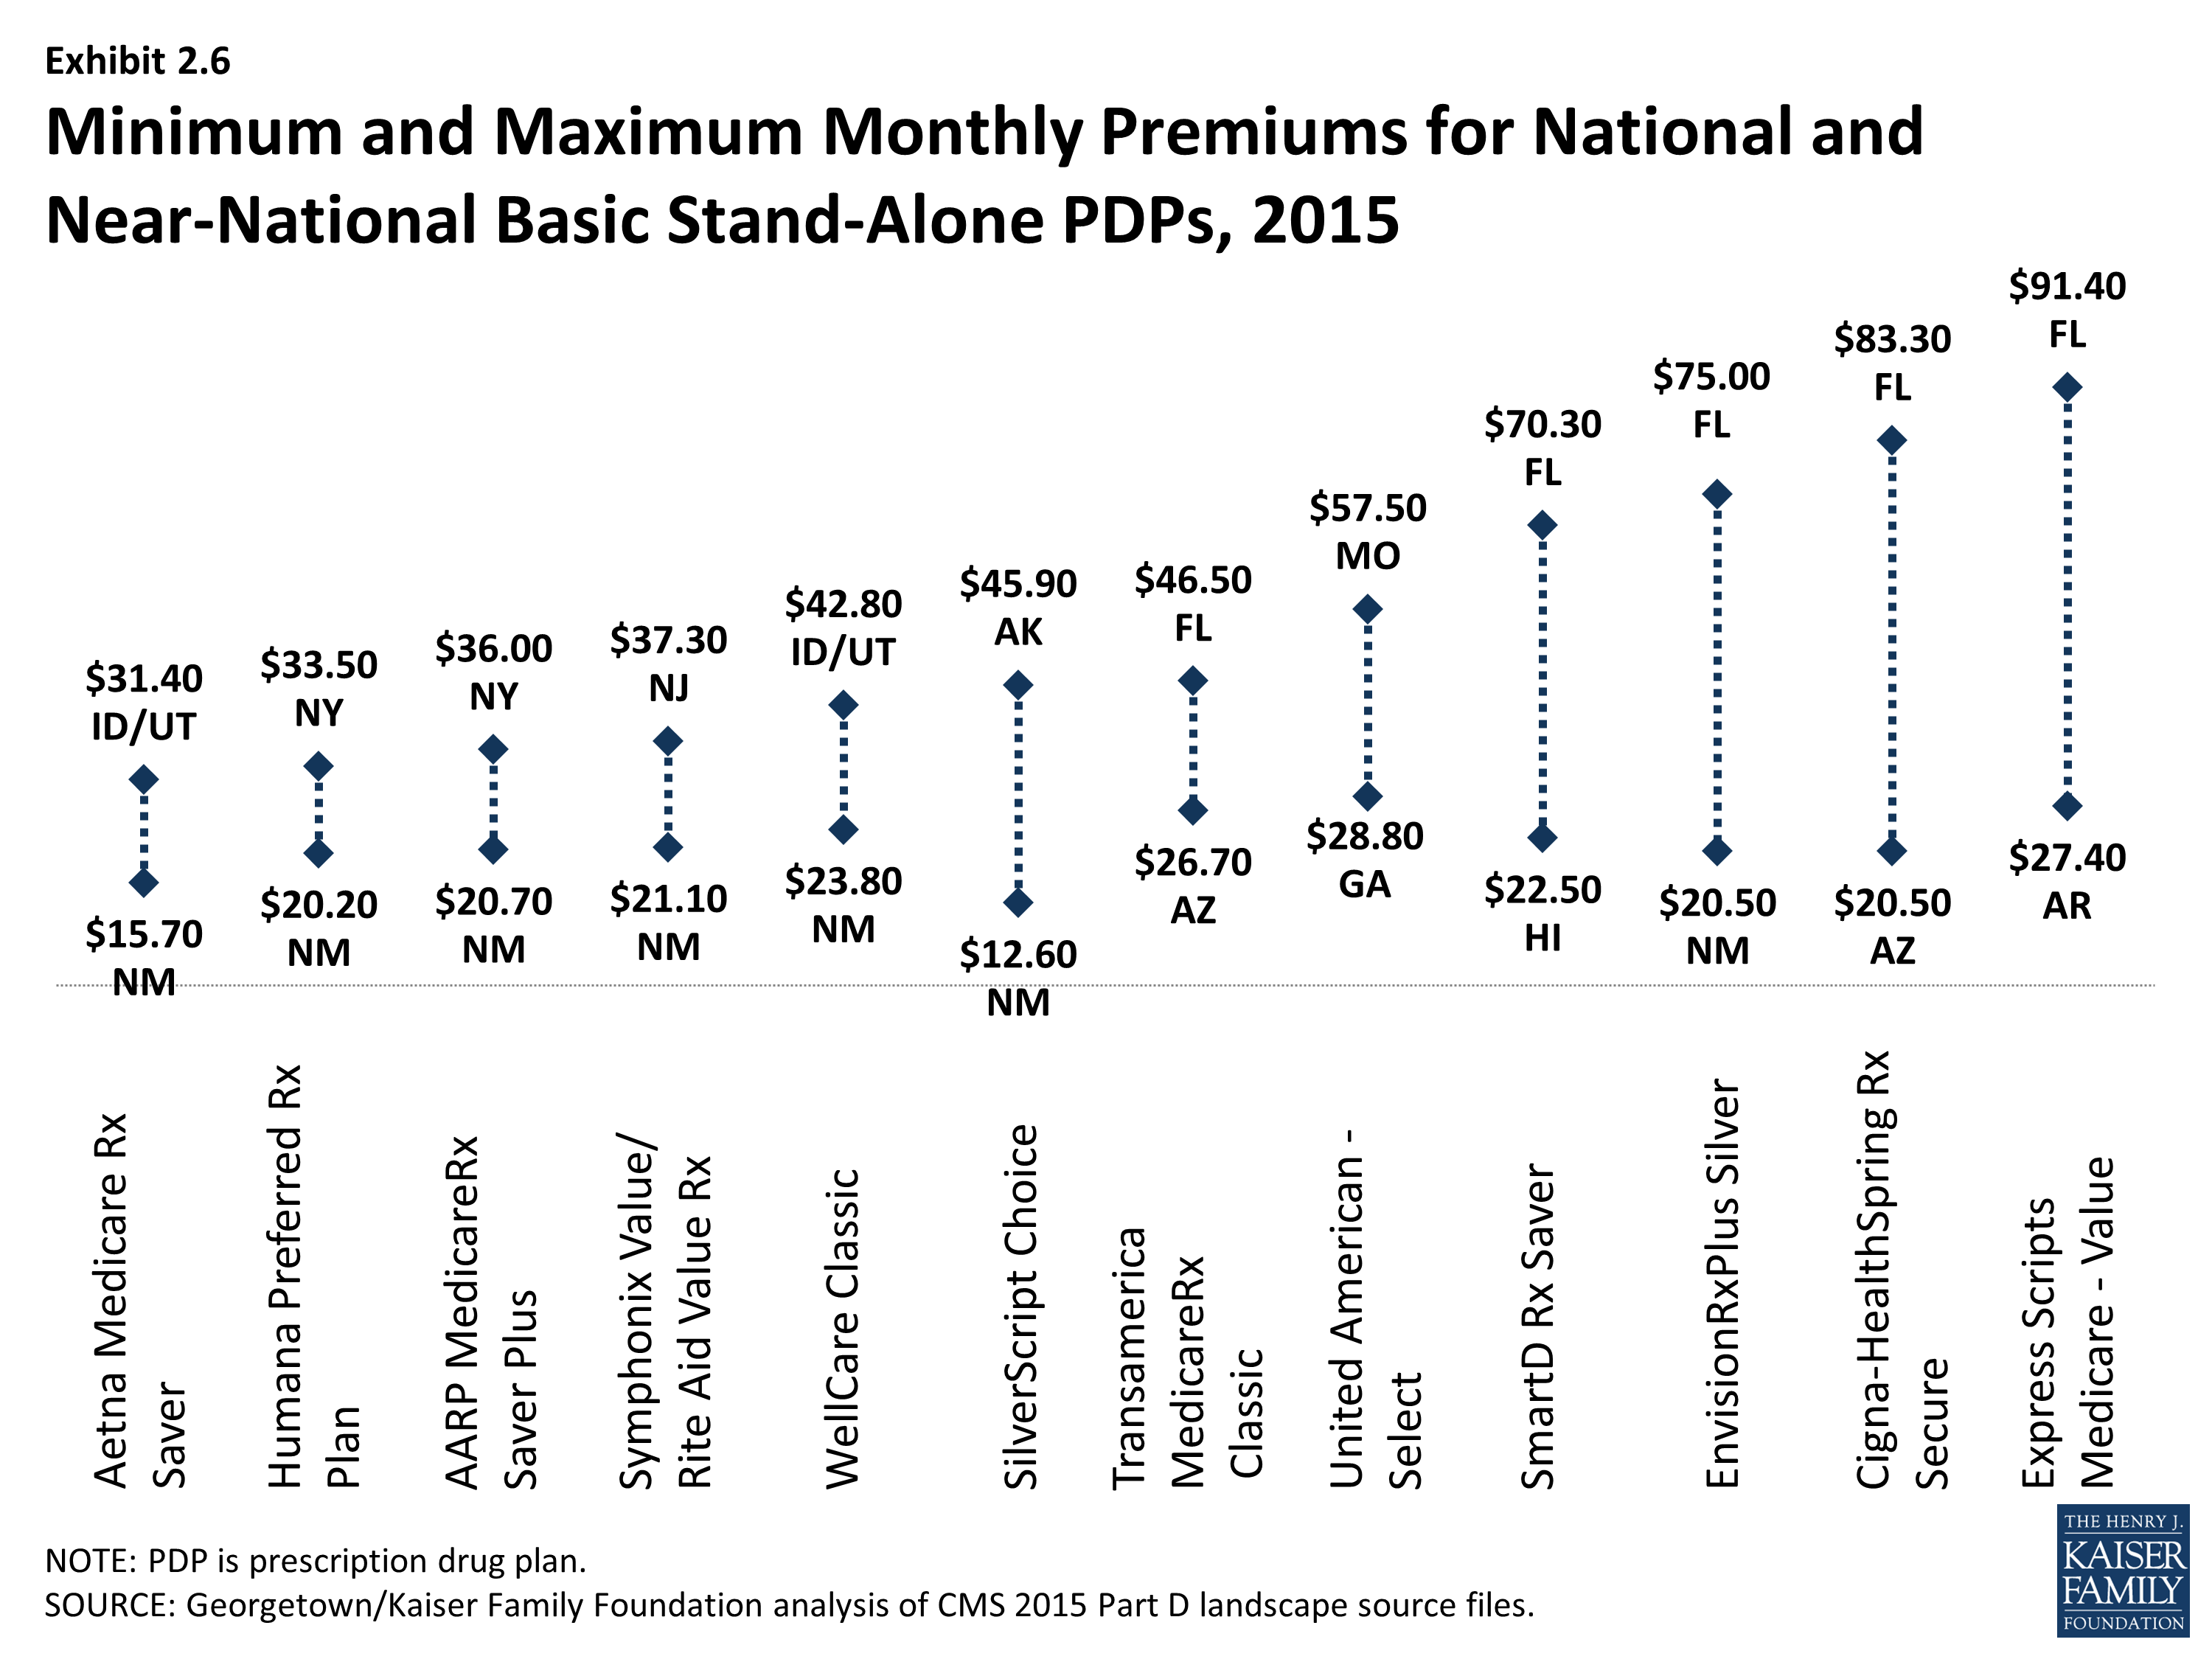
Minimum and Maximum Monthly Premiums for National and Near-National Basic Stand-Alone PDPs, 2015
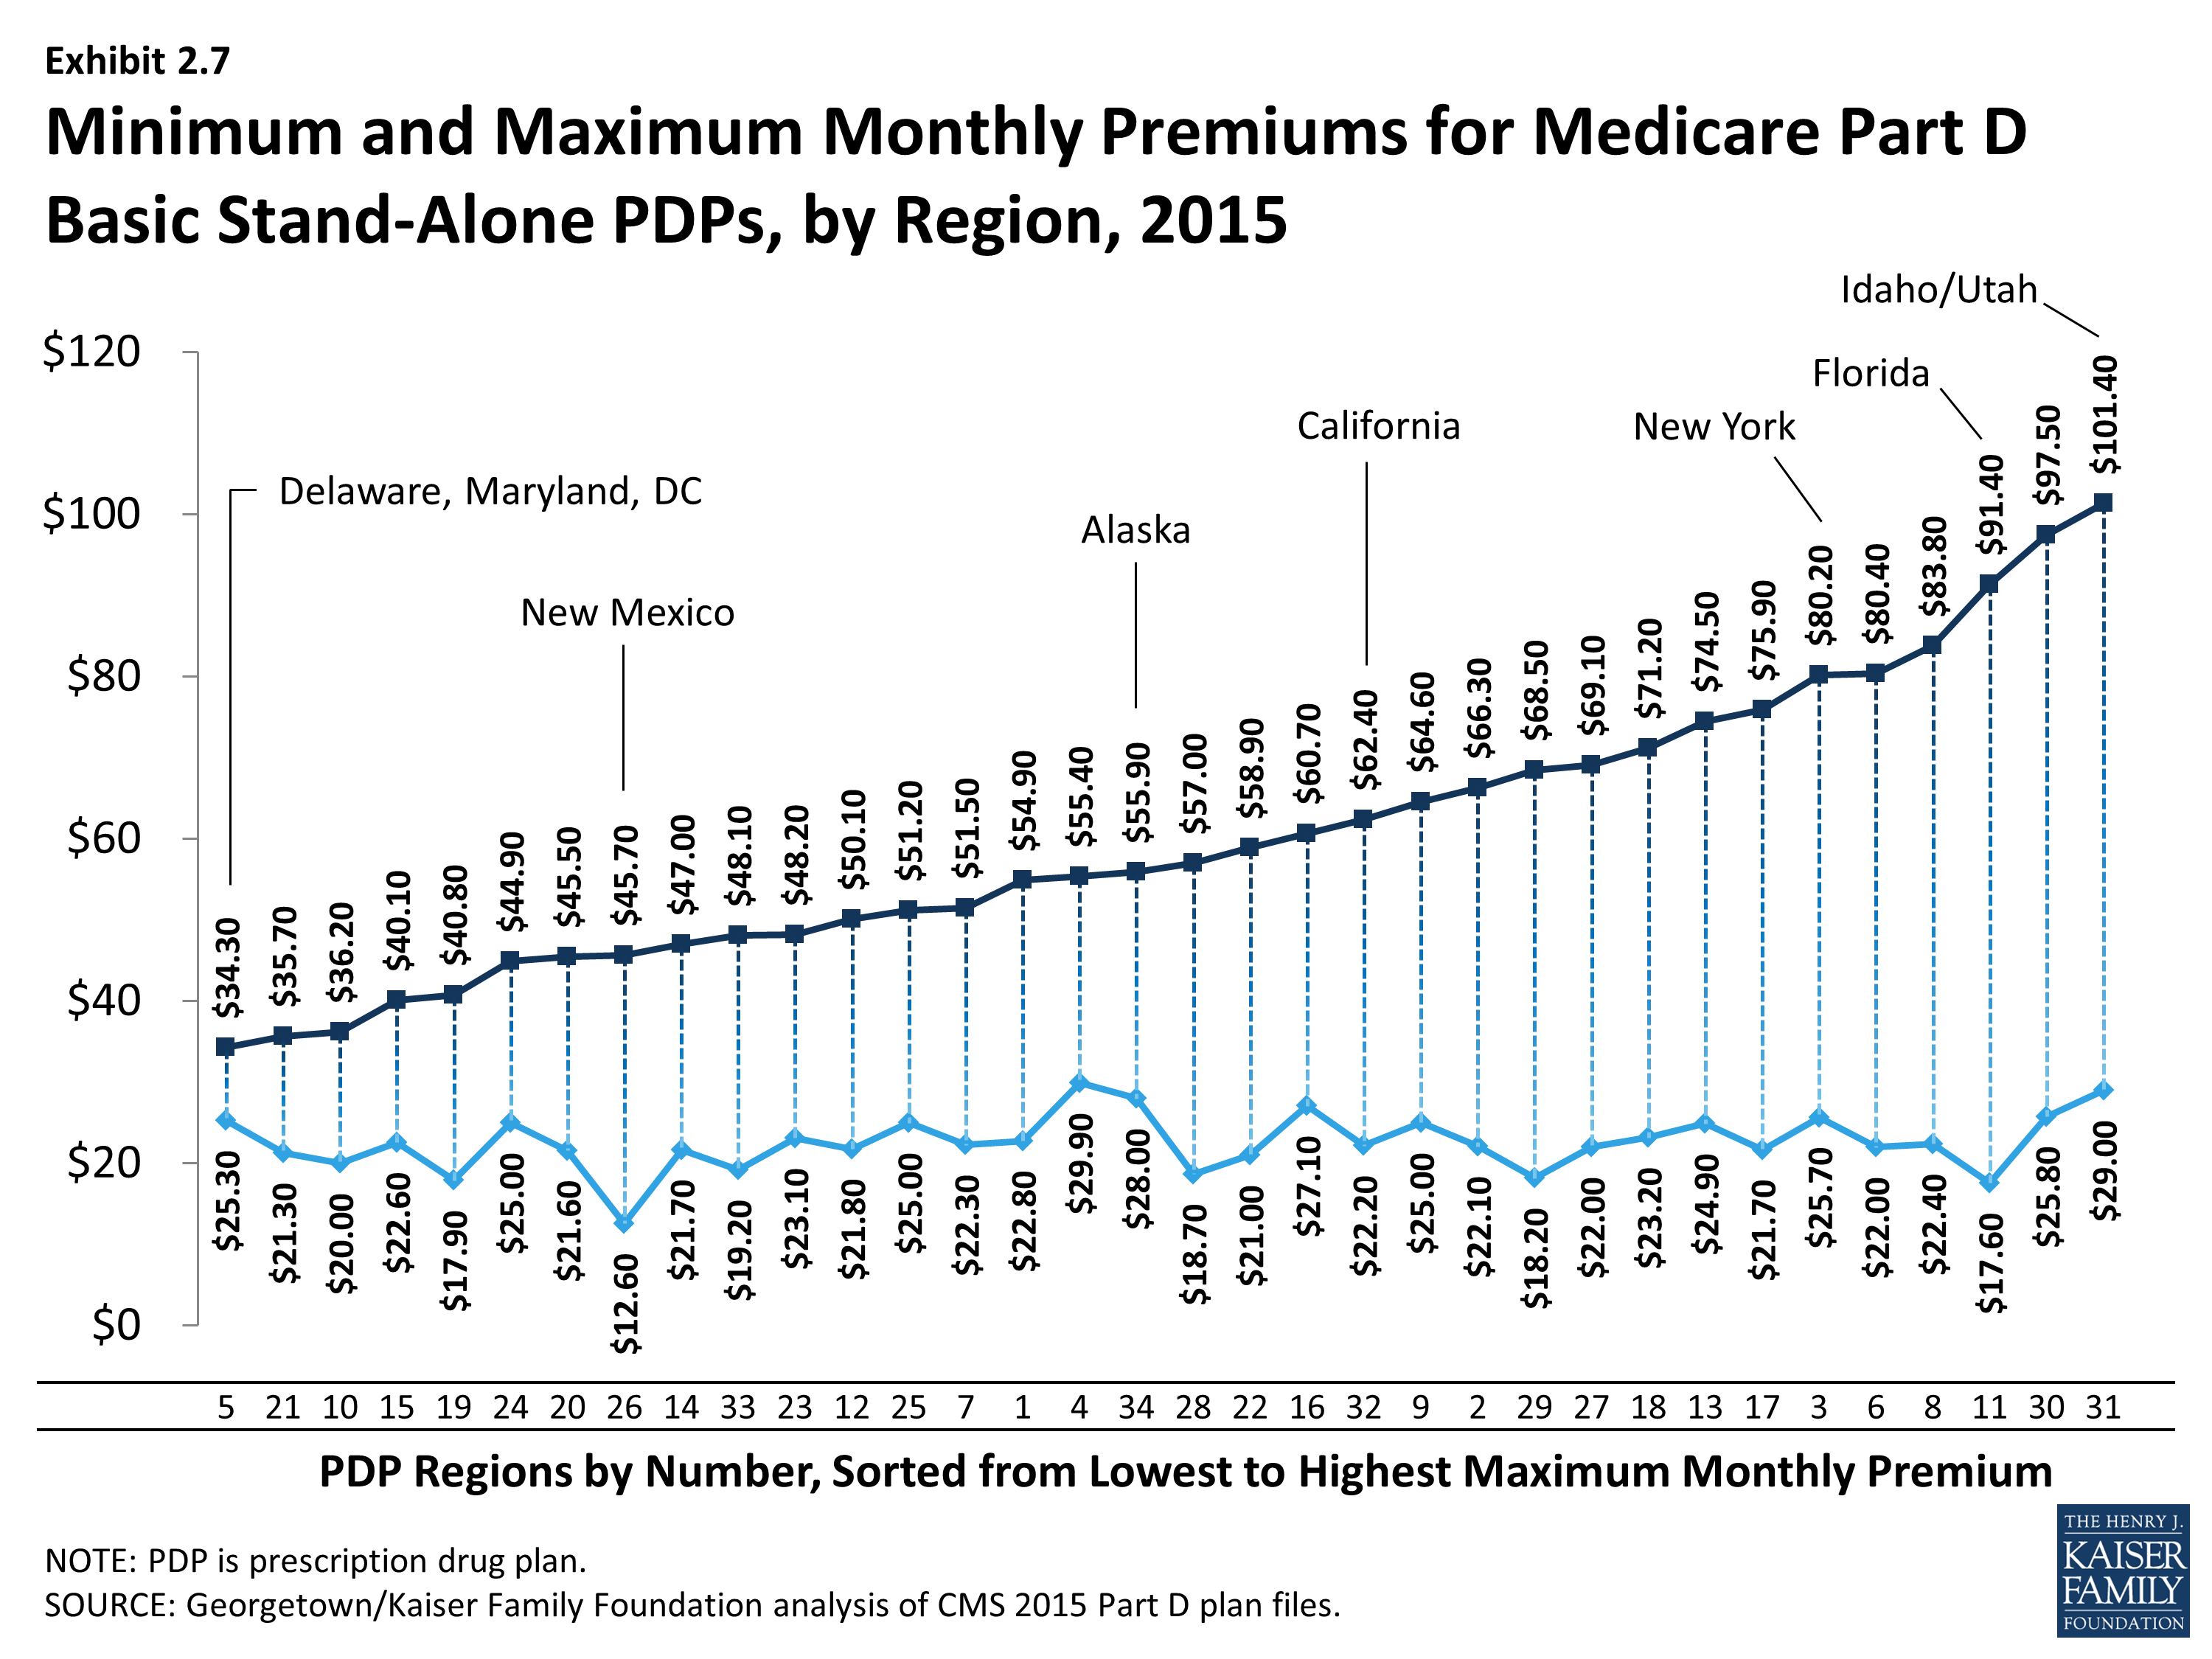
Minimum and Maximum Monthly Premiums for Medicare Part D Basic Stand-Alone PDPs, by Region, 2015