Medicare Part D: A First Look at Plan Offerings in 2014
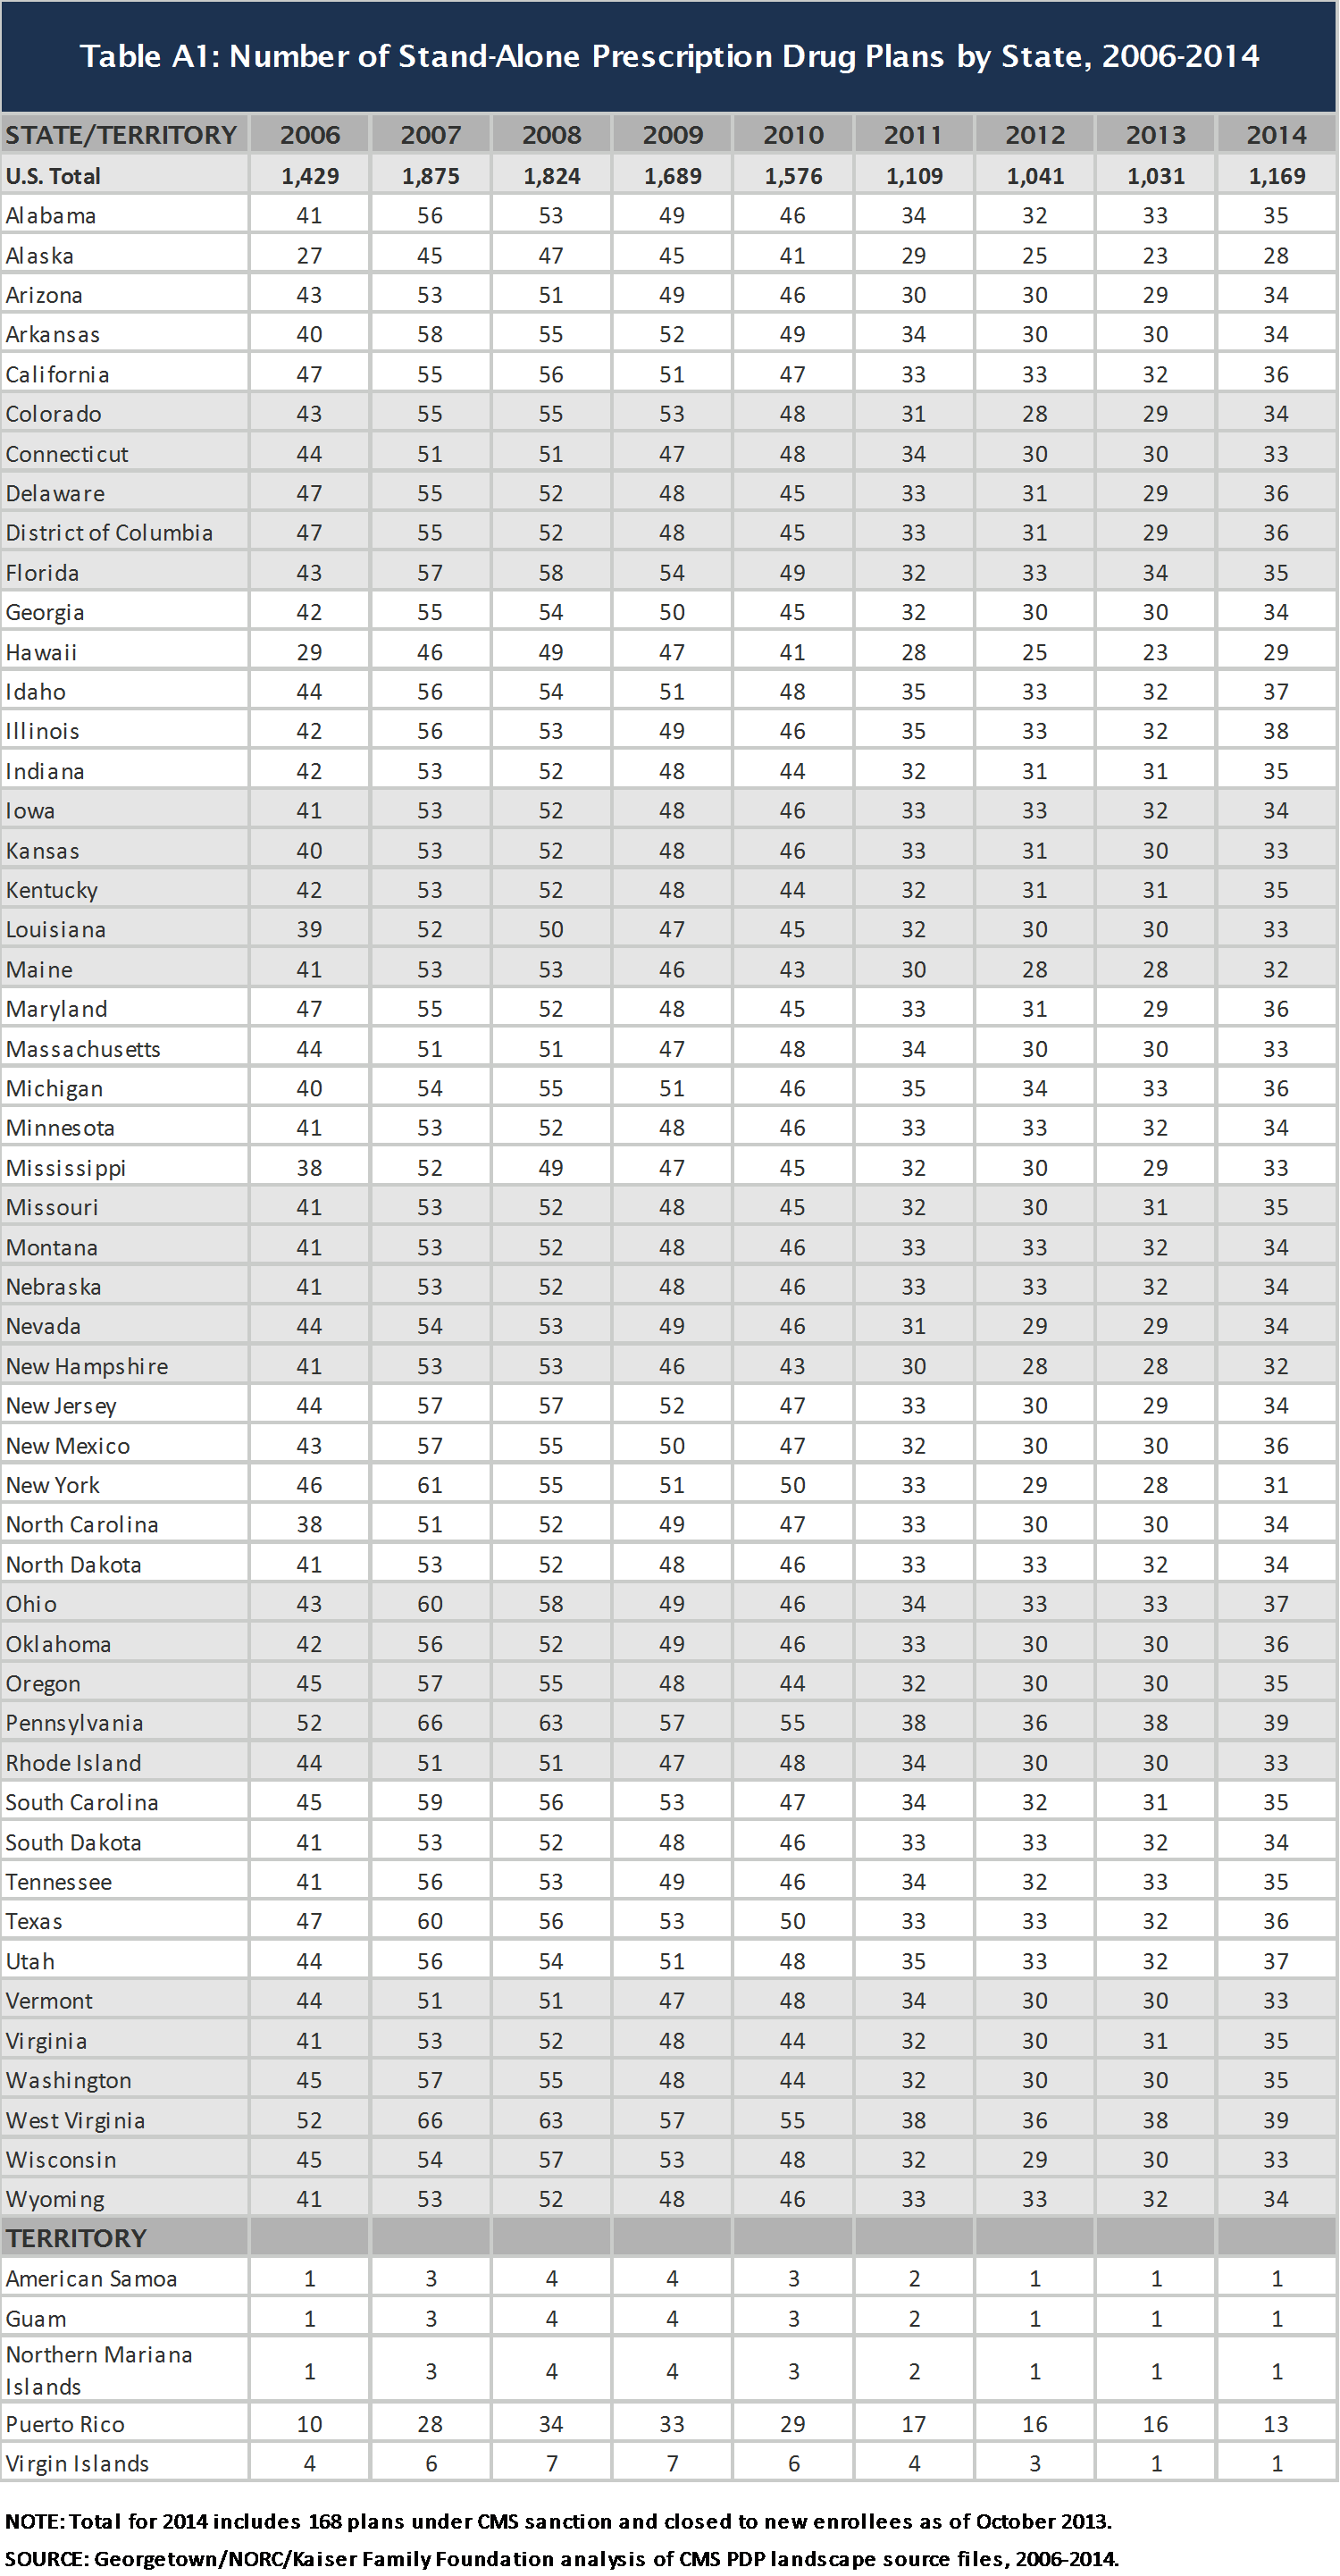
Table A1: Number of Stand-Alone Prescription Drug Plans by State, 2006-2014
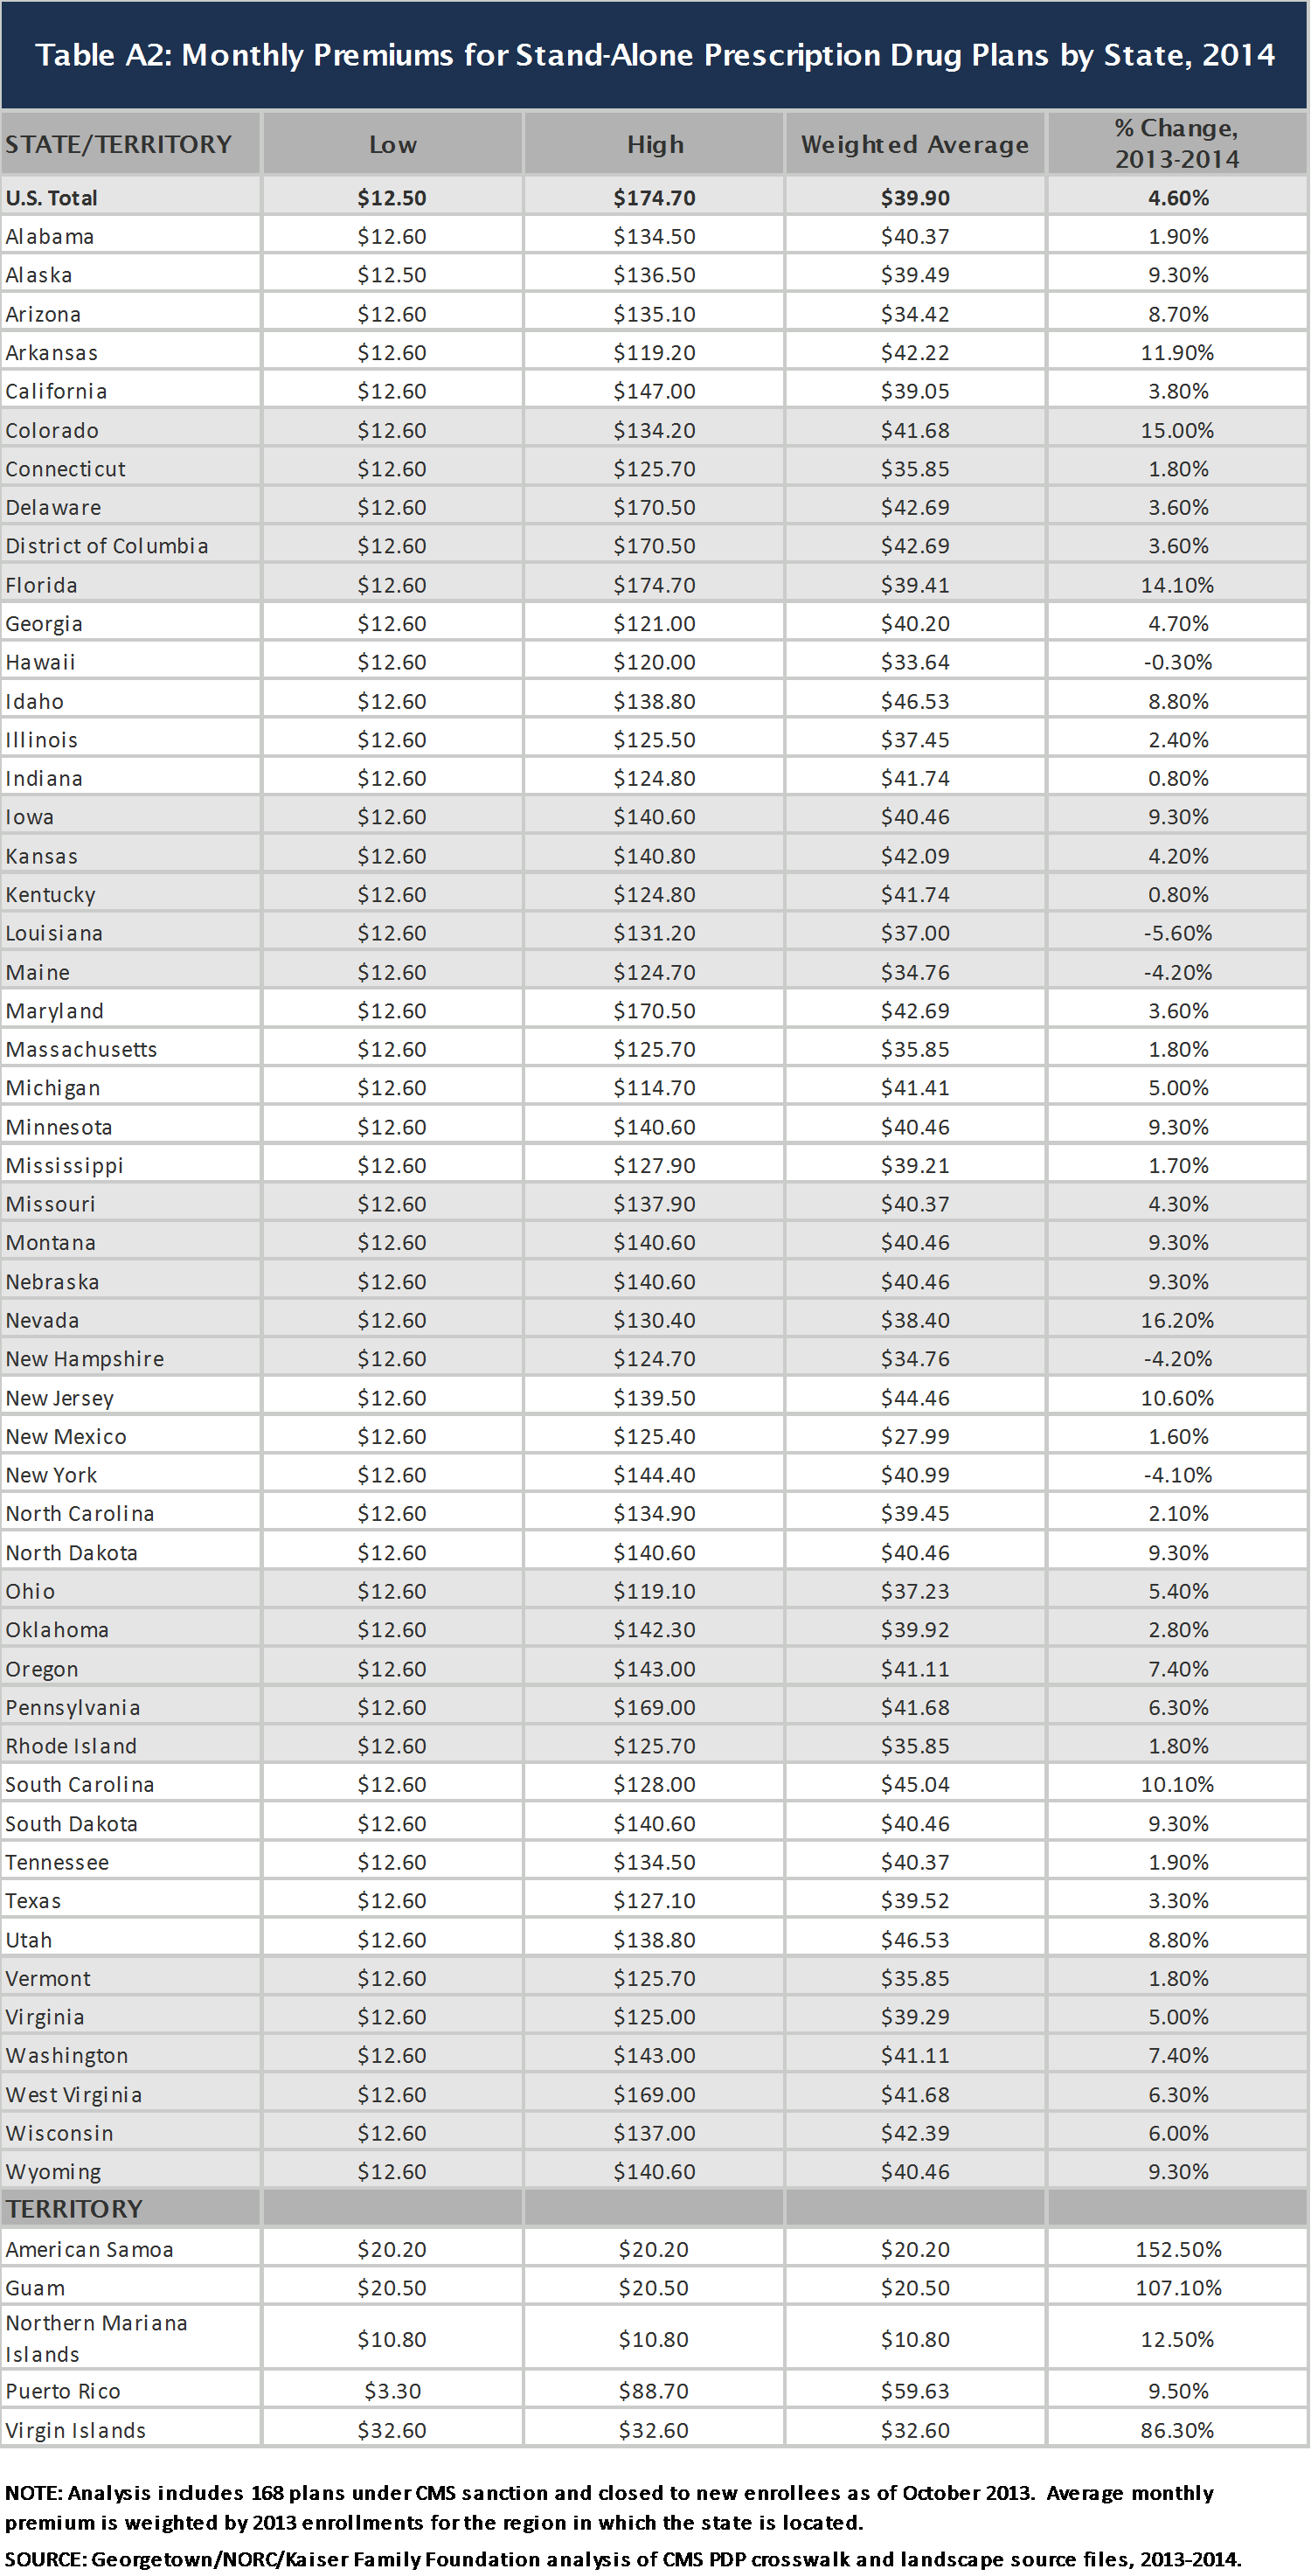
Table A2: Monthly Premiums for Stand-Alone Prescription Drug Plans by State, 2014

Table A3: Number of Stand-Alone Prescription Drug Plans With No Coverage in the Gap by State, 2006-2014
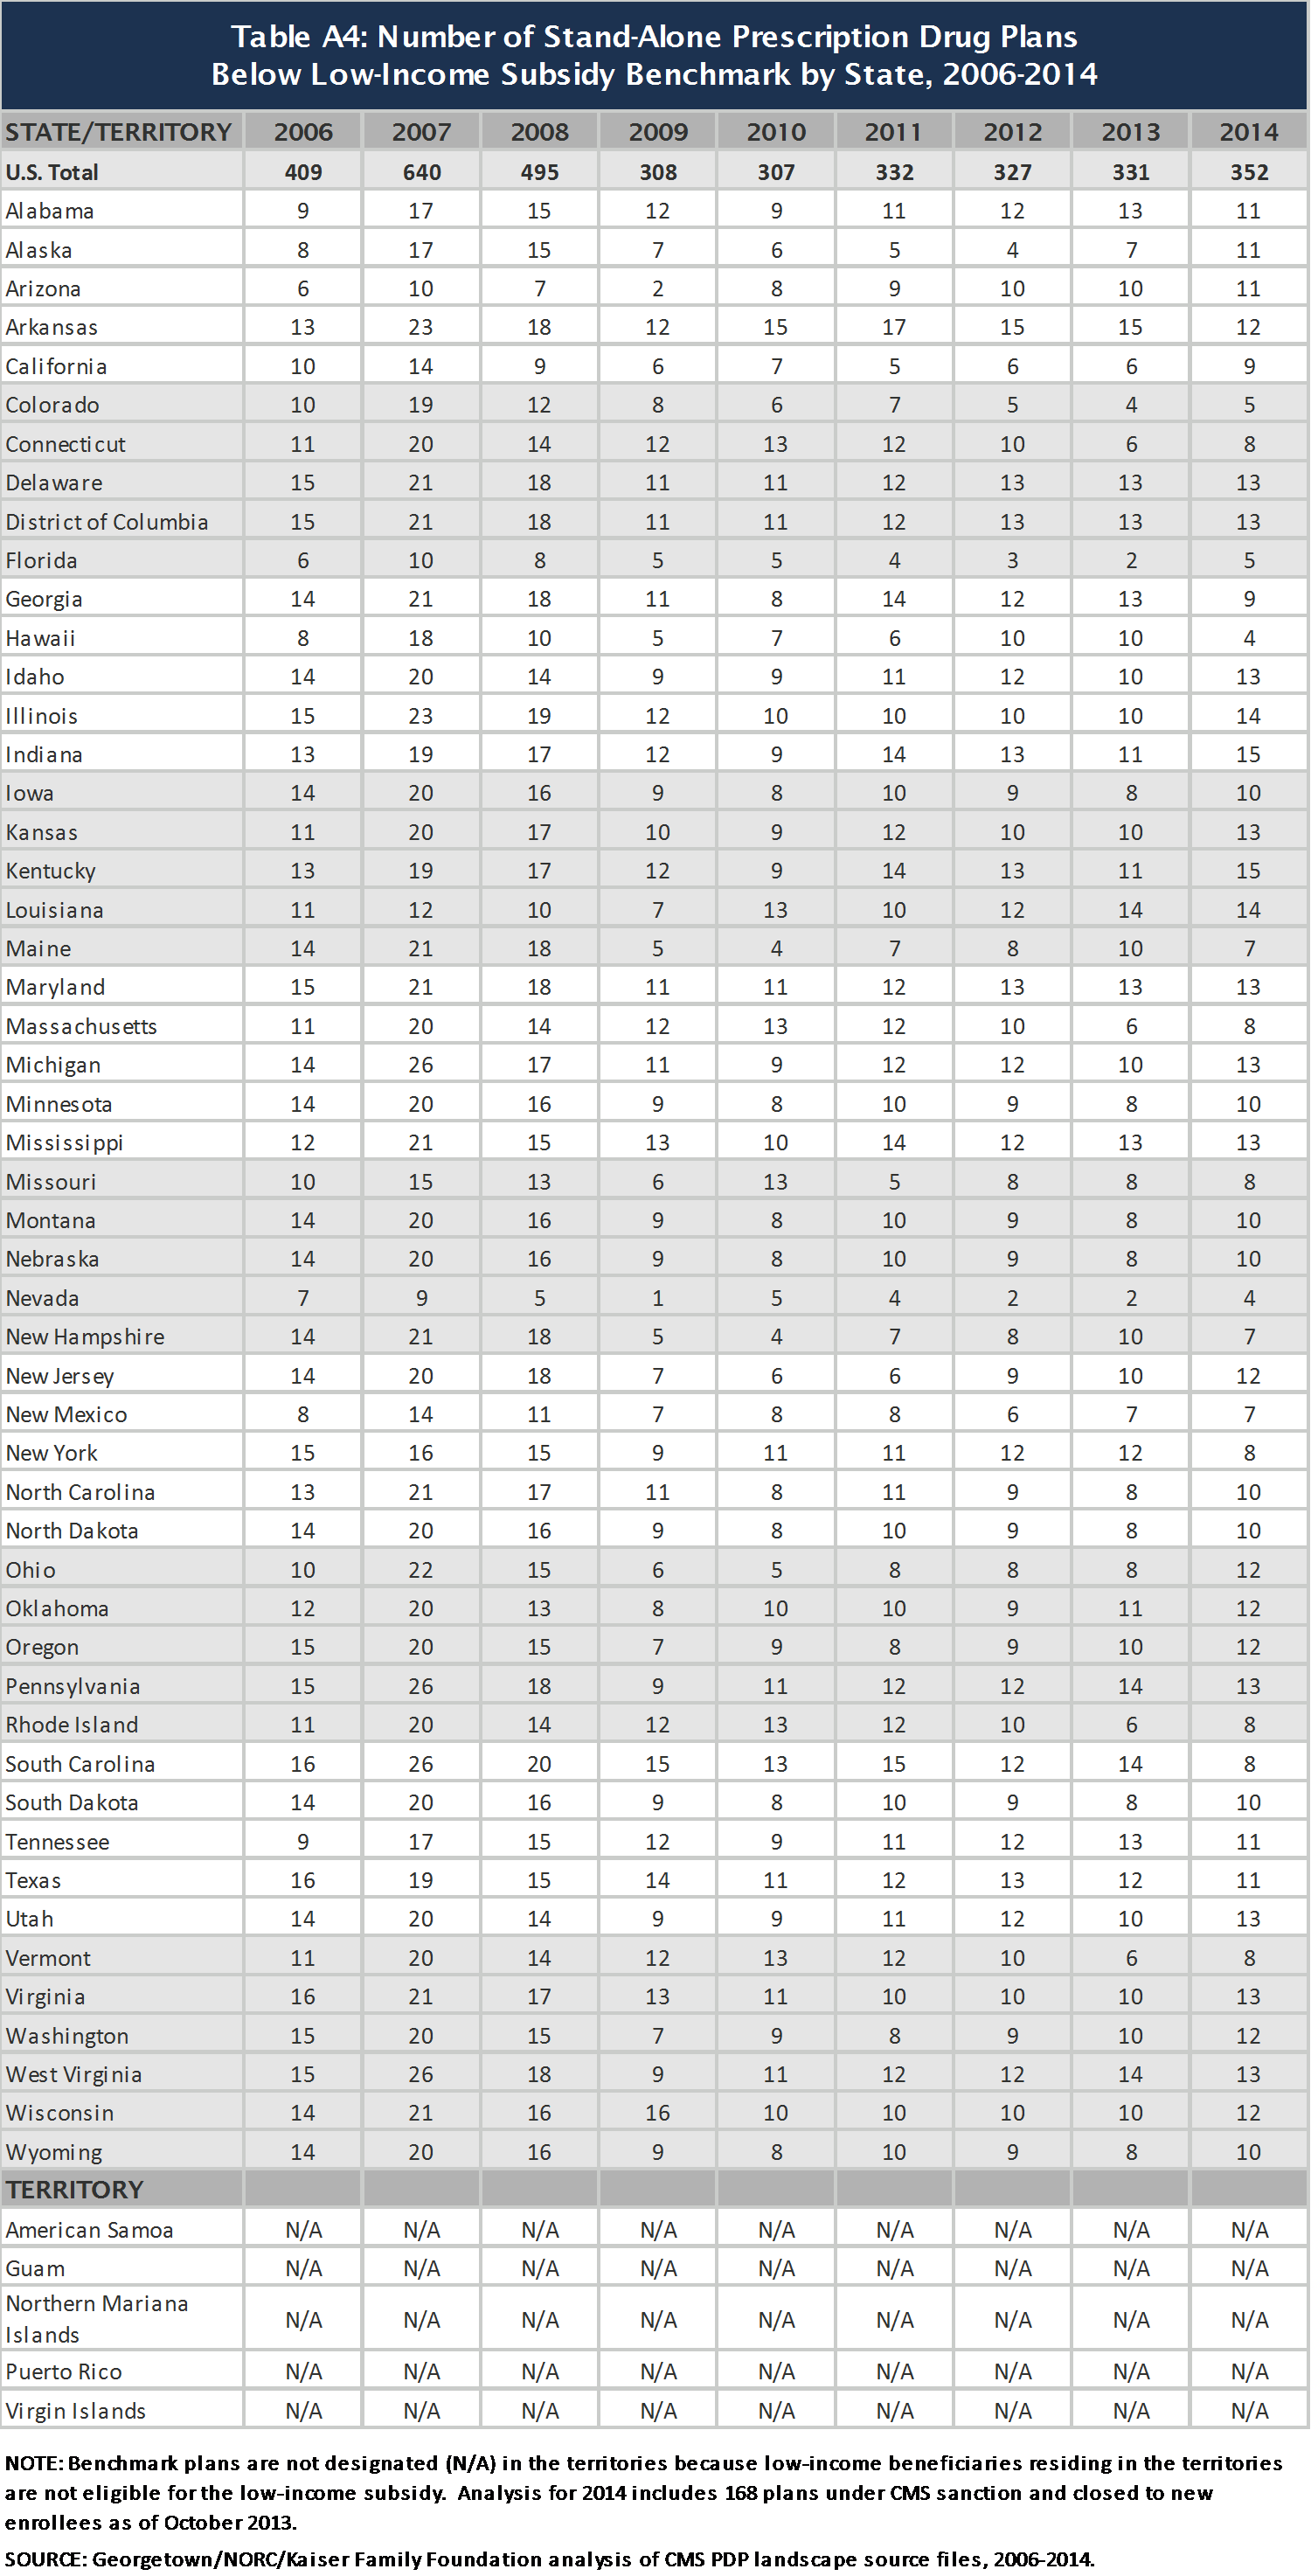
Table A4: Number of Stand-Alone Prescription Drug Plans Below Low-Income Subsidy Benchmark by State, 2006-2014
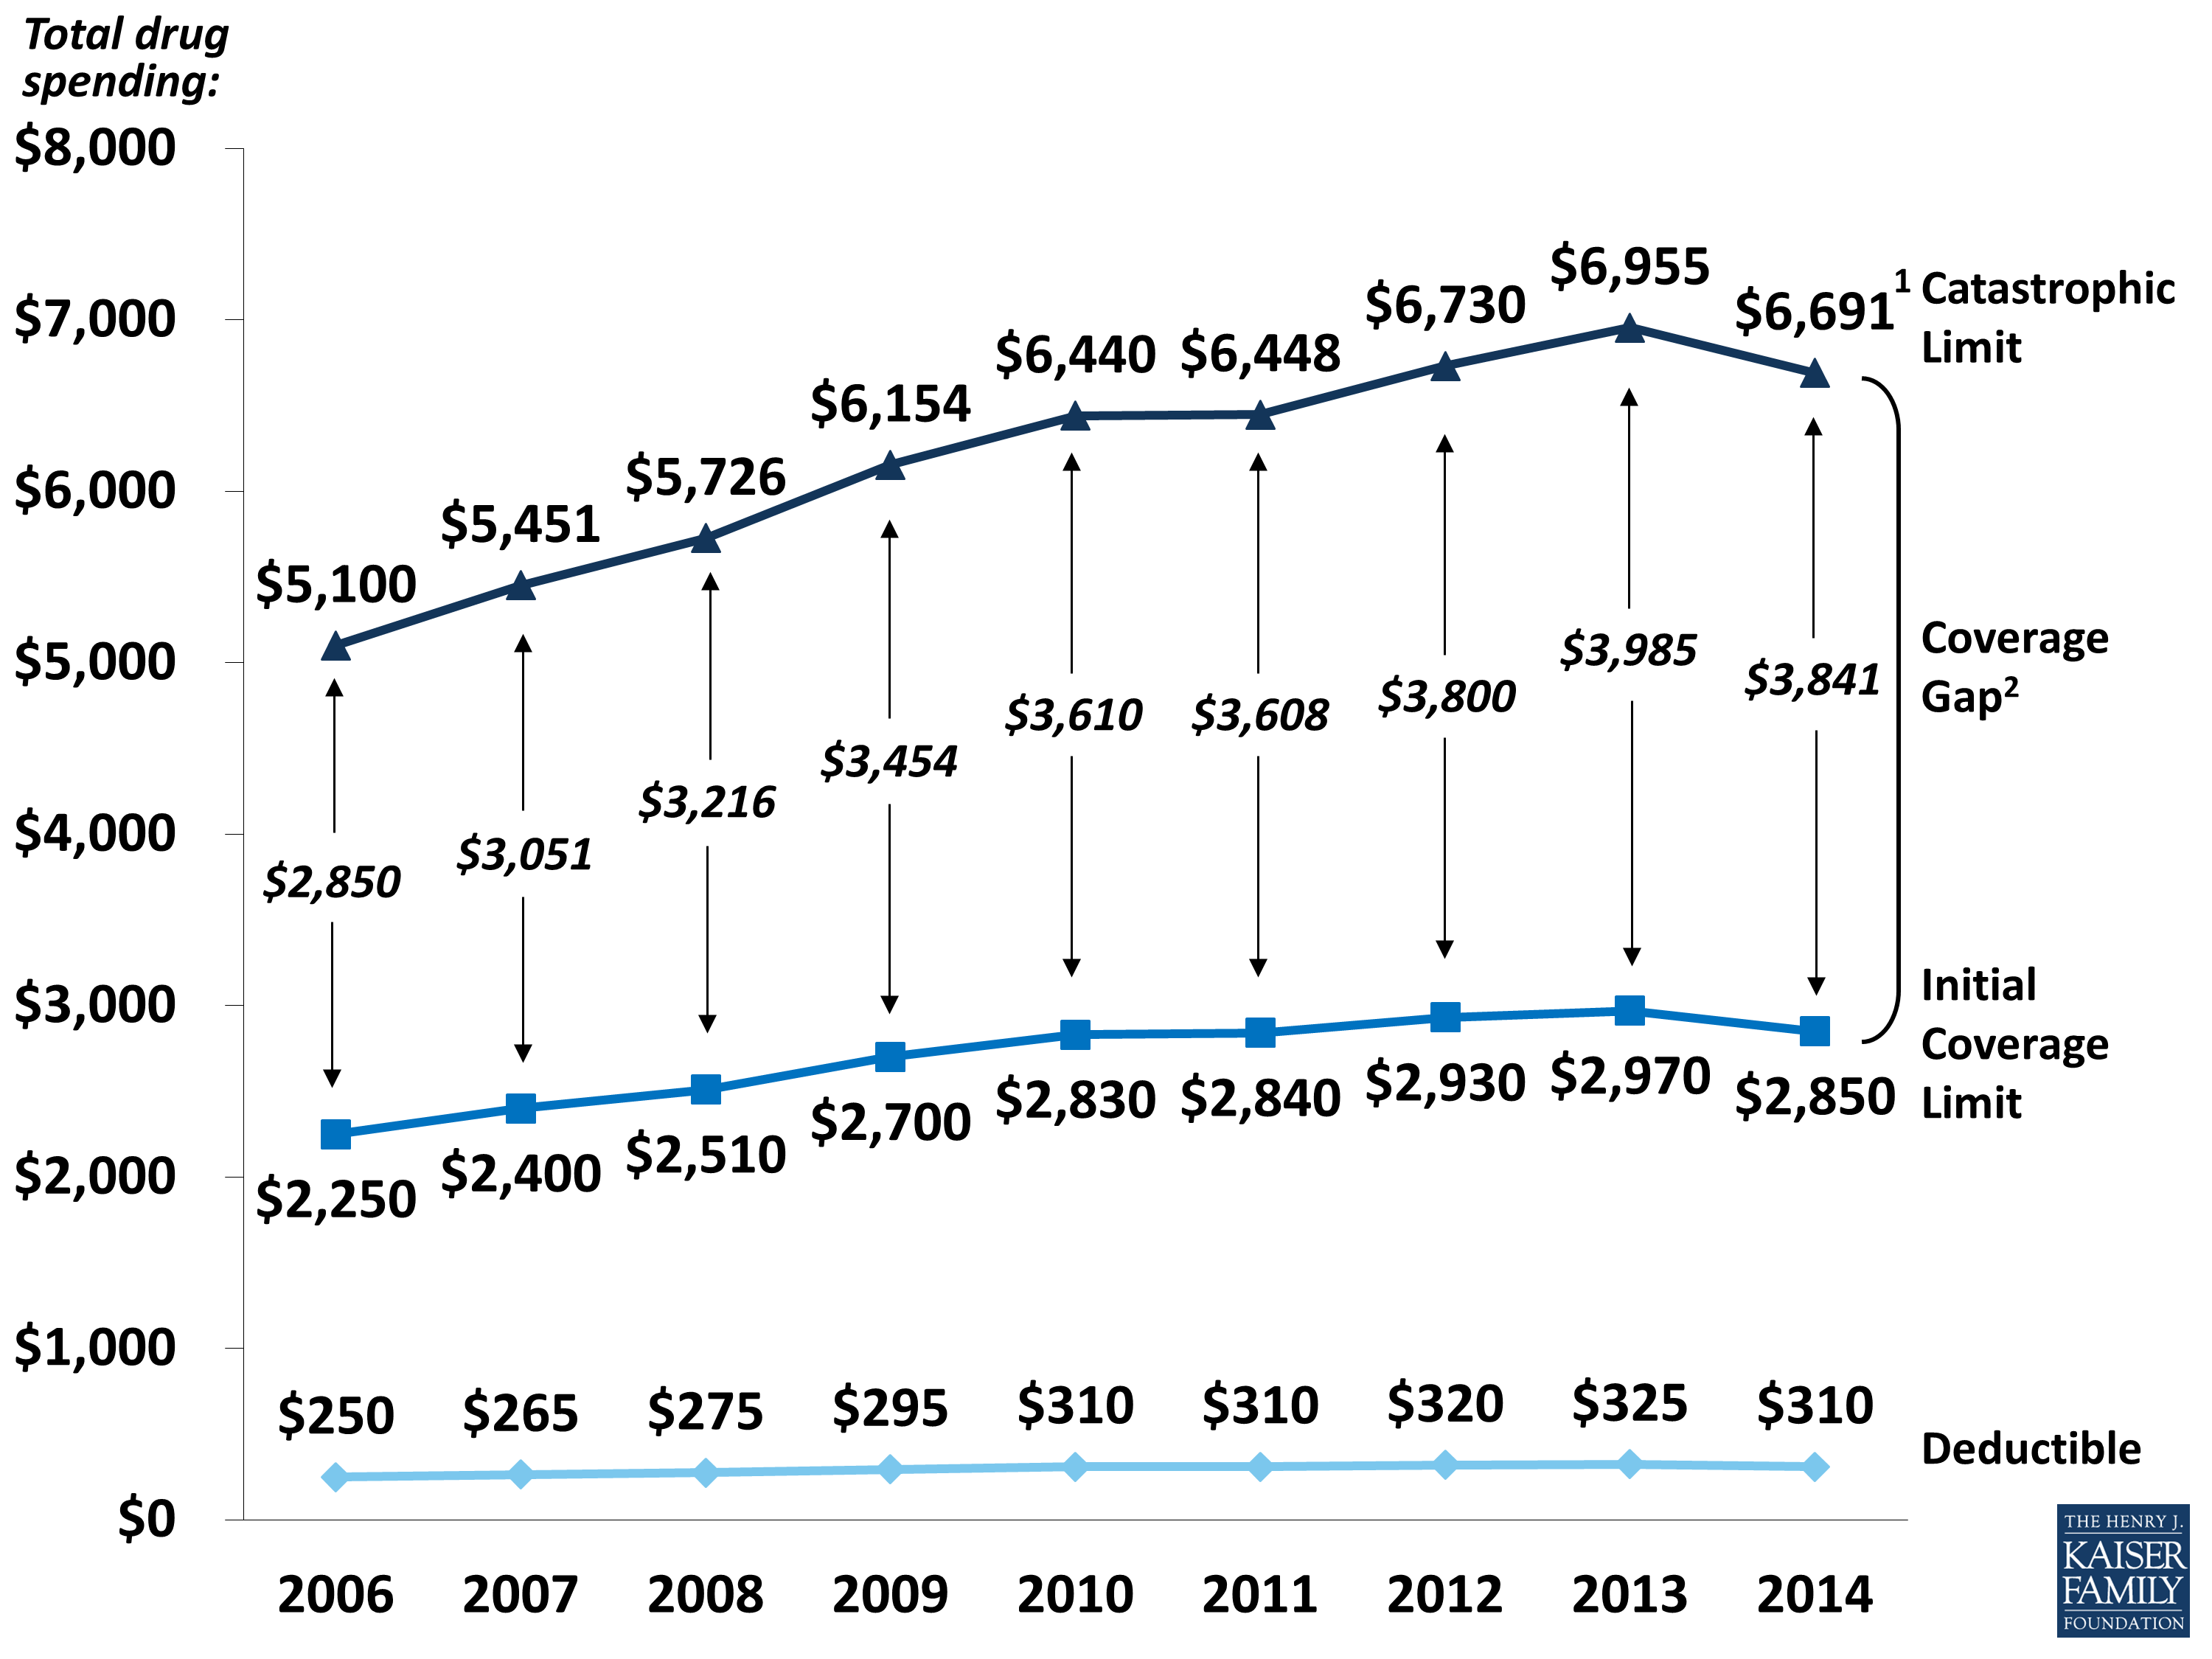
Appendix 2: Medicare Part D Standard Benefit Parameters, 2006-2014
NOTE: Estimates are rounded to nearest whole dollar. 1Amount corresponds to the estimated catastrophic coverage limit for non-Low-Income Subsidy enrollees ($6,455 for LIS enrollees), which corresponds to True Out-of-Pocket (TrOOP) spending of $4,550 (the amount used to determine when an enrollee reaches the catastrophic coverage threshold. 2In 2014, the coverage gap is partially filled by a 50 percent price discount and 2.5 percent plan payment for brand-name drugs and 28 percent plan payment for generic drugs, as required by the Affordable Care Act of 2010.
SOURCE: Kaiser Family Foundation analysis of data from the Centers for Medicare & Medicaid Services.