Medicare Advantage 2016 Data Spotlight: Overview of Plan Changes
| Box 1: Availability of Special Needs Plans in 2016 |
| Special Needs Plans (SNPs) are a type of Medicare Advantage plan that was authorized in 2003 as part of the Medicare Prescription Drug, Improvement and Modernization Act (MMA) to provide a managed care option for beneficiaries with significant or relatively specialized health care needs. Medicare beneficiaries can enroll in a SNP if they are dually eligible for Medicare and Medicaid (D-SNPs), require an institutional-level of care (I-SNPs), or have a severe or chronic condition (C-SNP). Most SNPs are HMOs, but they can also be PPOs.
When SNPs were authorized, there were few requirements beyond those otherwise required of other Medicare Advantage plans. The Medicare Improvements for Patients and Providers Act (MIPPA) of 2008 established additional requirements for SNPs, including requiring all SNPs to provide a care management plan to document how care would be provided for enrollees and requiring C-SNPs to limit enrollment to beneficiaries with specific diagnoses or conditions. As a result of the MIPPA requirements, the number of SNPs declined in 2010. The ACA required D-SNPs to have a contract with the Medicaid agency for every state in which the plan operates, beginning in 2013. Additionally, in 2013, joint federal-state financial alignment demonstrations to improve the coordination of Medicare and Medicaid for dually eligible beneficiaries began to enroll beneficiaries. Today, financial alignment demonstrations are underway in 12 states: California, Colorado, Illinois, Massachusetts, Michigan, Minnesota, New York, Ohio, South Carolina, Texas, Virginia, and Washington. The financial alignment demonstrations could influence the availability of D-SNPs in these states, either increasing or decreasing the availability of SNPs, depending on the design of the demonstration. In 2016, 550 SNPs will be available, similar to 548 plans available in 2015 (Figure 13; Table A7). The availability of SNPs will continue to vary across states in 2016, as it has in prior years. In 2016, at least one SNP of any type will be available in all states but eight (AK, IA, NE, ND, RI, SD, VT, and WY). While Montana did not have SNPs available in 2015, 1 new D-SNP will be available in Montana in 2016, and similarly while New Hampshire did not have SNPs available in 2015, 1 new I-SNP will be available in the state in 2016. In Iowa, Nebraska, and Rhode Island, SNPs were available in 2015 but will not be available in these states in 2016. As in past years, SNPs will be most numerous in selected high population states, notably Florida (94 plans), California (72 plans), and New York (53 plans). The total number of D-SNPs will slightly increase from 339 plans to 342 plans between 2015 and 2016, with some variation across states. In Florida, the number of D-SNPs increased from 49 plans in 2015 to 58 plans in 2016. Other states will experience smaller changes in the availability of D-SNPs. Notably, states with ongoing financial alignment demonstrations to improve the coordination of Medicare and Medicaid for dual eligibles will not see large changes, if any, in the number of available D-SNPs between 2015 and 2016. The total number of C-SNPs will decline from 152 plans in 2015 to 139 plans in 2016, and the total number of I-SNPs will increase from 57 plans in 2015 to 69 plans in 2016. With the exception of Florida where the number of C-SNPs will decrease from 39 plans to 30 plans, no states will experience large changes in the availability of C-SNPs and I-SNPs between 2015 and 2016. Similar to prior years, most C-SNPs (66%) will focus on diabetes, chronic heart failure, or cardiovascular disorders. |
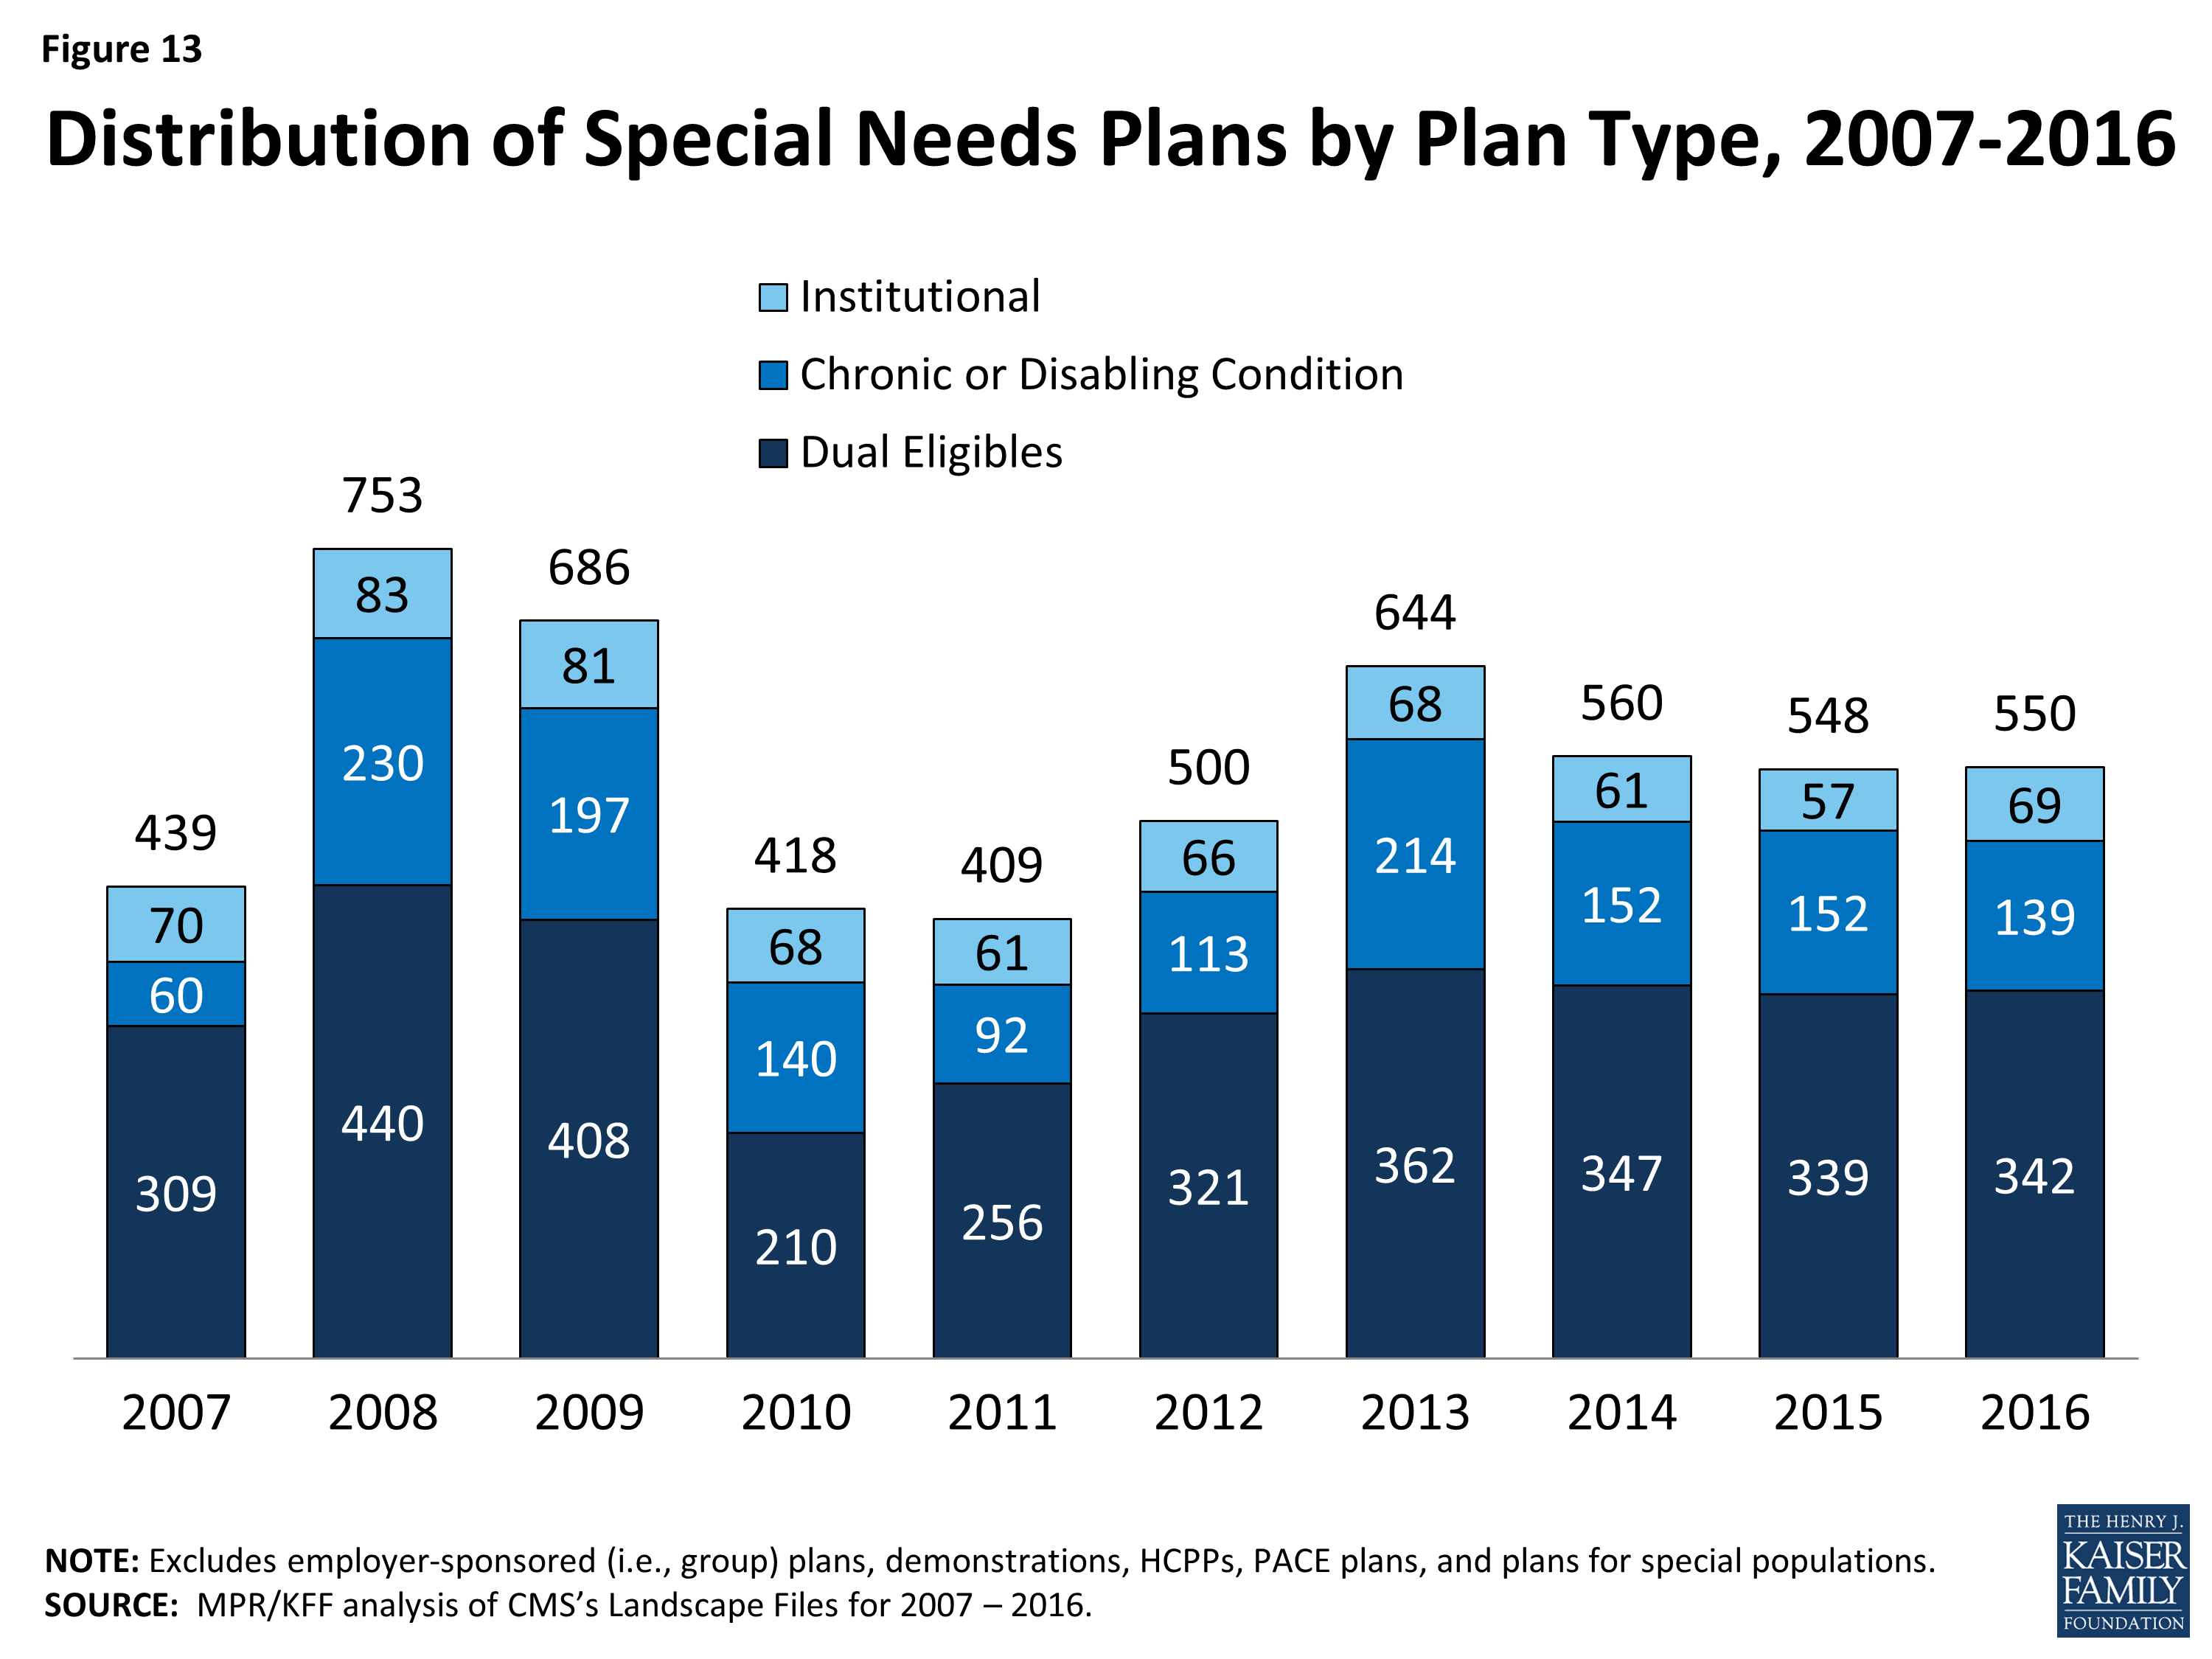
Figure 13: Distribution of Special Needs Plans by Plan Type, 2007-2016
| Table A1. Medicare Advantage Plan Market Entries and Exits, Average Monthly Premiums and Average Out-of-Pocket Spending Limits for Medicare Advantage Prescription Drug plans (MA-PDs), Weighted by 2015 Enrollment, 2015-2016 | |||||||
| All Medicare Advantage Plans (MA-PD and MA-only plans) | All plans | HMO | Local PPO | PFFS | Regional PPO | Cost | MSA |
| 2015 Plan Total | 1,945 | 1,275 | 465 | 69 | 43 | 86 | 7 |
| Total number of staying plans | 1,742 | 1,151 | 413 | 55 | 43 | 79 | 1 |
| Number of staying plans with no service area reductions | 1,565 | 983 | 365 | 33 | 43 | 76 | 1 |
| Number of staying plans with reduced service areas | 111 | 64 | 33 | 14 | – | – | – |
| Number of consolidating plans, post consolidation | 66 | 40 | 15 | 8 | – | 3 | – |
| Total number of departing plans | 203 | 124 | 52 | 14 | – | 7 | 6 |
| Number of plans departing due to consolidation | 78 | 46 | 19 | 10 | – | 3 | – |
| Number of terminating plans | 125 | 78 | 33 | 4 | – | 4 | 6 |
| Number of new plans | 259 | 200 | 48 | 2 | 4 | 2 | 3 |
| 2016 Plan Total | 2,001 | 1,351 | 461 | 57 | 47 | 81 | 4 |
| Total Medicare Advantage enrollees, as of September 2015 | 11,637,572 | 7,988,548 | 1,991,109 | 249,694 | 995,330 | 400,924 | 11,967 |
| Number of staying plans’ enrollees | 11,309,785 | 7,809,203 | 1,865,672 | 239,000 | 995,330 | 399,643 | 937 |
| Number of enrollees losing access to their plan | 327,787 | 179,345 | 125,437 | 10,694 | – | 1,281 | 11,030 |
| Average premiums of MA-PDs, weighted by 2015 enrollment | |||||||
| Premiums for all plans, 2015 | $37.63 | $27.94 | $63.38 | $51.75 | $31.49 | $110.23 | N/A |
| Terminating plans, 2015 | $40.57 | $26.19 | $63.41 | $53.66 | N/A | $58.26 | N/A |
| Staying plans, 2015 | $37.54 | $27.98 | $63.37 | $51.67 | $31.49 | $110.39 | N/A |
| 2016 Premiums for remaining 2015 plans | $40.63 | $30.51 | $68.36 | $58.14 | $33.59 | $116.26 | N/A |
| Change in premiums for plans available in both 2015 and 2016 | $3.09 | $2.52 | $4.98 | $6.47 | $2.10 | $5.86 | N/A |
| Share of enrollees in MA-PDs with no premiums, among plans available in both 2015 and 2016 | |||||||
| 2015 | 48% | 59% | 19% | 8% | 45% | 1% | N/A |
| 2016 | 46% | 56% | 19% | 6% | 45% | 1% | N/A |
| Change in share of plans with no premiums | -2% | -3% | 0% | -1% | 0% | 0% | N/A |
| Average premiums paid per enrollee, among MA-PDs with premiums (excluding zero premium plans) and available in both 2015 and 2016 | |||||||
| 2015 | $72.25 | $68.30 | $77.96 | $55.96 | $57.47 | $111.76 | N/A |
| 2016 | $75.39 | $69.75 | $84.13 | $62.02 | $61.30 | $117.69 | N/A |
| Average out-of-pocket spending limits per year among MA-PDs, weighted by 2015 enrollment, among plans available in both 2015 and 2016 | |||||||
| 2015 | $5,043 | $4,850 | $5,257 | N/A | $6,651 | $3,280 | N/A |
| 2016 | $5,235 | $5,010 | $5,688 | N/A | $6,619 | $3,531 | N/A |
| Change in average out-of-pocket spending limits | $193 | $160 | $431 | N/A | -$32 | $251 | N/A |
| Total MA-PD enrollees, as of September 2015 | 11,038,587 | 7,819,071 | 1,956,315 | 173,839 | 889,195 | 200,167 | – |
| Number of staying MA-PDs’ enrollees | 10,729,142 | 7,644,846 | 1,831,671 | 164,544 | 889,195 | 198,886 | – |
| Number of enrollees losing access to their MA-PD | 309,445 | 174,225 | 124,644 | 9,295 | – | 1,281 | – |
|
NOTE: Excludes Special Needs Plans (SNPs), demonstrations, Health Care Prepayment Plans (HCPPs), Program of All Inclusive Care for the Elderly (PACE) plans, employer-sponsored (i.e., group) plans, and plans for special populations.
SOURCE: Authors’ analysis of CMS’s Landscape Files for 2015 and 2016 and CMS’s 2015 and 2016 Part C and D Crosswalk file and September 2015 enrollment.
|
|||||||
| Table A2. Average Number of Plans Available to Beneficiaries by County of Residence, 2009-2016 | ||||||||
| 2009 | 2010 | 2011 | 2012 | 2013 | 2014 | 2015 | 2016 | |
| National Average | 48 | 33 | 24 | 20 | 20 | 18 | 18 | 19 |
| Metro counties | 51 | 35 | 26 | 22 | 22 | 20 | 20 | 21 |
| Non-metro counties | 36 | 24 | 16 | 13 | 13 | 11 | 10 | 11 |
| Fee-for-Service Costs, by Quartile | ||||||||
| Lowest cost quartile | 45 | 28 | 18 | 17 | 17 | 17 | 15 | 15 |
| Second quartile | 46 | 31 | 20 | 17 | 16 | 15 | 14 | 15 |
| Third quartile | 44 | 30 | 20 | 17 | 18 | 16 | 16 | 17 |
| Highest cost counties | 53 | 37 | 30 | 24 | 24 | 21 | 22 | 23 |
| NOTE: Excludes SNPs, employer-sponsored (i.e., group) plans, demonstrations, HCPPs, PACE plans, and plans for special populations. SOURCE: Authors’ analysis of CMS’s Landscape and Penetration Files for 2009 – 2016. |
||||||||
| Table A3. Unweighted Average Monthly Premiums for Medicare Advantage Prescription Drug Plans, by Plan Type, 2009-2016 | |||||||||
| 2009 | 2010 | 2011 | 2012 | 2013 | 2014 | 2015 | 2016 | Change, 2015-2016 | |
| All Plans | $51.81 | $55.86 | $50.61 | $49.80 | $51.43 | $51.47 | $53.42 | $52.57 | -$0.85 |
| HMOs | $34.52 | $40.11 | $36.24 | $33.20 | $34.11 | $35.37 | $38.28 | $39.14 | $0.86 |
| Local PPOs | $65.12 | $70.17 | $65.72 | $69.14 | $72.57 | $74.92 | $81.02 | $78.61 | -$2.41 |
| PFFS plans | $74.46 | $75.09 | $65.79 | $70.96 | $83.29 | $90.93 | $87.86 | $91.40 | $3.54 |
| Regional PPOs | $55.68 | $59.29 | $53.38 | $55.64 | $56.89 | $59.30 | $67.85 | $74.93 | $7.08 |
|
NOTE: Excludes SNPs, demonstrations, HCPPs, PACE plans, employer-sponsored (i.e., group) plans, and plans for special populations. Premiums include plans with premiums as well as plans with no premiums. Cost plans are included in the total but are not shown separately.
SOURCE: Authors’ analysis of CMS’s Landscape Files for 2009-2016.
|
|||||||||
|
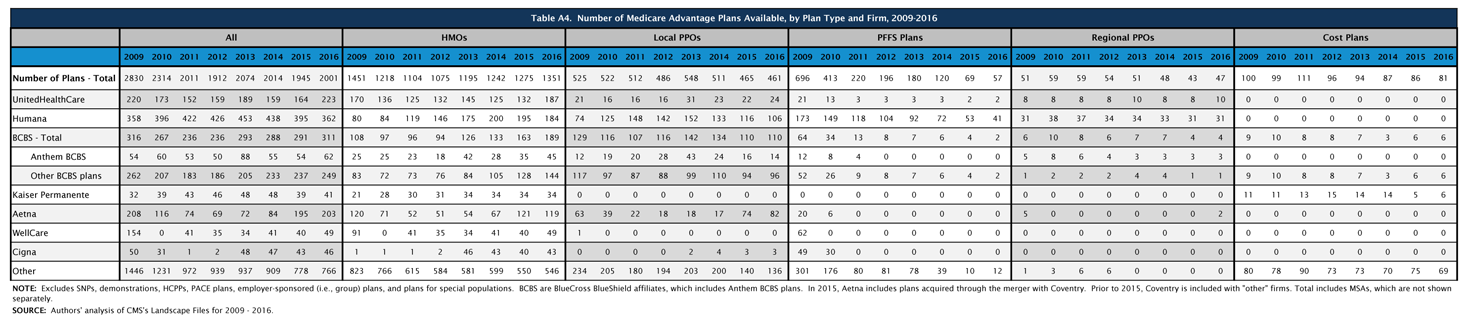
Table A4. Number of Medicare Advantage Plans Available, by Plan Type and Firm, 2009-2016 |
 |
| click on table to enlarge |
|
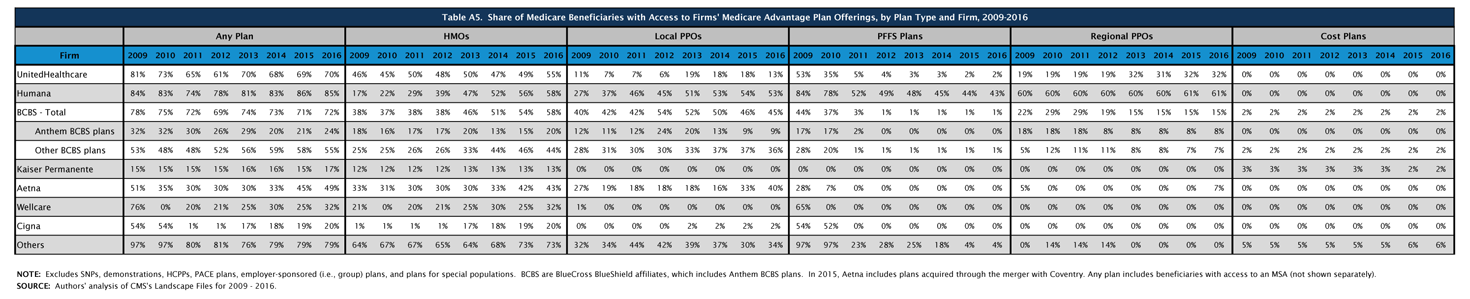
Table A5. Share of Medicare Beneficiaries with Access to Firms’ Medicare Advantage Plan Offerings, by Plan Type and Firm, 2009-2016 |
 |
| click on table to enlarge |
| Table A6. Unweighted Average Monthly Premiums for Medicare Advantage Prescription Drug Plans, by Plan Type and Firm, 2015 and 2016 | ||||||||||||
| 2015 | 2016 | |||||||||||
| All | HMOs | Local PPOs | PFFS Plans | Regional PPOs | Cost Plans | All | HMOs | Local PPOs | PFFS Plans | Regional PPOs | Cost Plans | |
| All Plans Combined | $53.42 | $38.28 | $81.02 | $87.86 | $67.85 | $141.09 | $52.57 | $39.14 | $78.61 | $91.40 | $74.93 | $146.14 |
| UnitedHealthCare | $26.59 | $26.23 | $29.62 | $43.00 | $20.17 | N/A | $26.37 | $24.68 | $35.91 | $50.00 | $32.25 | N/A |
| Humana | $47.42 | $18.73 | $73.09 | $93.90 | $87.29 | N/A | $46.90 | $19.99 | $71.44 | $99.58 | $88.88 | N/A |
| BCBS – Total | $76.14 | $50.34 | $108.93 | $41.95 | $53.03 | $108.40 | $70.64 | $49.55 | $103.87 | $56.48 | $56.97 | $102.27 |
| Anthem BCBS | $37.94 | $12.14 | $80.75 | N/A | $61.50 | N/A | $37.48 | $19.45 | $78.44 | N/A | $65.50 | N/A |
| Other BCBS plans | $85.57 | $61.39 | $114.35 | $41.95 | $36.10 | $108.40 | $79.41 | $59.21 | $108.59 | $56.48 | $39.90 | $102.27 |
| Kaiser Permanente | $48.86 | $47.50 | N/A | N/A | N/A | $72.00 | $52.92 | $52.50 | N/A | N/A | N/A | $57.67 |
| Aetna | $37.68 | $31.34 | $47.46 | N/A | N/A | N/A | $43.01 | $33.86 | $52.90 | N/A | $154.00 | N/A |
| WellCare | $7.10 | $7.10 | N/A | N/A | N/A | N/A | $5.60 | $5.60 | N/A | N/A | N/A | N/A |
| CIGNA | $23.89 | $23.34 | $33.75 | N/A | N/A | N/A | $28.24 | $27.96 | $33.75 | N/A | N/A | N/A |
| Other | $61.72 | $49.11 | $90.15 | $64.40 | N/A | $148.04 | $62.90 | $51.58 | $87.25 | $76.94 | N/A | $160.33 |
|
NOTE: Excludes SNPs, demonstrations, HCPPs, PACE plans, employer-sponsored (i.e., group) plans, and plans for special populations. BCBS are BlueCross BlueShield affiliates, which includes Anthem BCBS plans. In 2015, Aetna includes plans acquired through the merger with Coventry. Premiums include plans with premiums as well as plans with no premiums. N/A indicates plan not available.
SOURCE: Authors’ analysis of CMS’s Landscape Files for 2015 and 2016.
|
||||||||||||
| Table A7. Number and Type of Special Needs Plans, by State, 2015 and 2016 | |||||||||||||||||
| 2015 | 2016 | ||||||||||||||||
| State | Overall | Dual eligibles | Institutional | Chronic conditions | Overall | Dual eligibles | Institutional | Chronic conditions | |||||||||
| Alabama | 5 | 4 | 1 | 0 | 6 | 4 | 2 | 0 | |||||||||
| Alaska | 0 | 0 | 0 | 0 | 0 | 0 | 0 | 0 | |||||||||
| Arizona | 34 | 22 | 2 | 10 | 33 | 21 | 4 | 8 | |||||||||
| Arkansas | 8 | 5 | 0 | 3 | 7 | 4 | 0 | 3 | |||||||||
| California | 69 | 29 | 2 | 38 | 72 | 31 | 4 | 37 | |||||||||
| Colorado | 8 | 4 | 3 | 1 | 9 | 4 | 3 | 2 | |||||||||
| Connecticut | 3 | 2 | 1 | 0 | 4 | 2 | 2 | 0 | |||||||||
| Delaware | 4 | 1 | 2 | 1 | 3 | 1 | 1 | 1 | |||||||||
| District of Columbia | 7 | 3 | 2 | 2 | 5 | 2 | 1 | 2 | |||||||||
| Florida | 92 | 49 | 4 | 39 | 94 | 58 | 6 | 30 | |||||||||
| Georgia | 16 | 10 | 2 | 4 | 14 | 8 | 2 | 4 | |||||||||
| Hawaii | 4 | 4 | 0 | 0 | 5 | 5 | 0 | 0 | |||||||||
| Idaho | 1 | 1 | 0 | 0 | 1 | 1 | 0 | 0 | |||||||||
| Illinois | 10 | 6 | 1 | 3 | 10 | 5 | 2 | 3 | |||||||||
| Indiana | 8 | 3 | 1 | 4 | 8 | 4 | 2 | 2 | |||||||||
| Iowa | 3 | 1 | 0 | 2 | 0 | 0 | 0 | 0 | |||||||||
| Kansas | 2 | 0 | 1 | 1 | 2 | 0 | 1 | 1 | |||||||||
| Kentucky | 10 | 6 | 0 | 4 | 13 | 8 | 1 | 4 | |||||||||
| Louisiana | 14 | 10 | 0 | 4 | 13 | 9 | 0 | 4 | |||||||||
| Maine | 3 | 3 | 0 | 0 | 4 | 2 | 1 | 1 | |||||||||
| Maryland | 9 | 2 | 3 | 4 | 10 | 3 | 3 | 4 | |||||||||
| Massachusetts | 10 | 6 | 3 | 1 | 9 | 7 | 1 | 1 | |||||||||
| Michigan | 12 | 8 | 3 | 1 | 6 | 4 | 1 | 1 | |||||||||
| Minnesota | 9 | 9 | 0 | 0 | 9 | 9 | 0 | 0 | |||||||||
| Mississippi | 8 | 6 | 0 | 2 | 6 | 4 | 0 | 2 | |||||||||
| Missouri | 10 | 4 | 2 | 4 | 12 | 3 | 5 | 4 | |||||||||
| Montana | 0 | 0 | 0 | 0 | 1 | 1 | 0 | 0 | |||||||||
| Nebraska | 1 | 0 | 0 | 1 | 0 | 0 | 0 | 0 | |||||||||
| Nevada | 6 | 0 | 0 | 6 | 7 | 0 | 1 | 6 | |||||||||
| New Hampshire | 0 | 0 | 0 | 0 | 1 | 0 | 1 | 0 | |||||||||
| New Jersey | 8 | 3 | 4 | 1 | 9 | 4 | 3 | 2 | |||||||||
| New Mexico | 7 | 4 | 2 | 1 | 3 | 2 | 1 | 0 | |||||||||
| New York | 56 | 40 | 10 | 6 | 53 | 37 | 11 | 5 | |||||||||
| North Carolina | 11 | 6 | 1 | 4 | 14 | 7 | 2 | 5 | |||||||||
| North Dakota | 0 | 0 | 0 | 0 | 0 | 0 | 0 | 0 | |||||||||
| Ohio | 18 | 11 | 3 | 4 | 18 | 11 | 4 | 3 | |||||||||
| Oklahoma | 1 | 0 | 1 | 0 | 1 | 0 | 1 | 0 | |||||||||
| Oregon | 12 | 7 | 4 | 1 | 11 | 7 | 3 | 1 | |||||||||
| Pennsylvania | 21 | 10 | 6 | 5 | 21 | 11 | 6 | 4 | |||||||||
| Puerto Rico | 16 | 12 | 0 | 4 | 15 | 13 | 0 | 2 | |||||||||
| Rhode Island | 1 | 0 | 1 | 0 | 0 | 0 | 0 | 0 | |||||||||
| South Carolina | 8 | 3 | 1 | 4 | 8 | 3 | 1 | 4 | |||||||||
| South Dakota | 0 | 0 | 0 | 0 | 0 | 0 | 0 | 0 | |||||||||
| Tennessee | 7 | 6 | 1 | 0 | 8 | 7 | 1 | 0 | |||||||||
| Texas | 31 | 21 | 3 | 7 | 31 | 22 | 2 | 7 | |||||||||
| Utah | 2 | 2 | 0 | 0 | 2 | 2 | 0 | 0 | |||||||||
| Vermont | 0 | 0 | 0 | 0 | 0 | 0 | 0 | 0 | |||||||||
| Virginia | 11 | 2 | 4 | 5 | 9 | 2 | 3 | 4 | |||||||||
| Washington | 6 | 5 | 1 | 0 | 8 | 6 | 2 | 0 | |||||||||
| West Virginia | 1 | 1 | 0 | 0 | 1 | 1 | 0 | 0 | |||||||||
| Wisconsin | 19 | 15 | 3 | 1 | 18 | 13 | 4 | 1 | |||||||||
| Wyoming | 0 | 0 | 0 | 0 | 0 | 0 | 0 | 0 | |||||||||
| Total, U.S. | 548 | 339 | 57 | 152 | 550 | 342 | 69 | 139 | |||||||||
|
NOTE: Columns do not sum to U.S. total because some SNPs overlap state boundaries.
SOURCE: Authors’ analysis of CMS’s Landscape Files for 2015-2016.
|
|||||||||||||||||