Wide Disparities in the Income and Assets of People on Medicare by Race and Ethnicity: Now and in the Future
Executive Summary
Executive Summary
People on Medicare, including seniors and younger adults with disabilities, often live on fixed incomes supplemented by the savings they accumulated during their working years.1 ,2 A person’s ability to build wealth depends on many factors, including their education, health status, marital status, number of work years, household income, periods of unemployment, years of homeownership, access to employer retirement benefits, inheritance, and other financial supports. These financial experiences for individuals during their working years differ by race/ethnicity, which in turn leads to differences across race/ethnicity in income and wealth in retirement.3 ,4
Many people on Medicare live on limited incomes, and have relatively modest savings and home equity.5 In 2012, half of all Medicare beneficiaries had less than $22,500 in income and half had less than $63,100 in savings.6 Further, the outlook for the next generation of Medicare beneficiaries is not expected to be much brighter. The increase in Social Security’s full retirement age from 65 to 67 means that Social Security will replace a smaller portion of the income of future seniors claiming benefits at the same age as current seniors. The historic shift from defined benefit pensions to defined contribution pensions means that fewer future Medicare beneficiaries will have guaranteed, defined benefit pension income from former employers, and more will rely on less secure sources of income, particularly if investments in employer-sponsored defined contribution plans (e.g., 401K plans) are tied to fluctuations in the economy and stock market.7 Between 1988 and 2012, the share of employers that offered retiree health benefits fell from 66 percent to 25 percent.8 If this trend continues, fewer future Medicare beneficiaries will have retiree health benefits and more will be responsible for paying Medicare premiums and out-of-pocket costs. Furthermore, rising budget deficits will increase pressure to reduce spending, increase taxes, or both. Numerous deficit reduction packages have included reductions in Medicare spending and Social Security benefits, and increases in out-of-pocket health care costs for Medicare beneficiaries, which could further erode the economic security of many vulnerable Americans.
This report includes important distributional information about the means of current and future Medicare beneficiaries. It updates and complements our prior work in this area by focusing on differences in the income and assets of people on Medicare by race/ethnicity, using data from the DYNASIM microsimulation model developed by researchers at the Urban Institute. A table summarizing the income and assets of Medicare beneficiaries in 2012 and 2030, by selected demographic characteristics, is included in Table A1. Data are rounded to the nearest $50 and are presented on a per person basis, rather than per household; for married people on Medicare, income and assets are divided equally between spouses to calculate per capita income, savings, and home equity. More information about the methodology can be found in the Appendix. This analysis provides new information about disparities in incomes and assets among the Medicare population by race and ethnicity to inform ongoing discussions about potential changes to Medicare, Medicaid, Social Security and other policy proposals that could have important implications for the economic security of current and future Medicare beneficiaries.
Key Findings
Income and Assets among Medicare Beneficiaries in 2012, by Race/Ethnicity
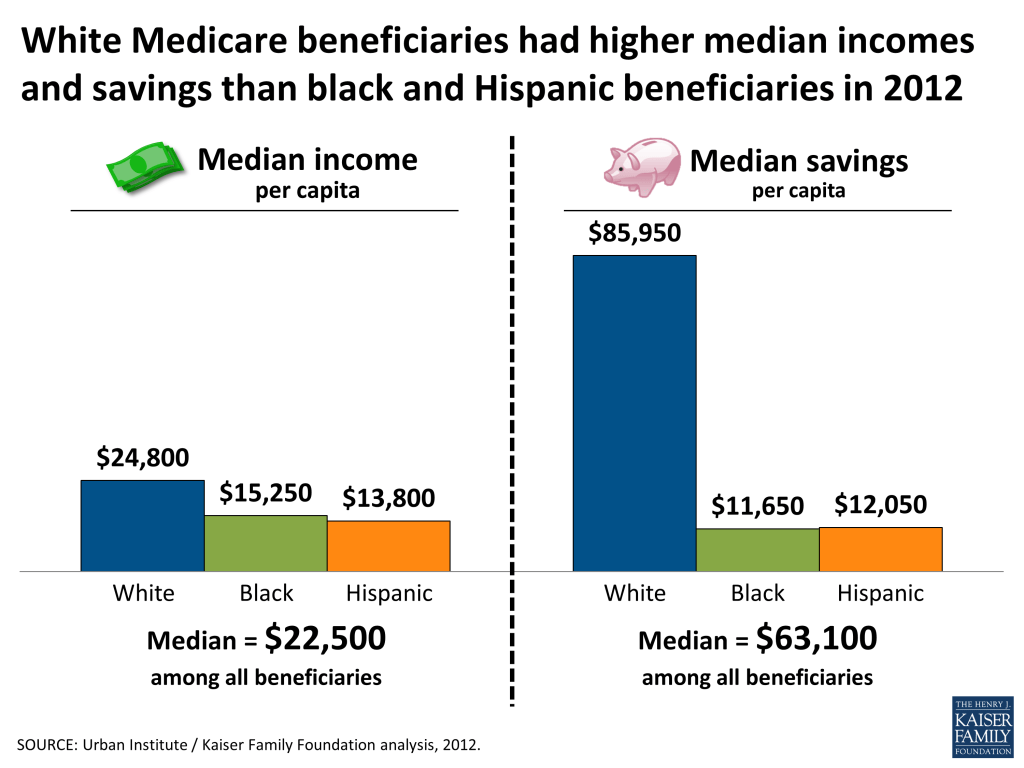
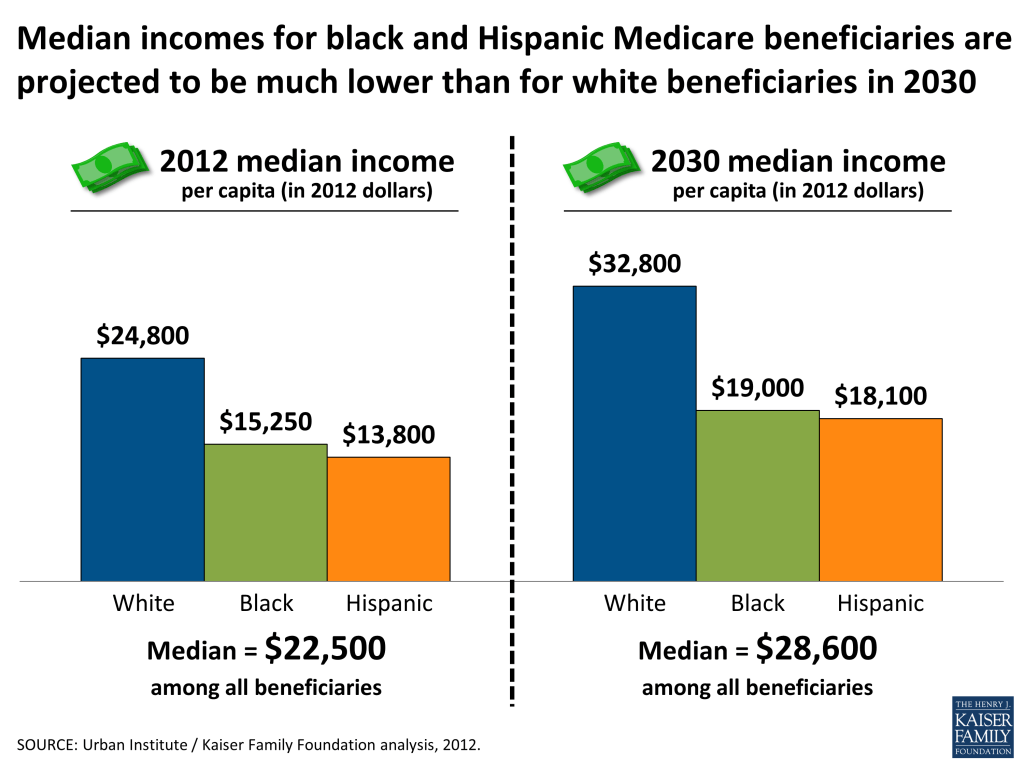
- Half of all Medicare beneficiaries had annual incomes below $22,500 in 2012; median income was considerably lower among black and Hispanic Medicare beneficiaries ($15,250 and $13,800, respectively) than among white beneficiaries ($24,800).
- While the top 10 percent of black and Hispanic beneficiaries had incomes above $43,900 and $44,550, respectively, the top 10 percent of white beneficiaries had incomes above $70,000 in 2012.
- Even among Medicare beneficiaries with a college degree, median income was substantially lower among black and Hispanic beneficiaries ($29,200 and $34,800, respectively) than among white beneficiaries ($41,400).
- Nearly all (92%) Medicare beneficiaries had some savings (such as retirement account holdings and other financial assets), but rates were higher among white beneficiaries (95%) than among black and Hispanic beneficiaries (80% and 81%, respectively) in 2012. In other words, about one in five black and Hispanic beneficiaries had no savings or were in debt.
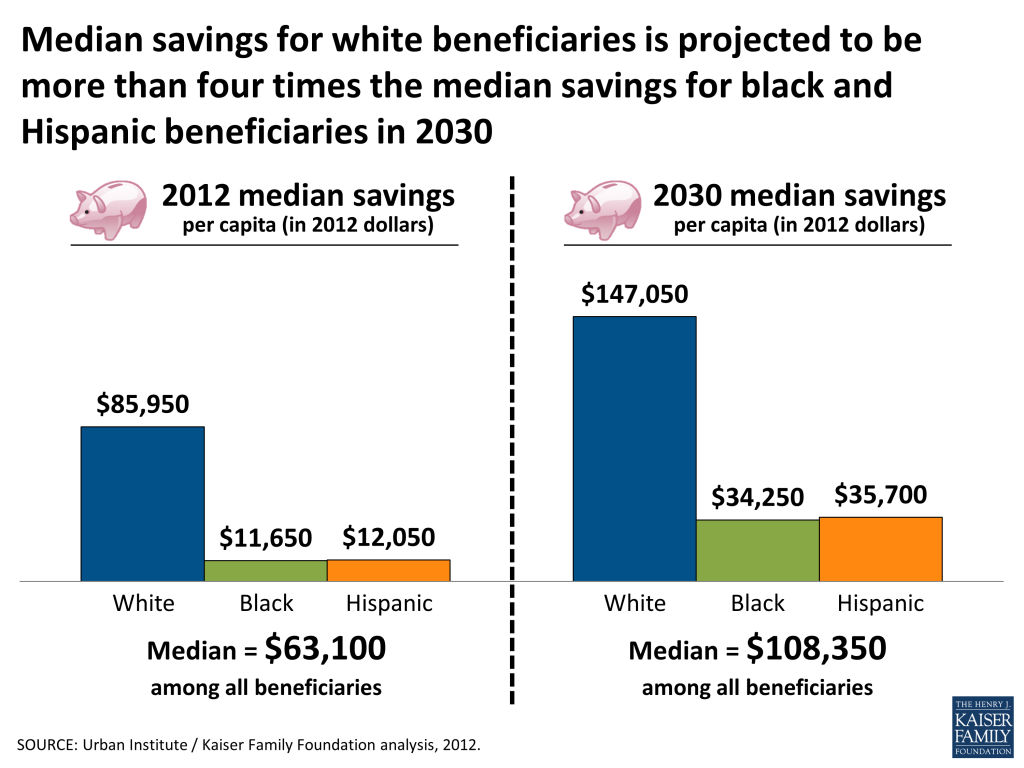
- Half of all beneficiaries had less than $63,100 in savings in 2012; median savings for white beneficiaries ($85,950) were more than seven times the median savings for black beneficiaries ($11,650) and Hispanic beneficiaries ($12,050).
- Among beneficiaries with savings, half had less than $77,500 in savings in 2012; median savings for white beneficiaries ($95,900) were nearly five times the median savings for black beneficiaries ($19,700) and nearly four times the median savings for Hispanic beneficiaries ($25,150).
- The majority (78%) of Medicare beneficiaries had some home equity, but the share was lower among black and Hispanic Medicare beneficiaries (61% and 60%, respectively) than among white beneficiaries (83%) in 2012.
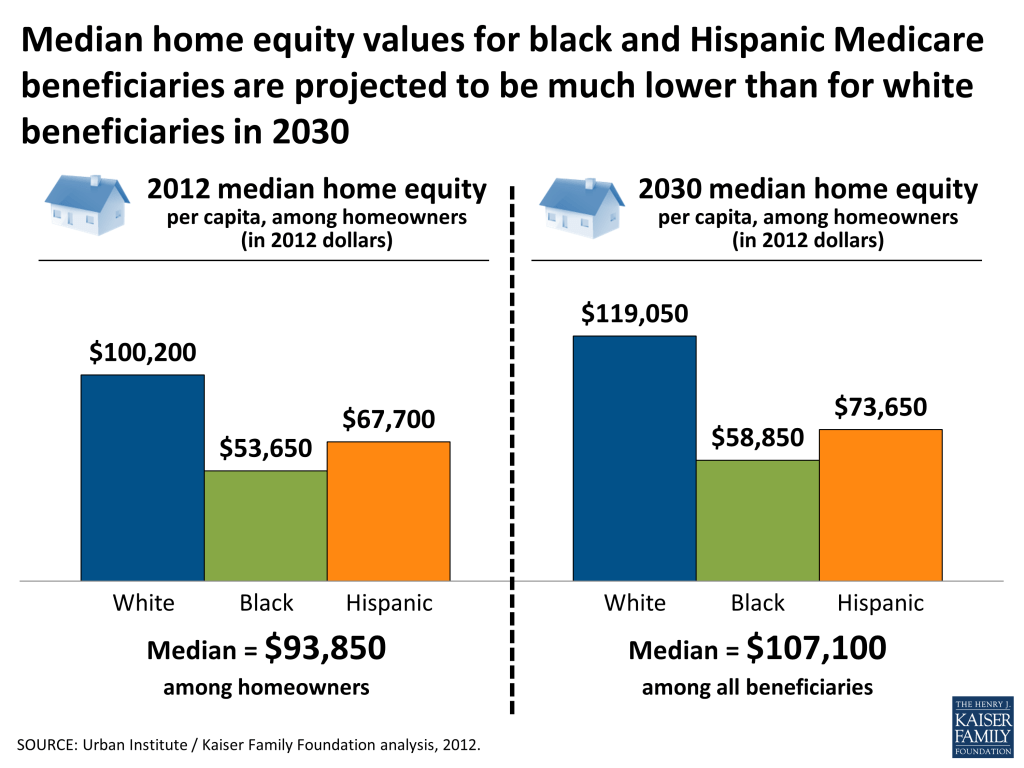
- Among beneficiaries with home equity, half had less than $93,850 in home equity in 2012; the median home equity values were substantially lower among black and Hispanic beneficiaries ($53,650 and $67,700, respectively) than among white beneficiaries ($100,200) in 2012.
Projected Growth in Income, Savings, and Home Equity, by Race and Ethnicity, 2012-2030
- In 2030, median incomes for black and Hispanic beneficiaries ($19,000 and $18,100, respectively) are projected to be substantially lower than for white Medicare beneficiaries ($32,800), in inflation-adjusted 2012 dollars.
- Savings rates, and median savings, are projected to rise for white, black, and Hispanic beneficiaries so that by 2030, a higher share of each racial/ethnic group will have some savings.
- However, median savings for white beneficiaries ($147,050) is projected to be more than four times higher than for black and Hispanic beneficiaries ($34,250 and $35,700, respectively) by 2030, in inflation-adjusted dollars. Median savings among those with savings is projected to be more than three times higher for white beneficiaries ($156,650) than for black and Hispanic beneficiaries ($44,500 and $48,400, respectively) in 2030.
- In 2030, the share of white beneficiaries with any home equity (85%) is projected to continue to be higher than the share among black and Hispanic beneficiaries (67% and 65%, respectively).
- Median per capita home equity values, among beneficiaries with home equity, are projected to be substantially higher for white beneficiaries ($119,050) than for black and Hispanic beneficiaries ($58,850 and $73,650, respectively) in 2030.
Discussion
These findings present a sobering story. Building on prior research documenting modest income and assets for many Medicare beneficiaries, with wealth concentrated among a very small share of the Medicare population, this analysis reveals significant disparities in income, savings, and home equity among Medicare beneficiaries by race and ethnicity. Looking to the future, the Medicare population of 2030 is projected to have somewhat higher incomes and savings than the current generation, but at the median, the gains are predicted to be modest for the overall Medicare population, especially for black and Hispanic beneficiaries. A clear understanding of the economic realities of the Medicare population provides an important context for designing and assessing Medicare, Social Security, Medicaid and other policy proposals that could strengthen or weaken the economic security of older Americans.
Report: Section 1: Income
This section describes the income of the Medicare population in 2012 across race/ethnicity. Income takes into account Social Security, pensions, earnings, and other income sources, including income from assets, rental income, and retirement account (IRA) withdrawals. Income is presented on a per person basis; for married people, income is divided equally between spouses to calculate per capita income.
Key Findings:
- Half of all Medicare beneficiaries had annual incomes at or below $22,500 in 2012, with significant variation across race/ethnicity. Median income in 2012 was lower for black and Hispanic beneficiaries ($15,250 and $13,800, respectively) than for white beneficiaries ($24,800).
- The distribution of income for the Medicare population differed by race/ethnicity. While the top 10 percent of black and Hispanic beneficiaries had incomes above $43,900 and $44,550, respectively, the top 10 percent of white beneficiaries had incomes above $70,000 in 2012.
- Social Security accounted for the largest source of income for all beneficiaries in 2012. Among beneficiaries in the middle of the income distribution, Social Security accounted for a larger share of income among black (80%) and Hispanic (76%) beneficiaries than among white beneficiaries (57%). Conversely, investment income (interest, dividends, rental income, and IRA withdrawals) accounted for a larger share of income among white middle income beneficiaries (16%) than among black (4%) or Hispanic (4%) middle income beneficiaries, and defined benefit pensions accounted for twice the share of income among white (14%) than among black (7%) or Hispanic (7%) middle income beneficiaries.
- Median income increased with years of education, but racial/ethnic differences in median income persisted at all education levels. Among college graduates, the median income of white beneficiaries was $41,400 — nearly $7,000 higher than the median income of Hispanic beneficiaries ($34,800), and more than $12,000 higher than the median income of black beneficiaries ($29,200) in 2012.
- Racial/ethnic disparities in income were evident in all age groups, and were most pronounced among beneficiaries between the ages of 65 and 74. Among beneficiaries between the ages of 65 and 74, median income among white beneficiaries ($31,100) was about twice as high as median incomes among black or Hispanic beneficiaries ($17,550 and $14,900, respectively) in 2012. Income differences by race/ethnicity were smaller for beneficiaries under the age of 65 and beneficiaries ages 85 and older.
- Median per capita income was higher among married beneficiaries ($26,500) than divorced, widowed, or single beneficiaries ($19,950, $19,200, and $13,850, respectively), with racial/ethnic differences in median income across all marital groups. Among married beneficiaries, per capita median income for white beneficiaries ($28,550) was about $10,000 higher than per capita median incomes for black and Hispanic beneficiaries ($18,550 and $15,950, respectively) in 2012.
‹ Executive Summary Section 2: Financial Assets and Savings ›
Report: Section 2: Financial Assets And Savings
This section describes the total savings of the Medicare population across race/ethnicity in 2012. Total savings include retirement account holdings (such as IRAs or 401Ks) and other financial assets, including savings accounts, bonds and stocks. Savings are presented on a per person basis; for married people, savings are divided equally between spouses to calculate per capita savings.
Key Findings:
- Nearly all (92%) Medicare beneficiaries had some savings, but rates were higher among white beneficiaries (95%) than among black and Hispanic beneficiaries (80% and 81%, respectively). Similarly, one in 20 white beneficiaries did not have savings or were in debt compared to nearly one in five black beneficiaries and Hispanic beneficiaries.
- Half of all Medicare beneficiaries had less than $63,100 in savings in 2012. Median savings for white beneficiaries ($85,950) were more than seven times the median savings for black beneficiaries ($11,650) and Hispanic beneficiaries ($12,050).
- Among beneficiaries with savings, half had less than $77,500 in savings in 2012; median savings for white beneficiaries ($95,900) were nearly five times the median savings for black beneficiaries ($19,700) and nearly four times the median savings for Hispanic beneficiaries ($25,150) in 2012.
- While the top 10 percent of all black and Hispanic beneficiaries had savings above $137,200 and $215,550, respectively, the top 10 percent of white beneficiaries had savings above $723,200 in 2012.
- The share of beneficiaries with any savings and the median savings among beneficiaries increased with income, with large racial/ethnic differences in savings across all income levels. Among beneficiaries who had incomes over 400 percent of the federal poverty level, median savings for white beneficiaries ($239,050) was nearly five times the median savings for black beneficiaries ($48,550) and more than three times the median savings for Hispanic beneficiaries ($71,400).
- Median savings were higher among beneficiaries with more years of education, but differences in savings by race/ethnicity were evident across all education groups with the greatest disparities among beneficiaries with the most years of education. Among college-educated beneficiaries, median savings for white beneficiaries ($253,550) was nearly five times the median savings for black beneficiaries ($52,250) and more than four times the median savings for Hispanic beneficiaries ($57,000) in 2012.
- Median savings were lowest among those age 85 and older ($40,900) and those under age 65 ($27,050), but median savings differed across race/ethnicity for all age groups. Among beneficiaries between the ages of 65 and 74, median savings among white beneficiaries ($118,400) was about six times the median savings among black and Hispanic beneficiaries $19,700 and $17,500, respectively) in 2012.
- Median per capita savings were higher among married beneficiaries ($84,550) than among divorced, widowed, or single beneficiaries ($53,750, $41,450, and $19,300, respectively), with racial/ethnic differences in median savings across all marital groups. Among married beneficiaries, median per capita savings among white beneficiaries was $107,350, between five and six times the median savings among black and Hispanic beneficiaries ($18,800 and $19,650, respectively) in 2012.
Report: Section 3: Home Equity
This section describes the home equity of the Medicare population across race/ethnicity in 2012, including the share of beneficiaries with home equity, and the home equity values among beneficiaries who have any home equity. As with income and savings, home equity values are divided equally between spouses to calculate per capita home equity. The home equity values shown account for any decrease in home equity values that occurred as a result of the mortgage crisis; it has been estimated that more than 1.5 million Americans over age 50 lost their homes between 2007 and 2011.9
Key Findings:
- In 2012, most Medicare beneficiaries (78%) had some home equity, with higher rates among white beneficiaries (83%) than among black or Hispanic beneficiaries (61% and 60%, respectively).
- Among beneficiaries who had home equity, half of all beneficiaries had less than $93,850 in home equity in 2012; median home equity values were significantly higher among white beneficiaries ($100,200) than black or Hispanic beneficiaries ($53,650 and $67,700, respectively) in 2012.
- Among homeowners, the distribution of home equity values differed by race/ethnicity; while the top 10 percent of black beneficiaries had home equity exceeding $181,750, this was more than $100,000 less than the home equity of the top 10 percent of Hispanic beneficiaries ($285,400) and the top 10 percent of white beneficiaries ($325,200) in 2012.
- The share of beneficiaries with home equity and the median amount of home equity increased with income, with racial/ethnic differences in home equity across all income levels. Among beneficiaries with home equity who had incomes over 400 percent of the federal poverty level, median home equity for black beneficiaries ($65,150) was almost $40,000 less than the median home equity among Hispanic beneficiaries ($103,850) and more than $50,000 less than the median home equity among white beneficiaries ($119,750) in 2012.
- Median home equity was higher among beneficiaries with more years of education, but median home equity differed across race/ethnicity for all education groups. Among beneficiaries with college degrees who had home equity, median home equity among white beneficiaries ($146,550) was almost $60,000 higher than the median home equity among black beneficiaries ($86,950) and more than $30,000 higher than the median home equity among Hispanic beneficiaries ($115,250) in 2012.
- Median home equity values were lowest among those under the age of 65 ($50,300), but home equity values differed across race/ethnicity for all age groups. Among beneficiaries between the ages of 65 and 74 who had home equity, median home equity among white beneficiaries ($109,350) was more than $45,000 higher than the median home equity among black beneficiaries and Hispanic beneficiaries ($58,700 and $63,950, respectively) in 2012.
- Among beneficiaries with home equity, median home equity was highest among married beneficiaries, but on a per capita basis, median per capita home equity values were higher among divorced beneficiaries ($130,800) than among married, widowed, or single beneficiaries ($81,400, $94,200, and $92,150, respectively) in 2012; moreover, more than 40 percent of widowed beneficiaries and more than 60 percent of single beneficiaries had no home equity, and racial/ethnic differences in home equity values were evident across all marital groups. Among divorced beneficiaries, median per capita home equity among black beneficiaries ($86,750) was about $33,000 lower than the median per capita home equity among Hispanic beneficiaries ($120,050) and almost $50,000 lower than the median per capita home equity of white beneficiaries ($135,700) in 2012.
‹ Section 2: Financial Assets and Savings Section 4: Projected Growth in Income, Assets, and Home Equity ›
Report: Section 4: Projected Growth In Income, Assets, And Home Equity
This section presents projections of income, assets, and home equity for the Medicare population in 2030, and examines changes during the period between 2012 and 2030, to explore the extent to which future generations of Medicare beneficiaries will be more economically secure than the current generation. Data in this section are adjusted for inflation; all dollar amounts are in 2012 per capita dollars.
Key Findings
- In 2030, the Medicare population is projected to have somewhat higher incomes than current beneficiaries; median per capita income is projected to rise from $22,500 in 2012 to $28,600 in 2030, with income increasing unevenly across race/ethnicity. In 2030, median income is projected to be substantially higher for white beneficiaries ($32,800) than for black and Hispanic beneficiaries ($19,000 and $18,100, respectively).
- By 2030, the racial/ethnic differences in shares of beneficiaries with savings are projected to narrow, with the share of black and Hispanic beneficiaries with savings projected to grow to 89 percent and 88 percent, respectively, but remaining slightly lower than the rate among white beneficiaries (97%).
- The gap in savings across race/ethnicity is projected to widen by 2030; while median savings for white beneficiaries is projected to increase by about $61,100, this is more than double the absolute dollar increase in median savings for black and Hispanic beneficiaries ($22,600 and $23,650, respectively) between 2012 and 2030. The increase in savings for future generations largely reflects the higher prevalence of retirement account pensions among these beneficiaries during their working years compared to current beneficiaries. These higher savings amounts (that result in higher IRA withdrawals) are largely offset by lower pension incomes compared to current beneficiaries.
- The share of Medicare beneficiaries with home equity and the median home equity value among those with home equity is expected to increase between 2012 and 2030. However, among beneficiaries with home equity, the growth in median home equity is projected to be higher for white beneficiaries ($18,850) than black and Hispanic beneficiaries ($5,200 and $5,950, respectively) between 2012 and 2030, leading to widening racial/ethnic disparities in home equity values among the next generation of Medicare beneficiaries.
Appendix
Methodology:
Asset and income projections are based on the Urban Institute’s Dynamic Simulation of Income Model (DYNASIM3). DYNASIM3 is a dynamic microsimulation model that projects the population and analyzes the long-run distributional consequences of retirement and aging issues. The model starts with a representative sample of individuals and families and ages the data year by year, simulating demographic and economic events including all key components of retirement income. The model integrates many important trends and differences among groups in life course processes, including birth, death, schooling, leaving home, first marriage, remarriage, divorce, disability, work, retirement, and earnings. Projections of fertility, disability, mortality, net immigration, employment, average earnings, and price changes are aligned to be consistent with 2011 OASDI Trustees projections. Projections of assets are aligned to the Survey of Consumer Finance (SCF). For a fuller description of DYNASIM3, see Karen E. Smith. February 2012. “Projection Methods Used in the Dynamic Simulation of Income Model (DYNASIM3),” Program on Retirement Policy, The Urban Institute.
‹ Section 4: Projected Growth in Income, Assets, and Home Equity
Endnotes
- Meschede, Tatjana, Thomas M. Shapiro, and Jennifer Wheary. Living Longer on Less: The New Economic (In)Security of Seniors. Institute on Assets and Social Policy and Dēmos, by a Thread Report no. 4. May 2009. ↩︎
- Kaiser Family Foundation, “Key Issues in Understanding the Economic and Health Security of Current and Future Generations of Seniors,” March 2012. ↩︎
- Shapiro, Thomas, Tatjana Meschede, and Sam Osoro. The Roots of the Widening Racial Wealth Gap: Explaining the Black-White Economic Divide. Brandeis University Institute on Assets and Social Policy, Research and Policy Brief. February 2013. ↩︎
- McKernan, Signe-Mary, Caroline Ratcliffe, Eugene Steuerle, and Sis Zhang, “Less Than Equal: Racial Disparities in Wealth Accumulation,” April 2013. ↩︎
- Kaiser Family Foundation, “Projecting Income and Assets: What Might the Future Hold for the Next Generation of Medicare Beneficiaries?” June 2011. ↩︎
- Kaiser Family Foundation, “Medicare at a Glance: Fact Sheet,” November 2012. ↩︎
- Butrica, Barbara, Howard Iams, Karen E. Smith, and Eric Toder. The Disappearing Defined Benefit Pension and Its Potential Impact on the Retirement Incomes of Boomers. Social Security Bulletin, 69(3): 1-27. January 2009. ↩︎
- Kaiser Family Foundation, “2012 Employer Health Benefits Survey,” September 2012. ↩︎
- Trawinski, Lori, “Nightmare on Main Street: Older Americans and the Mortgage Market Crisis,” AARP Public Policy Institute, July 2012. ↩︎