
How has the ACA Medicaid Expansion Affected Providers Serving the Homeless Population: Analysis of Coverage, Revenues, and Costs
Introduction
The Affordable Care Act (ACA) Medicaid expansion to adults with incomes up to 138% of the Federal Poverty Level (FPL) closed a longstanding gap in eligibility for the program. As of February 2016, 32 states, including DC, have adopted the Medicaid expansion, providing a new coverage option for millions of uninsured adults. In Medicaid expansion states, many people experiencing homelessness are newly eligible for coverage, since this population includes many single adults who were excluded from Medicaid prior to the expansion. Coverage is particularly important for this population given that they have poor health and intensive health care and social service needs. 1, 2, 3 Gains in coverage among this population provide an opportunity to increase their access to health care services, which may contribute to improved health outcomes and increased stability in their lives. The Medicaid expansion also has implications for the health care providers who serve those experiencing homelessness. These providers include Health Care for the Homeless (HCH) projects, which are a subset of community health centers that serve this population. In addition to the services provided by other health centers, HCH projects typically offer a broader range of behavioral health care, intensive case management, and other supportive services. The Medicaid expansion offers an opportunity to increase coverage among patients served by HCH projects, which could contribute to changes in service use and costs and revenues.
To further understand how the first full year of Medicaid expansion has affected patients who are homeless and providers who care for them, this analysis uses data from the Uniform Data System (UDS) to examine differences between HCH projects in expansion and non-expansion states. The analysis examines differences in patient demographics, patient health coverage, service utilization, patient and visit volume, and costs and revenues. It also explores differences between HCH projects and other health centers serving a general, low-income population. This report builds on two previous projects that explored the early impacts of the Medicaid expansion for homeless patients and providers based on information collected through focus groups.4,5
Data and Methods
This analysis was conducted by the Kaiser Family Foundation and the National Health Care for the Homeless Council based on data from the Uniform Data System (UDS) for calendar years 2013 and 2014. Analysis of health coverage of patients also includes data from calendar year 2012. All health centers report into the UDS annually. Data were separated for HCH projects and other health centers and based on the state Medicaid expansion decisions as of 2014. Data for health centers in the U.S. territories were excluded from the analysis.
Some HCH projects are stand-alone HCH projects that focus on serving only homeless patients and others are embedded within other health centers that serve the general low-income population (Table 1). For the analysis of patient demographics, service use, coverage, and patient volume, the “HCH Projects” group includes data from stand-alone HCHs and data from embedded HCH projects that are associated with serving the homeless population. Data from health centers with an embedded HCH project that is associated with serving the non-homeless population were included with data for other health centers in the “Other Health Centers” group. However, for the cost and revenue analysis, it was not possible to separate the HCH-related data from the data associated with serving the broader population for those projects embedded within other health centers. As such, for these measures, the data for “HCH Projects” only includes stand-alone HCH projects.
| Table 1: Number of HCH and Other Health Centers, 2013 and 2014 | ||||
| Stand-alone HCHs | Health Centers with an Embedded HCH Project | Other Health Centers | Total Health Centers | |
| 2013 | 58 | 188 | 927 | 1173 |
| 2014 | 60 | 204 | 985 | 1249 |
| Source: KCMU and National Health Care for the Homeless Council analysis of 2013 and 2014 Uniform Data System data. | ||||
Findings
Patient Demographics and Service Use
There are key differences in the demographic characteristics and uninsured rate of homeless patients at HCH projects and those at other health centers. Compared to patients at other health centers, patients at HCH projects are more likely to be non-elderly adults (84% vs. 61%), Black (31% vs. 19%), male (55% vs. 42%), and to have income below poverty (89% vs. 71%). They also are more likely to be uninsured than patients at other health centers (43% vs. 27%). The difference in coverage rates reflects these other demographic differences, as women, children, and the elderly traditionally have had more expansive eligibility for Medicaid and Medicare, compared to non-elderly males.
| Table 2: Demographics of Patients at HCH Projects and Other Health Centers, 2014 | ||
| HCH Projects | Other Health Centers | |
| Age | ||
| 0-17 | 12% | 31% |
| 18-64 | 84% | 61% |
| 65+ | 4% | 8% |
| Race | ||
| White | 35% | 36% |
| Black | 31% | 19% |
| Hispanic | 17% | 25% |
| Other | 5% | 6% |
| Not Reported | 14% | 14% |
| Gender | ||
| Male | 55% | 42% |
| Female | 45% | 58% |
| Income | ||
| ≤100% FPL | 89% | 71% |
| Insurance | ||
| Uninsured | 43% | 27% |
| Source: KCMU and National Health Care for the Homeless Council analysis of 2014 Uniform Data System data. | ||
Mental health, substance abuse, and enabling services account for a larger share of patient visits at HCH projects compared to other health centers. Among HCH projects, mental health visits account for 15% of visits, compared to 6% in other health centers, while substance abuse services make up 7% of visits at HCH projects compared to just 1% of visits at other health centers (Figure 4).6 Similarly, enabling services, such as outreach and case management, account for a larger share of visits at HCH projects compared to other health centers (15% vs. 5%). These differences likely reflect the greater need for behavioral health treatment, outreach, and case management services for the population served by HCH projects, as well as greater availability of these services through HCH projects compared to other health centers in response to this increased patient need.
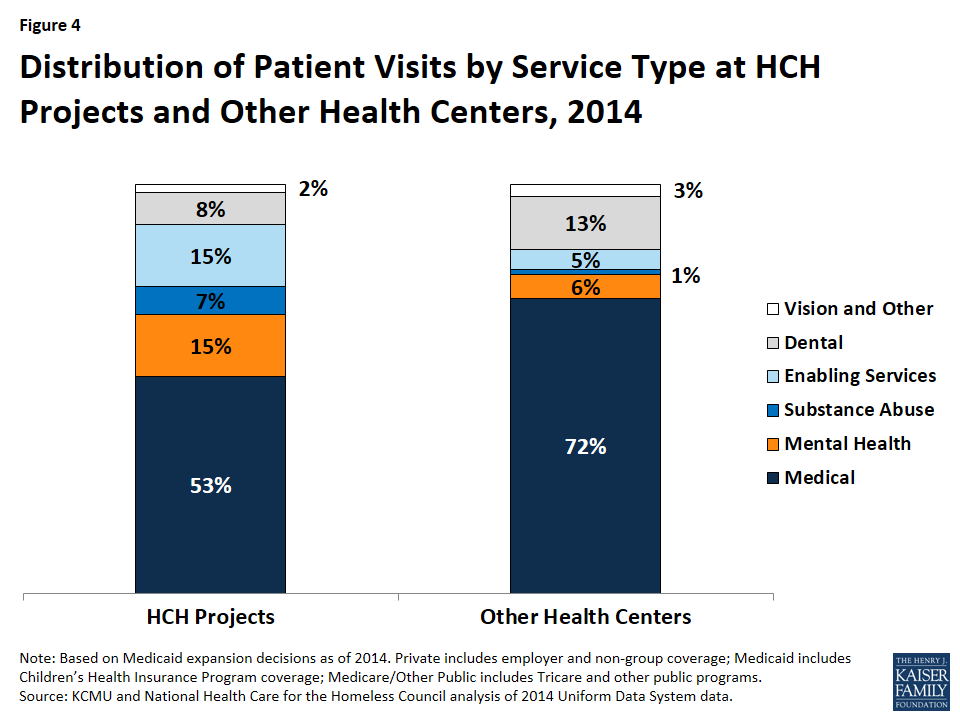
Figure 4: Distribution of Patient Visits by Service Type at HCH Projects and Other Health Centers, 2014
Health Coverage
Health coverage rates for patients at HCH projects and other health centers increased since implementation of the ACA coverage expansions in 2014, with HCH projects experiencing larger coverage gains compared to other health centers. Since 2012, the coverage rate for patients at HCH projects increased by 18 percentage points from 39% in 2012 to 57% during 2014 (Figure 5). In other health centers, the patient health coverage rate increased from 64% to 73% over the period, a 9 percentage point increase. Even with the larger increase, the health coverage rate among patients at HCH projects remains lower than that for other health centers (57% vs. 73%) in 2014.
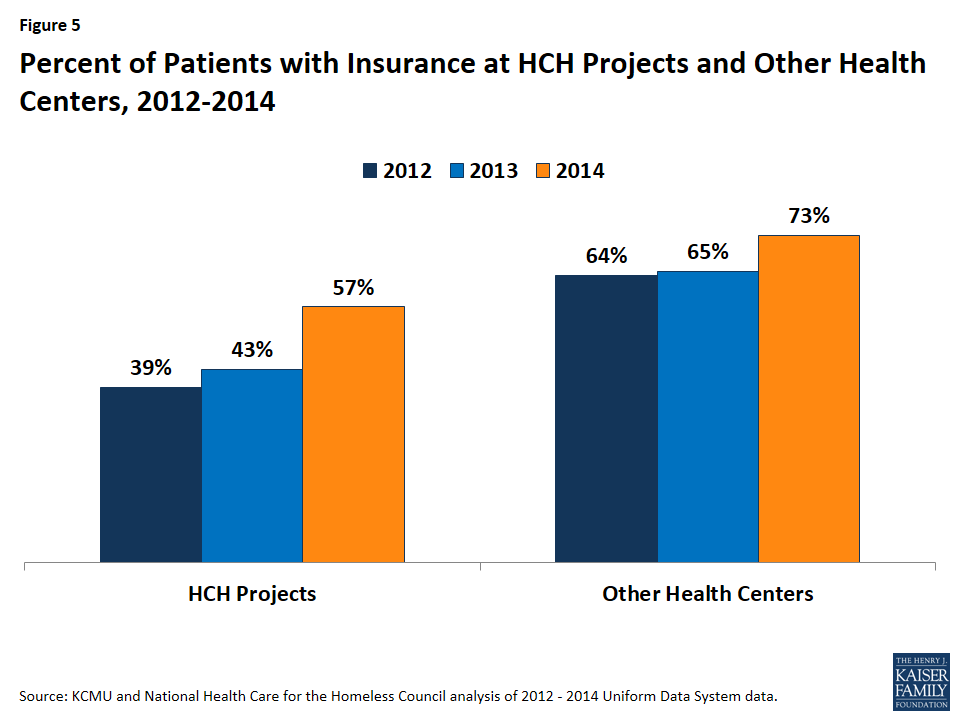
Figure 5: Percent of Patients with Insurance at HCH Projects and Other Health Centers, 2012-2014
Increases in health coverage were larger for patients of HCH projects in Medicaid expansion states compared to those in non-expansion states. In Medicaid expansion states, the health coverage rate for patients at HCH projects increased by 22 percentage points, from 45% in 2012 to 67% during 2014, while the coverage rate increased by only 4 percentage points from 26% to 30% in non-expansion states (Figure 6). Reflecting higher initial coverage rates and this difference in coverage gains, the health coverage rate for patients at HCH projects in Medicaid expansion states was more than two times higher than the rate in non-expansion states (67% vs. 30%) in 2014. For other health centers, there were also larger gains in coverage for patients of centers in expansion states compared to non-expansion states, although the difference was not as large.
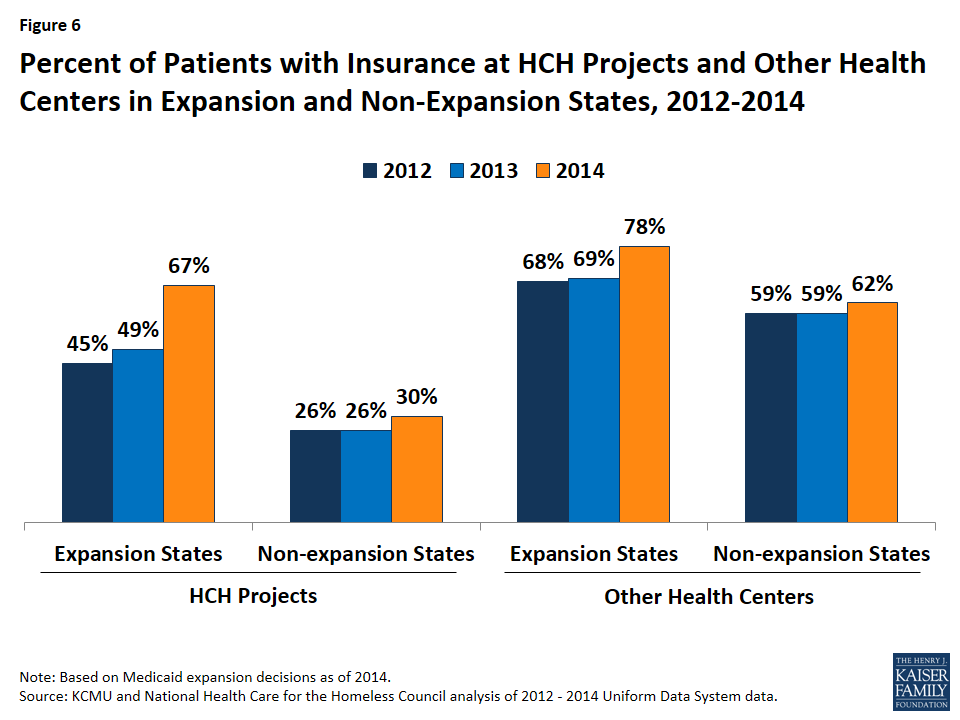
Figure 6: Percent of Patients with Insurance at HCH Projects and Other Health Centers in Expansion and Non-Expansion States, 2012-2014
Changes in coverage among HCH projects varied widely across states. Across HCH projects in expansion states, the change in the share of patients with coverage between 2013 and 2014 ranged from a 2 percentage point decrease in Minnesota and DC, which already had coverage for adults in place prior to the Medicaid expansion, to increases of at least 60 percentage points in Rhode Island and West Virginia (Figure 7 and Appendix A, Table 1). Several other states had Medicaid-funded coverage for adults prior to 2014, which may explain smaller gains in insurance, although the scope of benefits of this coverage varied.7 In non-expansion states, the change in the share of patients with coverage ranged from an 11 percentage point decrease in Alaska to a 26 percentage point increase in Kansas. This variation reflects a number of factors in addition to state Medicaid expansion decisions, including coverage in place prior to the ACA, differences in the number of HCH projects across each state, patient demographics, outreach and enrollment activities, and variation in reporting and data collection.
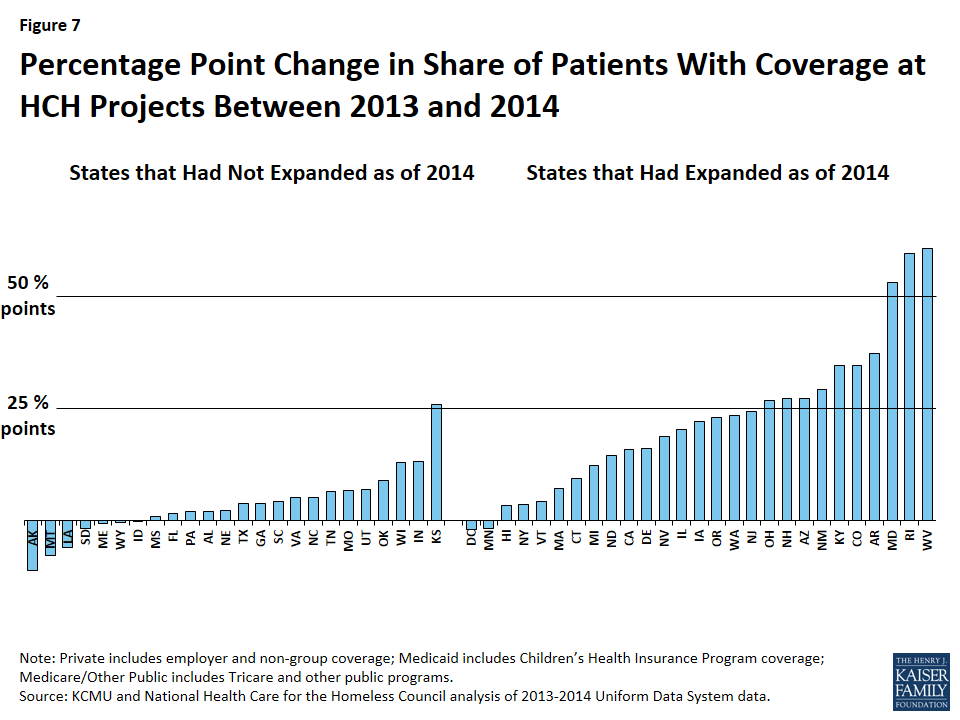
Figure 7: Percentage Point Change in Share of Patients With Coverage at HCH Projects Between 2013 and 2014
Medicaid comprises the majority of insurance for insured patients at HCH projects and other health centers, but plays a larger role for centers in Medicaid expansion states compared to non-expansion states. Among patients at HCH projects, over half of patients (55%) in expansion states have Medicaid coverage compared to one in five in non-expansion states (20%) (Figure 8). This disparity in Medicaid coverage rates contributes to the higher uninsured rate for patients at HCH projects in non-expansion states. A similar pattern is observed for other health centers, although the share of patients with Medicaid coverage in non-expansion states is higher in other health centers compared to HCH projects (37% vs. 20%). Other health centers also have higher rates of private and Medicare coverage compared to HCH projects, which contributes to their overall higher insurance rate.
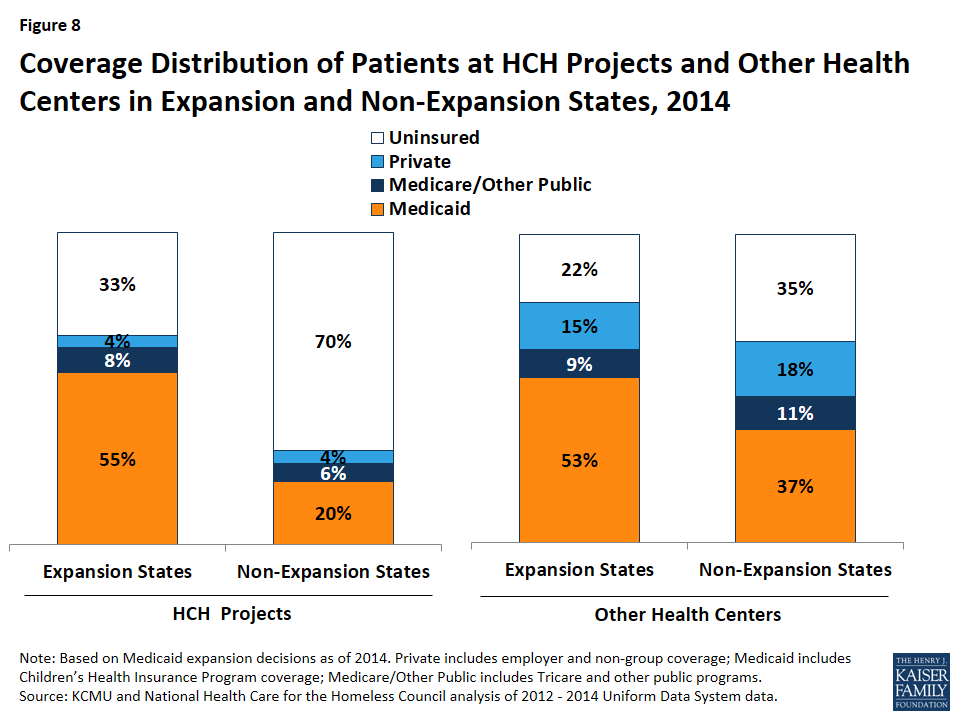
Figure 8: Coverage Distribution of Patients at HCH Projects and Other Health Centers in Expansion and Non-Expansion States, 2014
The rate and distribution of coverage for HCH patients varies widely across states, with generally higher coverage rates among Medicaid expansion states (Figure 9 and Appendix A, Table 1). Among HCH projects in states that had not expanded Medicaid as of 2014, patient coverage rates ranged from 8% in Georgia to 58% in Pennsylvania in 2014, while patient coverage rates of HCH projects in expansion states ranged from 42% in North Dakota to 92% in Vermont. The higher patient coverage rates of HCH projects in expansion states are generally driven by larger shares of Medicaid coverage in these states.
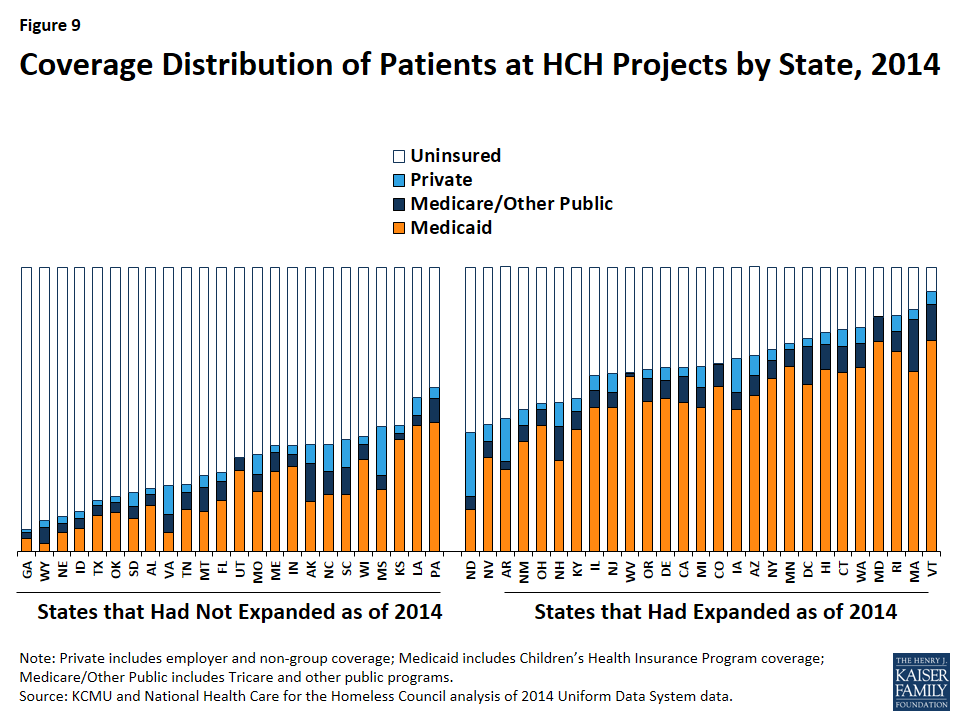
Figure 9: Coverage Distribution of Patients at HCH Projects by State, 2014
Patient Volume
HCH projects in expansion states had a lower number of patients and patient visits in 2014 compared to 2013, while HCH projects in non-expansion states had a small increase in both patients and total patient visits (Figure 10). Other health centers had increases in patients and patient visits in both expansion and non-expansion states, with slightly larger increases in expansion states compared to non-expansion states.
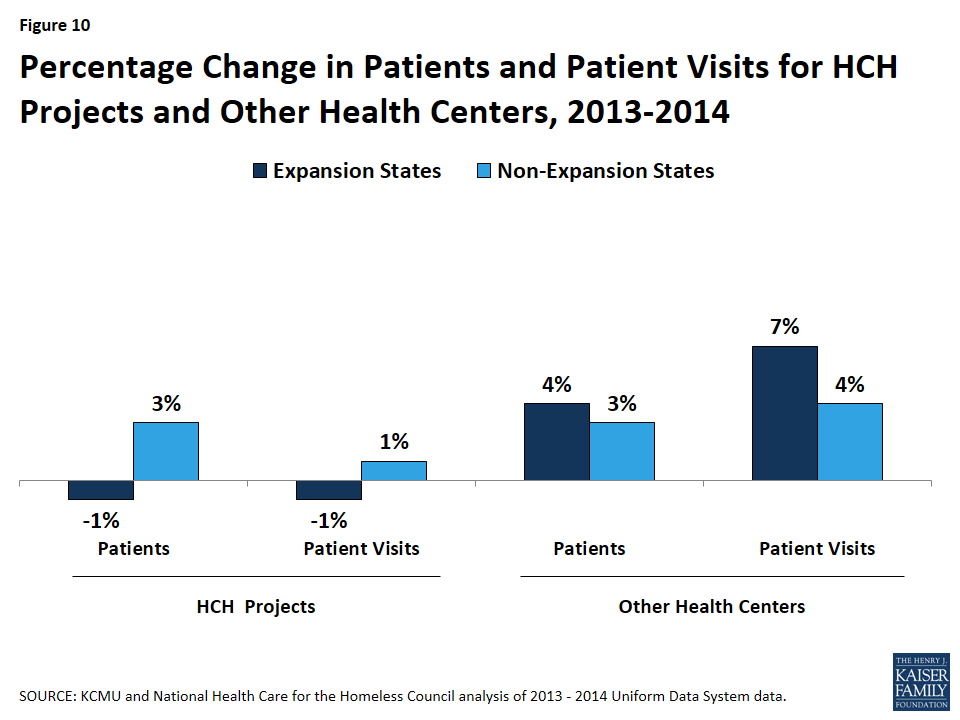
Figure 10: Percentage Change in Patients and Patient Visits for HCH Projects and Other Health Centers, 2013-2014
- HCH projects in expansion states. The number of HCH projects in expansion states increased by 6% from 156 in 2013 to 165 in 2014. However, they had a 1% decline in the number of patients, which fell from about 616,000 in 2013 to 611,000 in 2014, and a 1% decline in total patient visits, which decreased from 3.41 million to 3.36 million over the period (Appendix A, Table 2). These declines despite an increase of nine additional HCH projects may reflect some patients moving to other providers after gaining health coverage. Individuals may have sought a new provider after gaining coverage for a number of reasons, including a desire for more convenient locations and/or hours, a preference to receive care in a non-homeless-specific environment, or to seek covered services that are not offered at the HCH provider. Provider changes also may result from Medicaid auto-assigning individuals to another provider upon enrollment.
- HCH projects in non-expansion states. The number of HCH projects in non-expansion states increased by 10% from 90 in 2013 to 99 in 2014. In contrast to HCH projects in expansion states, HCH projects in non-expansion states had a 3% increase in the number of patients, rising from about 233,000 in 2013 to nearly 240,000 in 2014. HCH projects in these states also had a slight increase in total patient visits (1%), which increased from 1.11 million to 1.12 million visits. The addition of nine new HCH projects may have contributed to these increases, but it is not possible to draw firm conclusions from these data.
- Other health centers. The total number of patients at other health centers increased by 4% and 3% in expansion and non-expansion states, respectively. Patient visits increased by 7% in expansion states and 4% in non-expansion states. These changes, in part, reflect increases in the number of health centers in both expansion and non-expansion states. However, they may also stem from enhanced outreach and patient engagement, which was supported by increased outreach and enrollment funding provided to health centers. They also suggest that fewer patients may have left other health centers after gaining coverage compared to HCH projects, although additional research is needed to understand this finding.
Revenues and Costs
There were larger gains in total revenue for HCH Projects in expansion states and smaller increases in costs compared to those in non-expansion states (Figure 11 and Appendix A, Table 3). Aggregate revenues for HCH projects in expansion states increased by 7%, rising from $328.9 million in 2013 to $352.4 million in 2014. In contrast, aggregate revenues for HCH projects in non-expansion states increased marginally, rising only 2% from $47.7 to $48.5 million. Conversely, costs for HCH projects in non-expansion states rose by 9%, compared to 3% for those in expansion states. Compared to other health centers, HCH projects had smaller increases in revenues and costs in both expansion and non-expansion states.
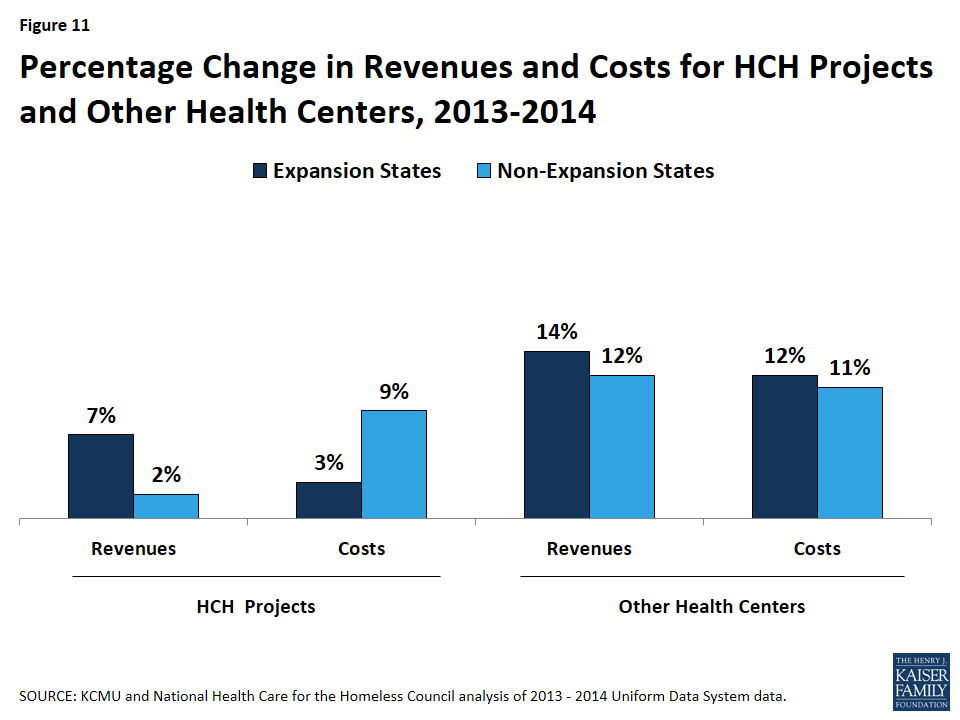
Figure 11: Percentage Change in Revenues and Costs for HCH Projects and Other Health Centers, 2013-2014
Third-party payments accounted for a larger share of revenue among HCH projects in 2014 than in 2013, but grant funding continues to play a large role for these health centers. Among HCH projects, the share of revenue coming from grants declined from 60% in 2013 to 49% in 2014, while the share of revenue from grants at other health centers remained constant at 33% (Figure 12).8 Reflecting the gains in coverage among patients at HCH projects, their share of revenue coming from third-party payments increased from 32% to 38%. However, third-party payments still account for a much smaller share of revenue among HCH projects compared to other health centers (38% vs. 59% in 2014). Even with the gains in coverage and increases in third-party payments among HCH projects, other grant funding remains important, particularly for services that are not reimbursed by Medicaid. For example, enabling services (such as case management and outreach) are vital for a patient population that is homeless, but the vast majority of states do not reimburse for these services directly.
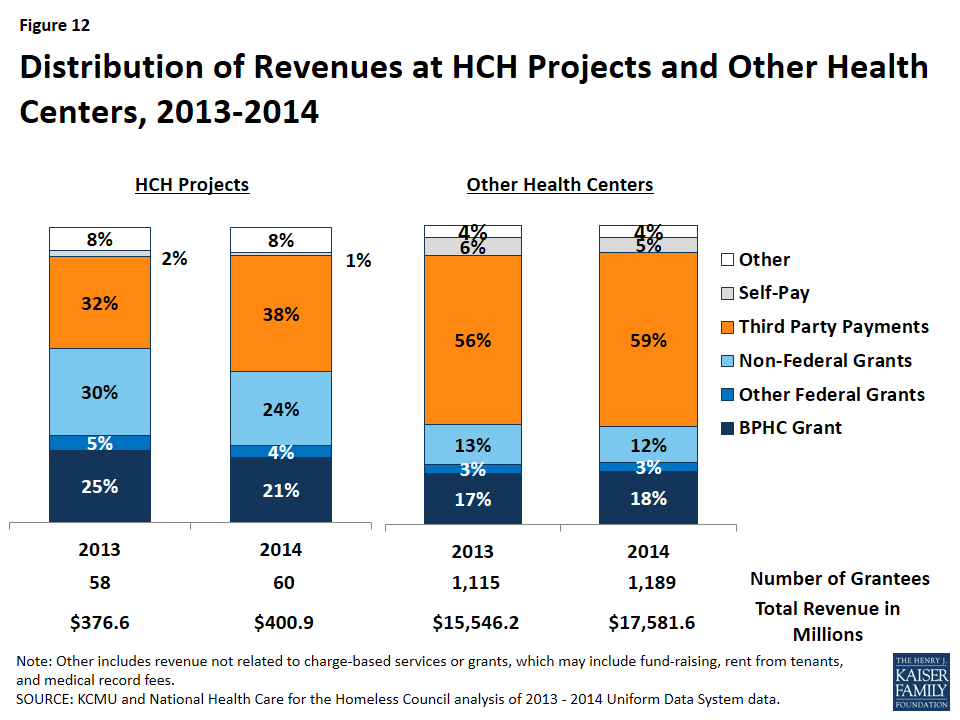
Figure 12: Distribution of Revenues at HCH Projects and Other Health Centers, 2013-2014
Distribution of revenue by source varies widely between HCHs in expansion states and those in non-expansion states. The vast majority of revenue at HCH projects in non-expansion states comes from grants (86%), with the Bureau for Primary Health Care (BPHC) grant representing over half the budget in 2014 and third-party payments only 3% (Figure 13 and Appendix A, Table 3). In contrast, HCH projects in expansion states have more diverse funding, with grants representing about half the revenue (49%), and the BPHC grant making up 21% of the operating budget. In these states, the share of revenue coming from third-party payments from insurers rose from 36% in 2013 to 43% in 2014 as a result of coverage gains among patients. The differences in revenue distribution between HCH projects in expansion and non-expansion states reflect a myriad of state decisions regarding Medicaid and non-federal grant distribution both before and after the 2014 Medicaid expansion. Despite these differences, grant funding remains an important revenue source for all HCH projects. However, given the major role grant funding plays for HCH projects in non-expansion states, they would be the most significantly affected by any reductions in grants at the federal or state level.
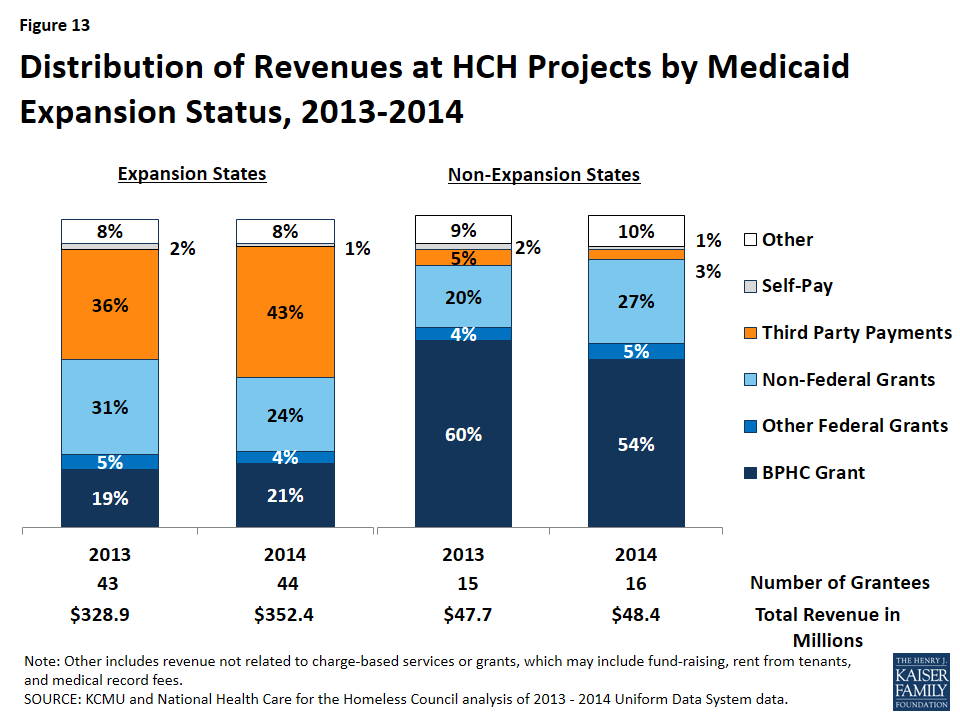
Figure 13: Distribution of Revenues at HCH Projects by Medicaid Expansion Status, 2013-2014
Distribution of costs remained fairly stable among both HCH projects and other health centers. When comparing the distribution of costs by service type in 2013 to the distribution in 2014, there were only slight changes (Appendix A, Table 3). Among HCH projects, medical care (medical care personnel, laboratory and x-ray, and other direct medical costs) accounts for about half of costs, clinical care (dental, mental health, substance abuse, pharmacy, vision and other services) makes up about 30% of costs, and enabling services (case management, outreach, transportation, translation and interpretation, education, eligibility assistance and other support services) account for the remainder of costs.9 Consistent with the data showing greater use of enabling services in HCH projects, enabling services account for nearly twice the share of costs in HCH projects compared to other health centers (20% vs. 12% for expansion states and 19% vs. 9% in non-expansion states in 2014).
Conclusion
In sum, the data show that there have been significant coverage gains among patients at HCH projects since implementation of the ACA in 2014, with the largest gains among patients at HCH projects in states that have adopted the Medicaid expansion. In contrast, coverage remains very low among patients at HCH projects in non-expansion states. HCH projects in expansion states experienced small declines in their number of patients and patient visits in 2014 compared to 2013, which could reflect individuals moving to other providers after gaining coverage. HCH projects in non-expansion states saw a slight increase in total patients and patient visits.
HCH projects in expansion states also had larger revenue gains and smaller increases in costs compared to those in non-expansion states, with third-party payments increasing as a share of revenue due to coverage gains among patients. In contrast, grants remain the primary source of funding for HCH projects in non-expansion states, making them more sensitive to any reductions in federal or state grants. Across all HCH projects, however, grant funding remains important, particularly since many enabling and supportive services that are important for serving the population experiencing homelessness generally are not reimbursable through Medicaid. The distribution of costs by service type at HCH projects remained fairly stable between 2013 and 2014 in both expansion and non-expansion states. Consistent with the data showing greater use of enabling services in HCH projects compared to other health centers, these services account for nearly twice the share of total costs in HCH centers compared to other health centers.
Together, the changes among HCH projects in Medicaid expansion states may facilitate broader access to services among patients and greater financial stability for homeless providers. Gains in third-party revenue may also support strategic and operational improvements. However, HCH projects face new challenges associated with serving an increasing share of patients with coverage, including negotiating payments; credentialing providers; improving coding, billing, and quality outcome practices; increasing referrals for specialty care; and tracking client Medicaid enrollment status. Increased coverage among HCH patients may also contribute to new connections between homeless providers, hospital systems, and insurance plans, which may lead to an increased focus on the role that housing and housing-related support services play with regard to health outcomes, service utilization, and system costs.
In contrast, there has been little change for HCH projects in non-expansion states. While much of the health care system focuses on the opportunities for those newly insured, HCH projects in these states continue to serve a largely uninsured population and rely heavily on federal and non-federal grants to provide services. While HCHs and other health centers in these states provide services to individuals regardless of ability to pay or insurance status (as required by federal law), this patient population does not benefit from the broader services available through Medicaid, particularly specialty care and hospitalizations. Over time, there may be increasing disparities in health outcomes, overall system costs, and service utilization for people who are homeless in states that have expanded Medicaid compared to those in states that have not.
This brief was prepared by Matt Warfield and Barbara DiPietro of the National Health Care for the Homeless (HCH) Council and Samantha Artiga with the Kaiser Family Foundation. National HCH Council staff time for their work with the Council is supported by the Health Resources and Services Administration (HRSA) of the U.S. Department of Health and Human Services (HHS) under grant number U30CS09746, a National Training and Technical Assistance Cooperative Agreement for $1,625,741, with 0% match from nongovernmental sources. This information or content and conclusions are those of the authors and should not be construed as the official position or policy of, nor should any endorsements be inferred by HRSA, HHS or the U.S. Government.
