
Economic and Fiscal Trends in Expansion and Non-Expansion States: What We Know Leading Up to 2014
How Do Expansion And Non-Expansion States Compare? - Revenue and Tax Capacity
In debating adoption of the Medicaid expansion, many states have tried to assess the implications for state revenues. For example, some expansion states like Kentucky have noted increased tax revenues since adopting the Medicaid expansion. However, leading up to the implementation of the ACA, expansion and non-expansion states have historical differences across key measures of revenue and tax capacity including tax collections, capacity, and effort. There are also notable differences in the composition of tax revenue sources and tax policy.
Tax Collections
- At a national level, state tax capacity has been increasing since the Great Recession.
- Both groups of states saw declines in real per capital tax collections during the Great Recession; the typical expansion state has recovered faster than the typical non-expansion state. (Exhibit 3.1)
Tax Capacity
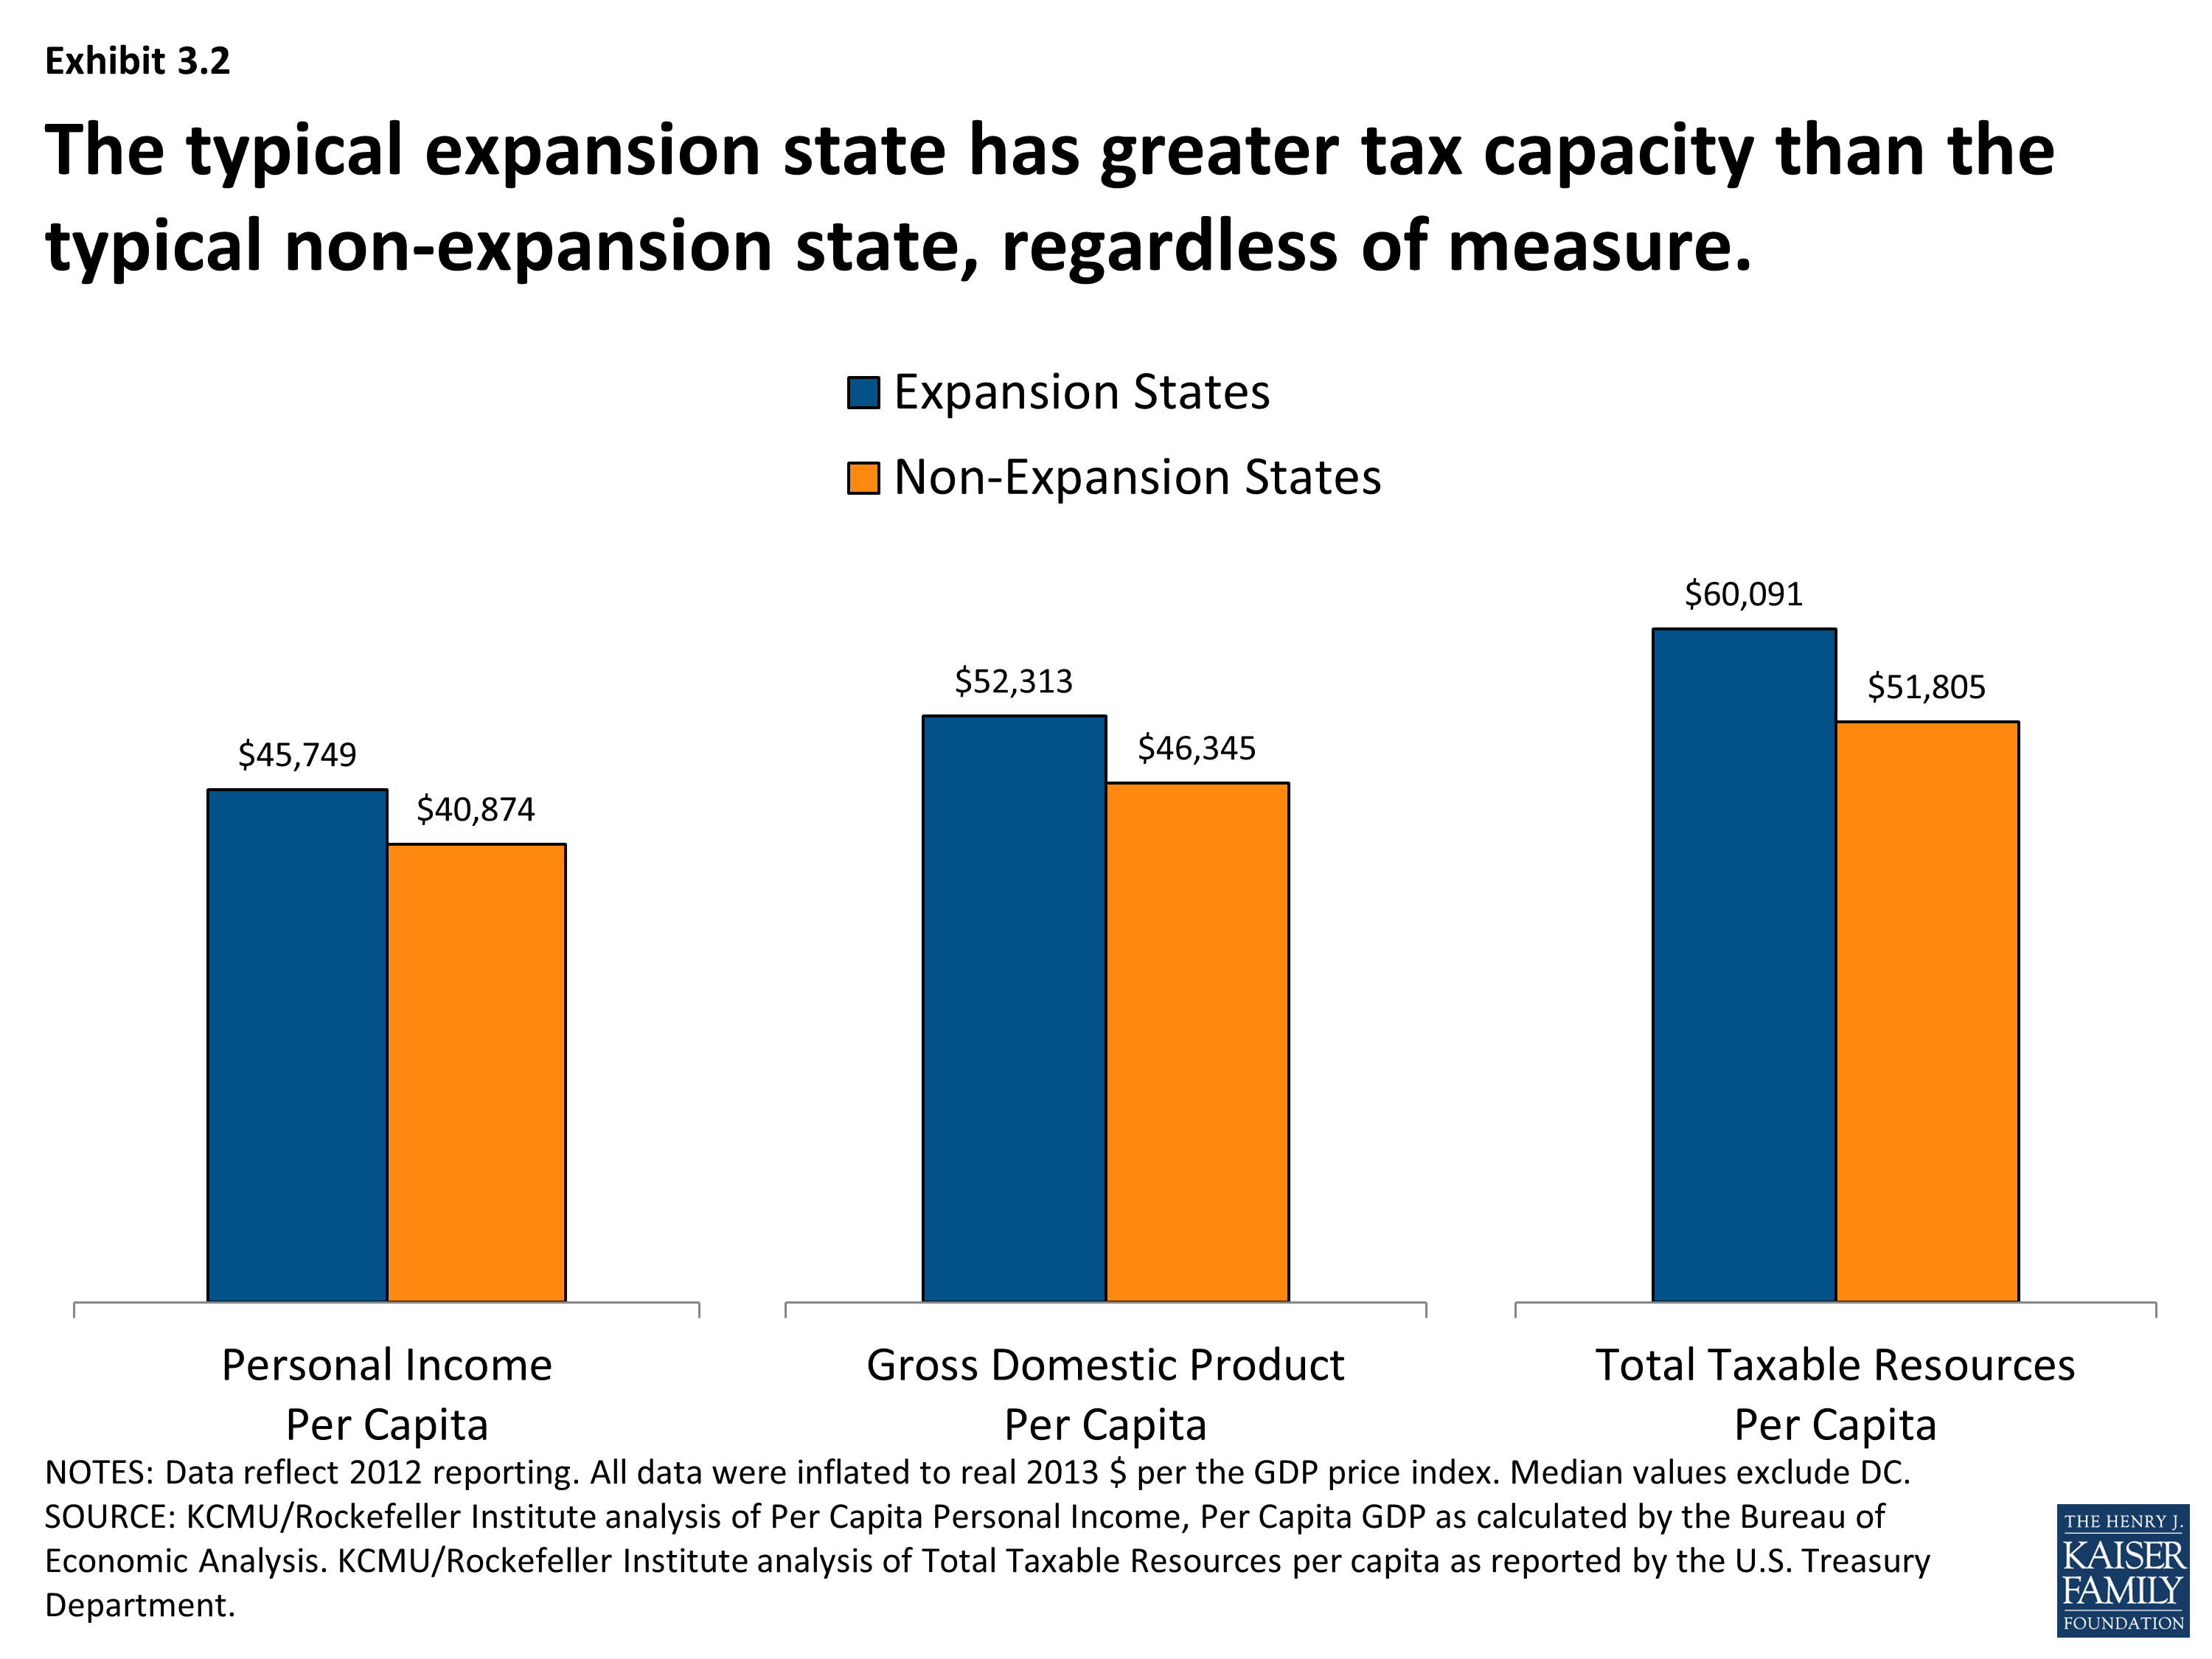
- The typical expansion state had greater tax capacity whether measured by personal income, GDP or total taxable resources (TTR) per capita. Tax capacity was about 12% to 16% higher in the median expansion state in 2012, depending on the measure. (Exhibit 3.2)
- There are some exceptions. Wyoming is a non-expansion state that had a higher TTR per capita than any expansion state in 2012 except Alaska, driven by tax revenue potential from oil and minerals. There are some expansion states (West Virginia and Kentucky) which had some of the lowest TTR per capita in this period.
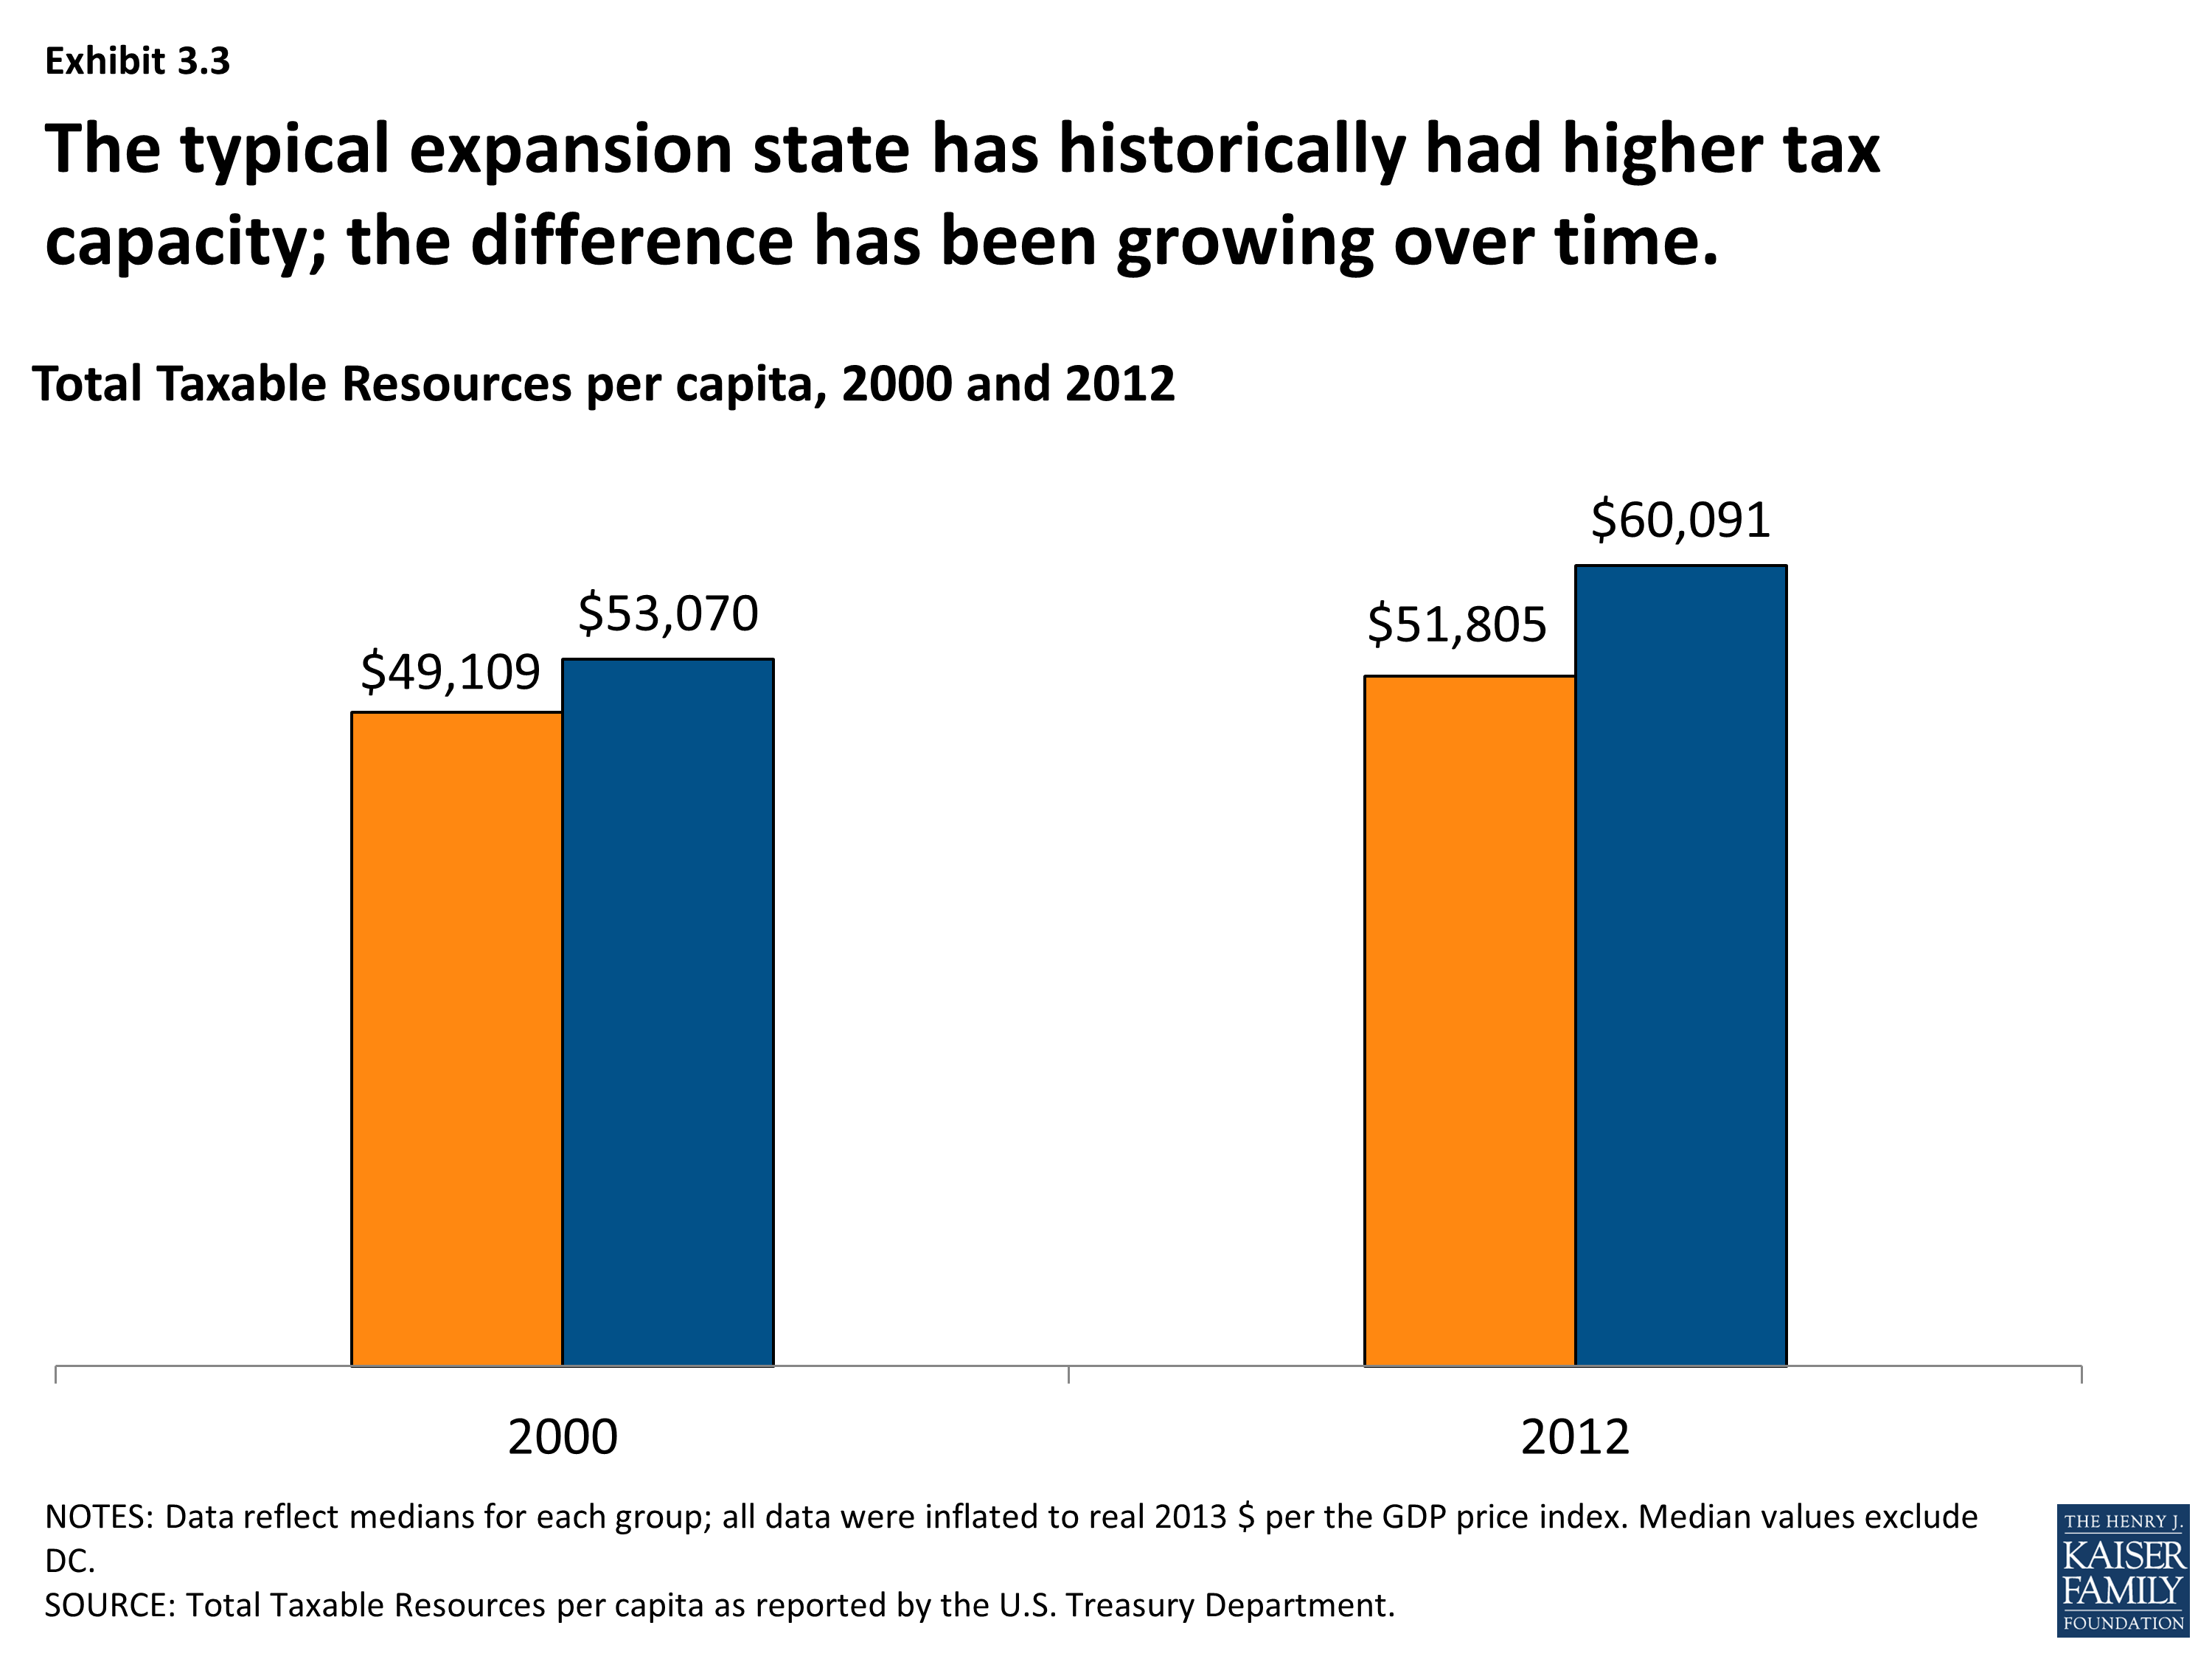
- There has been a widening gap between expansion and non-expansion states in terms of their fiscal capacity. In 2000, the typical expansion state had a TTR per capita 8% higher than the typical non-expansion state ($49,109 vs. $53,070); by 2012, the difference had grown to 16% ($51,805 vs. $60,091). (Exhibit 3.3)
Tax Collections as a Share of Tax Capacity
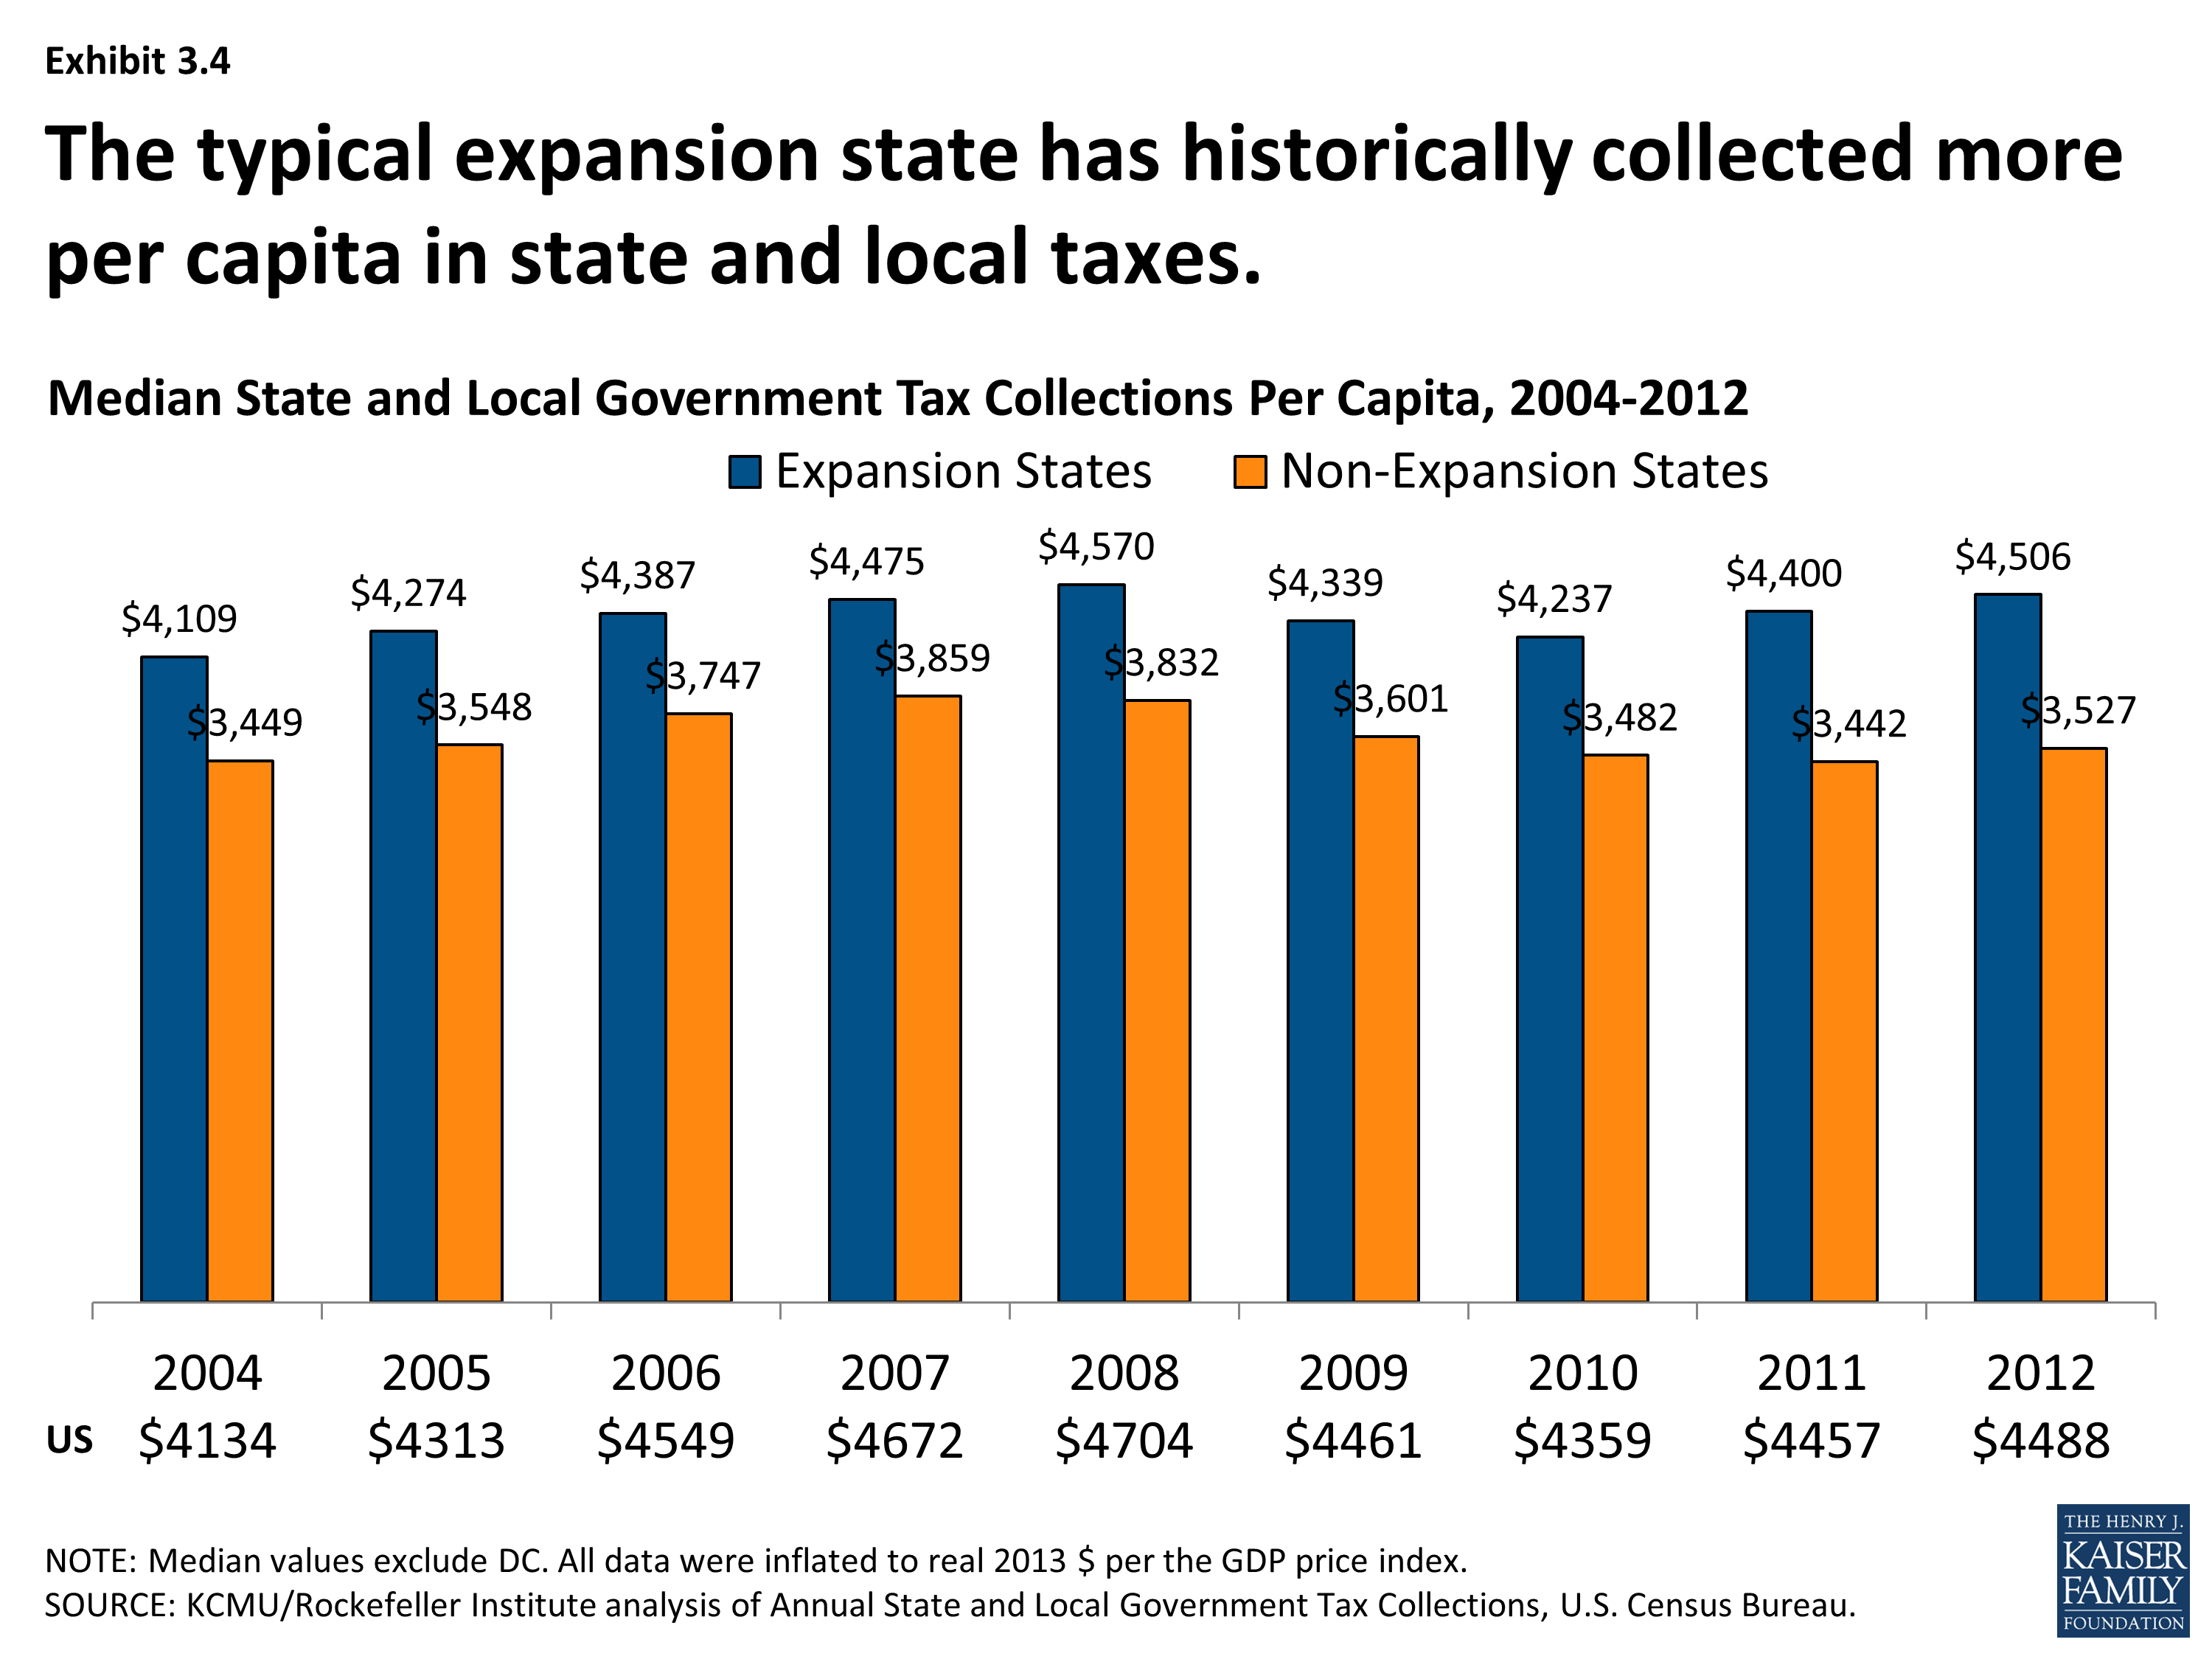
- The typical expansion state raises much more (25% more) in state and local tax revenue per capita than the typical non-expansion state. (Exhibit 3.4)
- The typical expansion state raises more, even relative to their greater tax capacity; state and local tax revenues as a percent of TTR were about 14% higher in the typical expansion state (7.7% vs. 6.7%). Over time, tax collections as a share of TTR have increased in the typical expansion state (7.3% in 2000 vs. 7.7% in 2012) but decreased in the typical non-expansion state (7.2% in 2000 vs. 6.7% in 2012). (Exhibit 3.5)
Composition of Tax Revenue Sources
- Nationally, 32% of the $1.4 trillion tax revenue collected by state and local governments came from property taxes, followed by general sales taxes (23%) and personal income taxes (22%). Nearly $6 in $10 in tax revenues were collected by state governments; the remainder was collected by localities. (Exhibit 3.6)
- The typical non-expansion state relies much more on relatively regressive general sales taxes (28.8% compared to 18.0% in the typical expansion state.) The typical expansion state relies slightly more on relatively progressive personal income taxes. (Exhibit 3.7)
- There are some exceptions. Non-expansion states like Maine, Virginia, and Wisconsin rely little on sales taxes while expansion states like New Hampshire, Nevada and Washington do not have broad-based income taxes.
Tax Policy Changes
- The analysis of state government legislated tax changes shows that the typical expansion and non-expansion states responded to fiscal challenges created by the Great Recession differently; that the typical expansion state notably raised taxes since fiscal year 2008 while the typical non-expansion state had lowered taxes. (Exhibit 3.8)
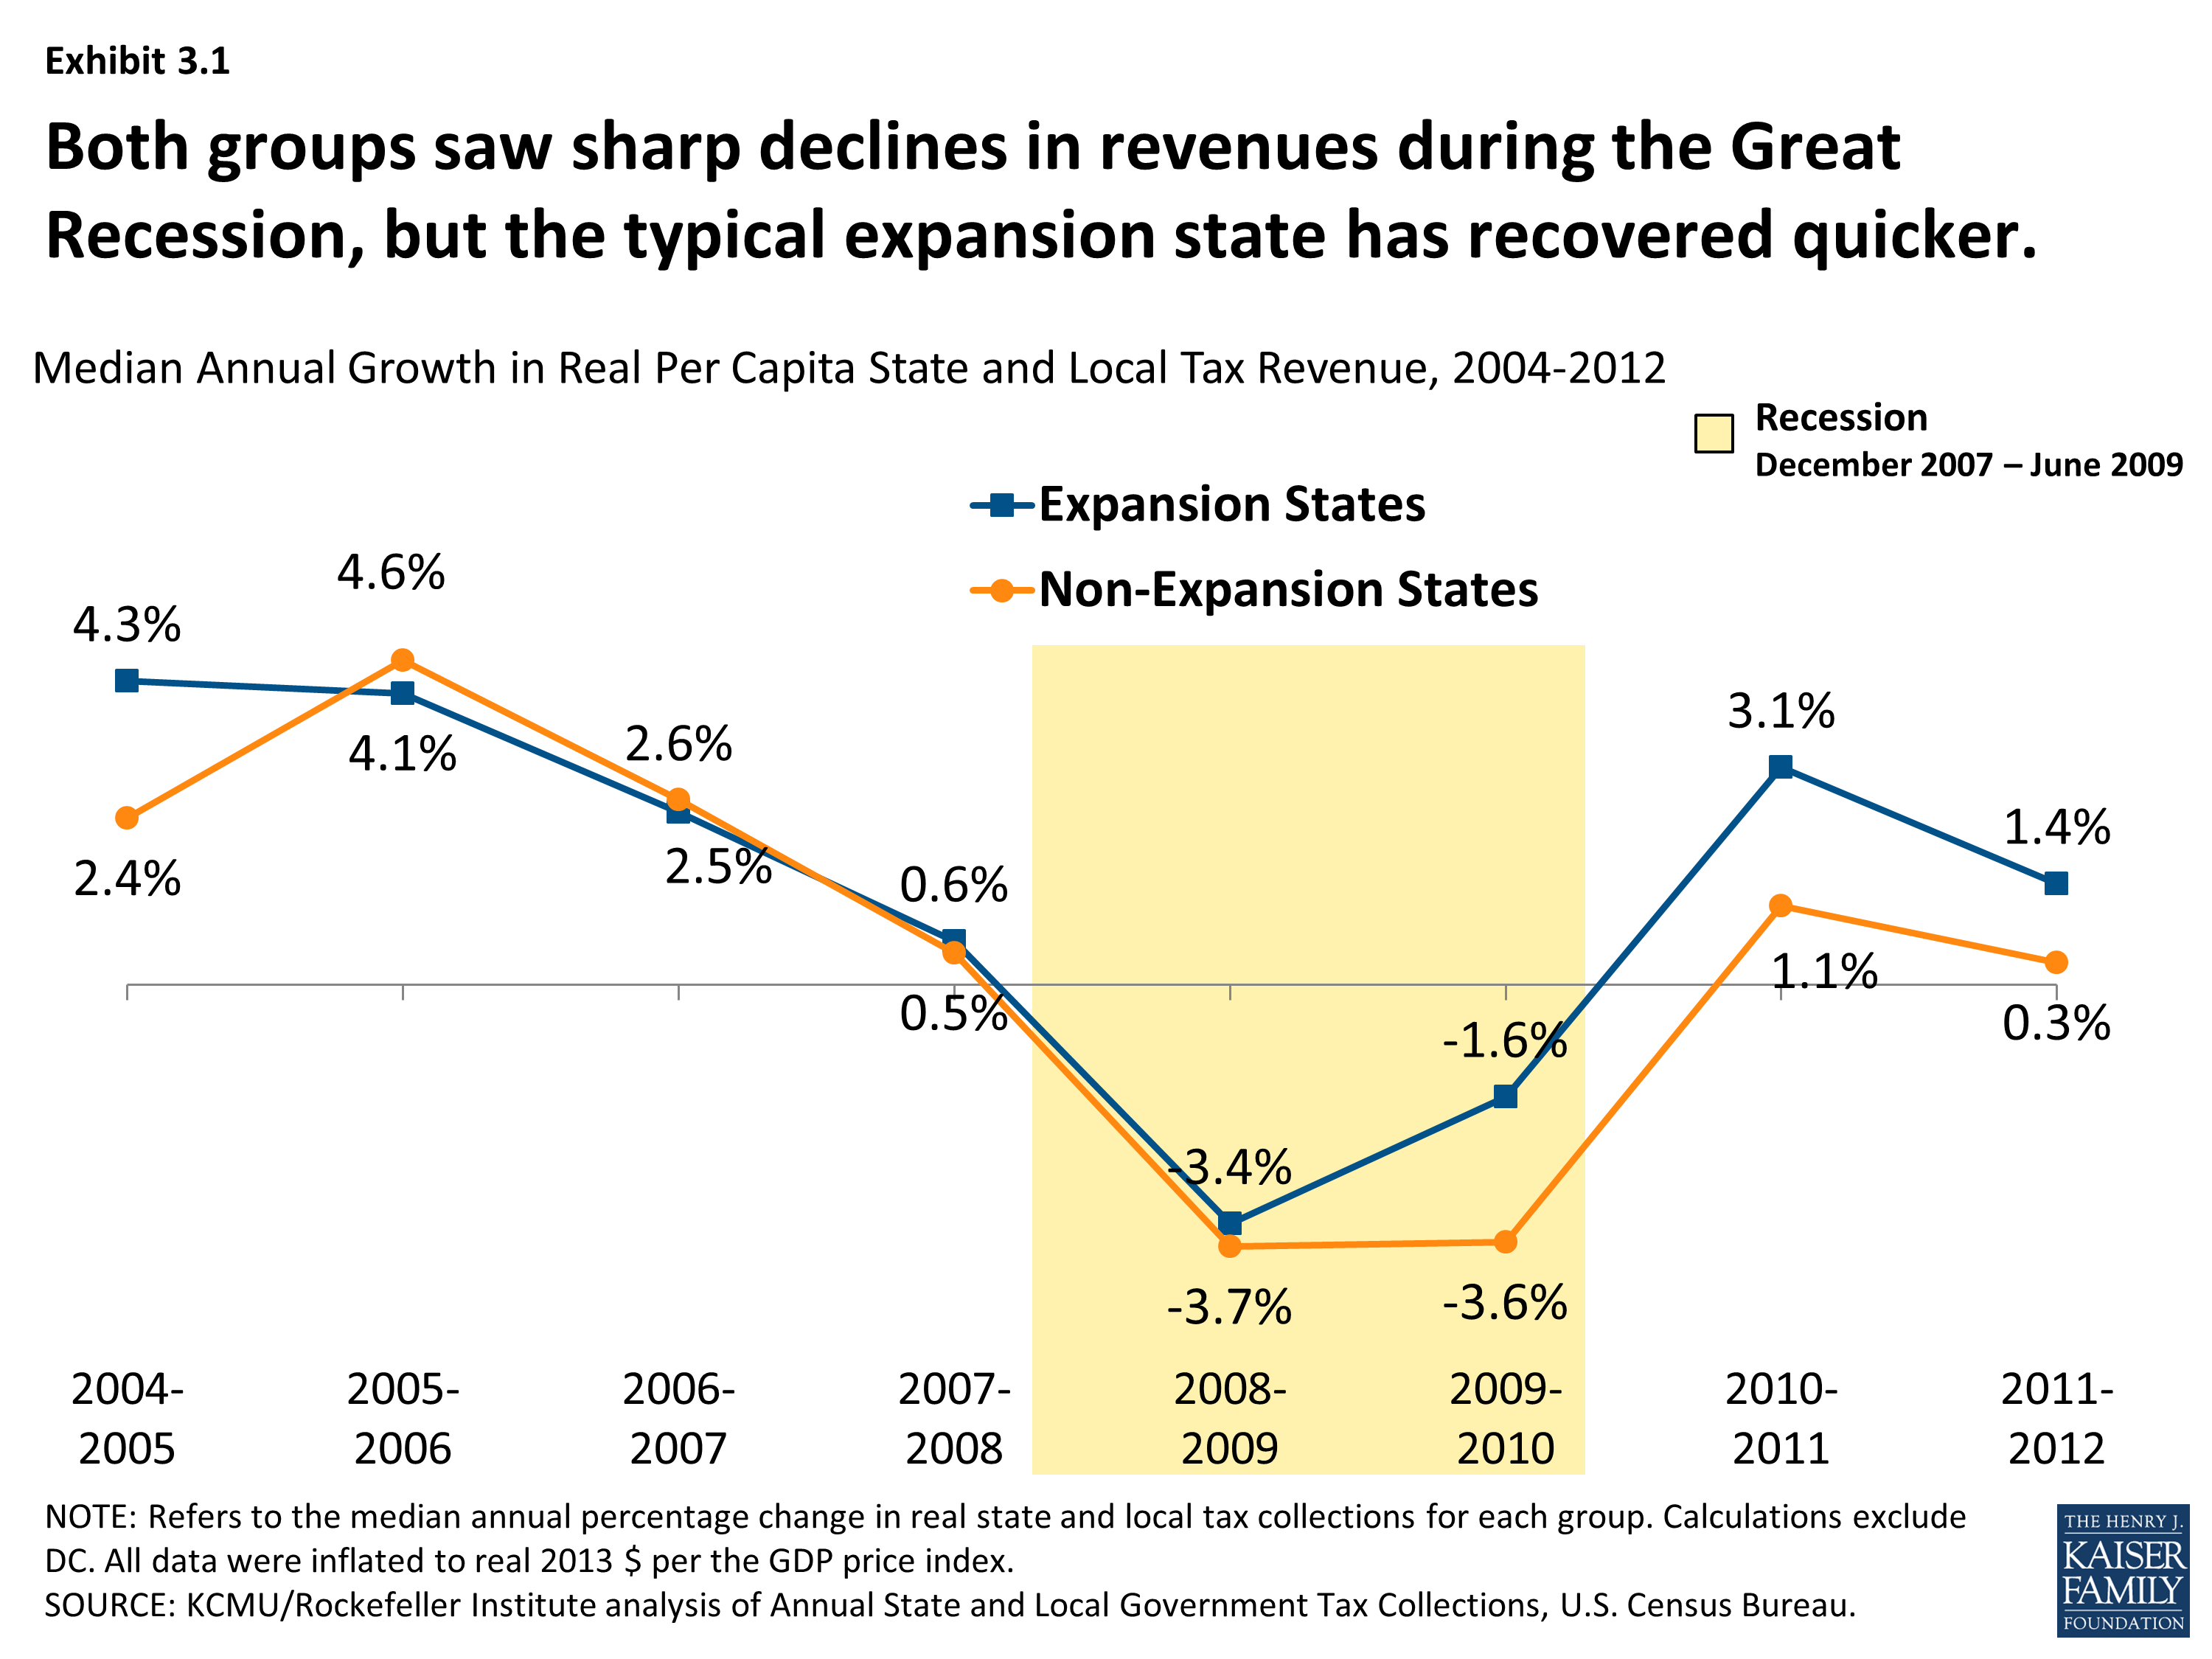
Both groups saw sharp declines in revenues during the Great Recession, but the typical expansion state has recovered quicker.
The typical expansion state has greater tax capacity than the typical non-expansion state, regardless of measure.
The typical expansion state has historically had higher tax capacity; the difference has been growing over time.
The typical expansion state has historically collected more per capita in state and local taxes.
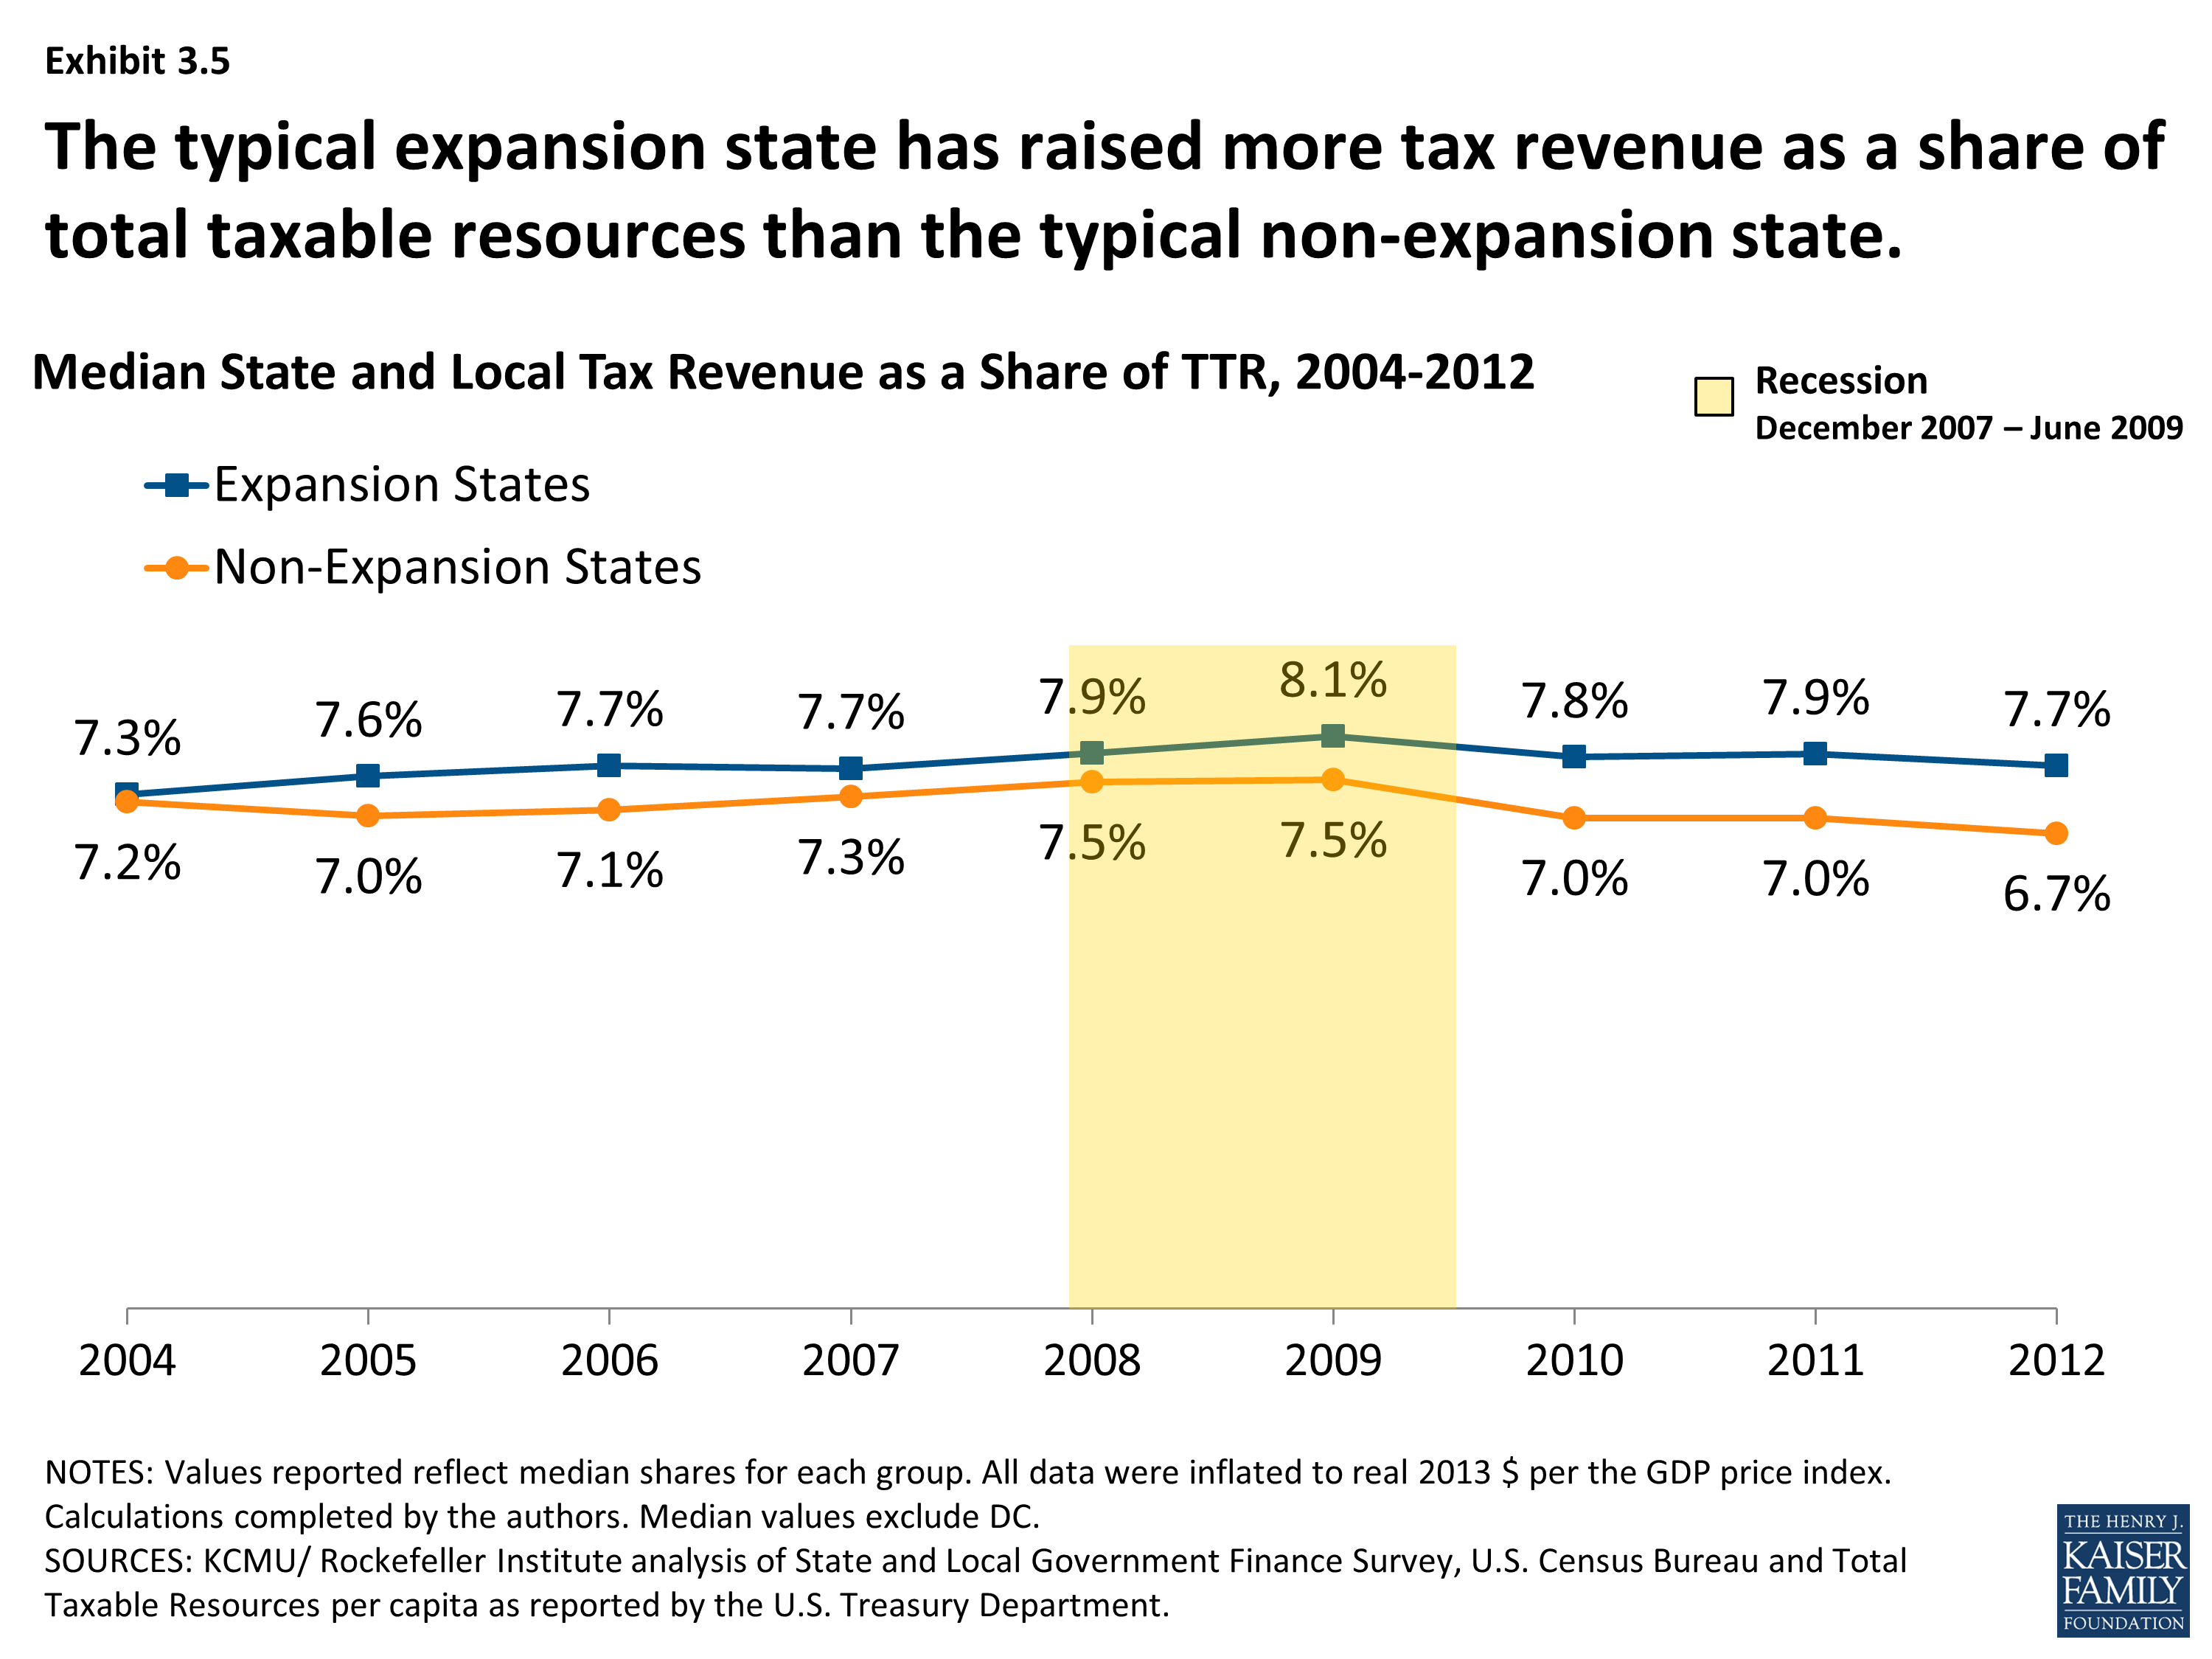
The typical expansion state has raised more tax revenue as a share of total taxable resources than the typical non-expansion state.
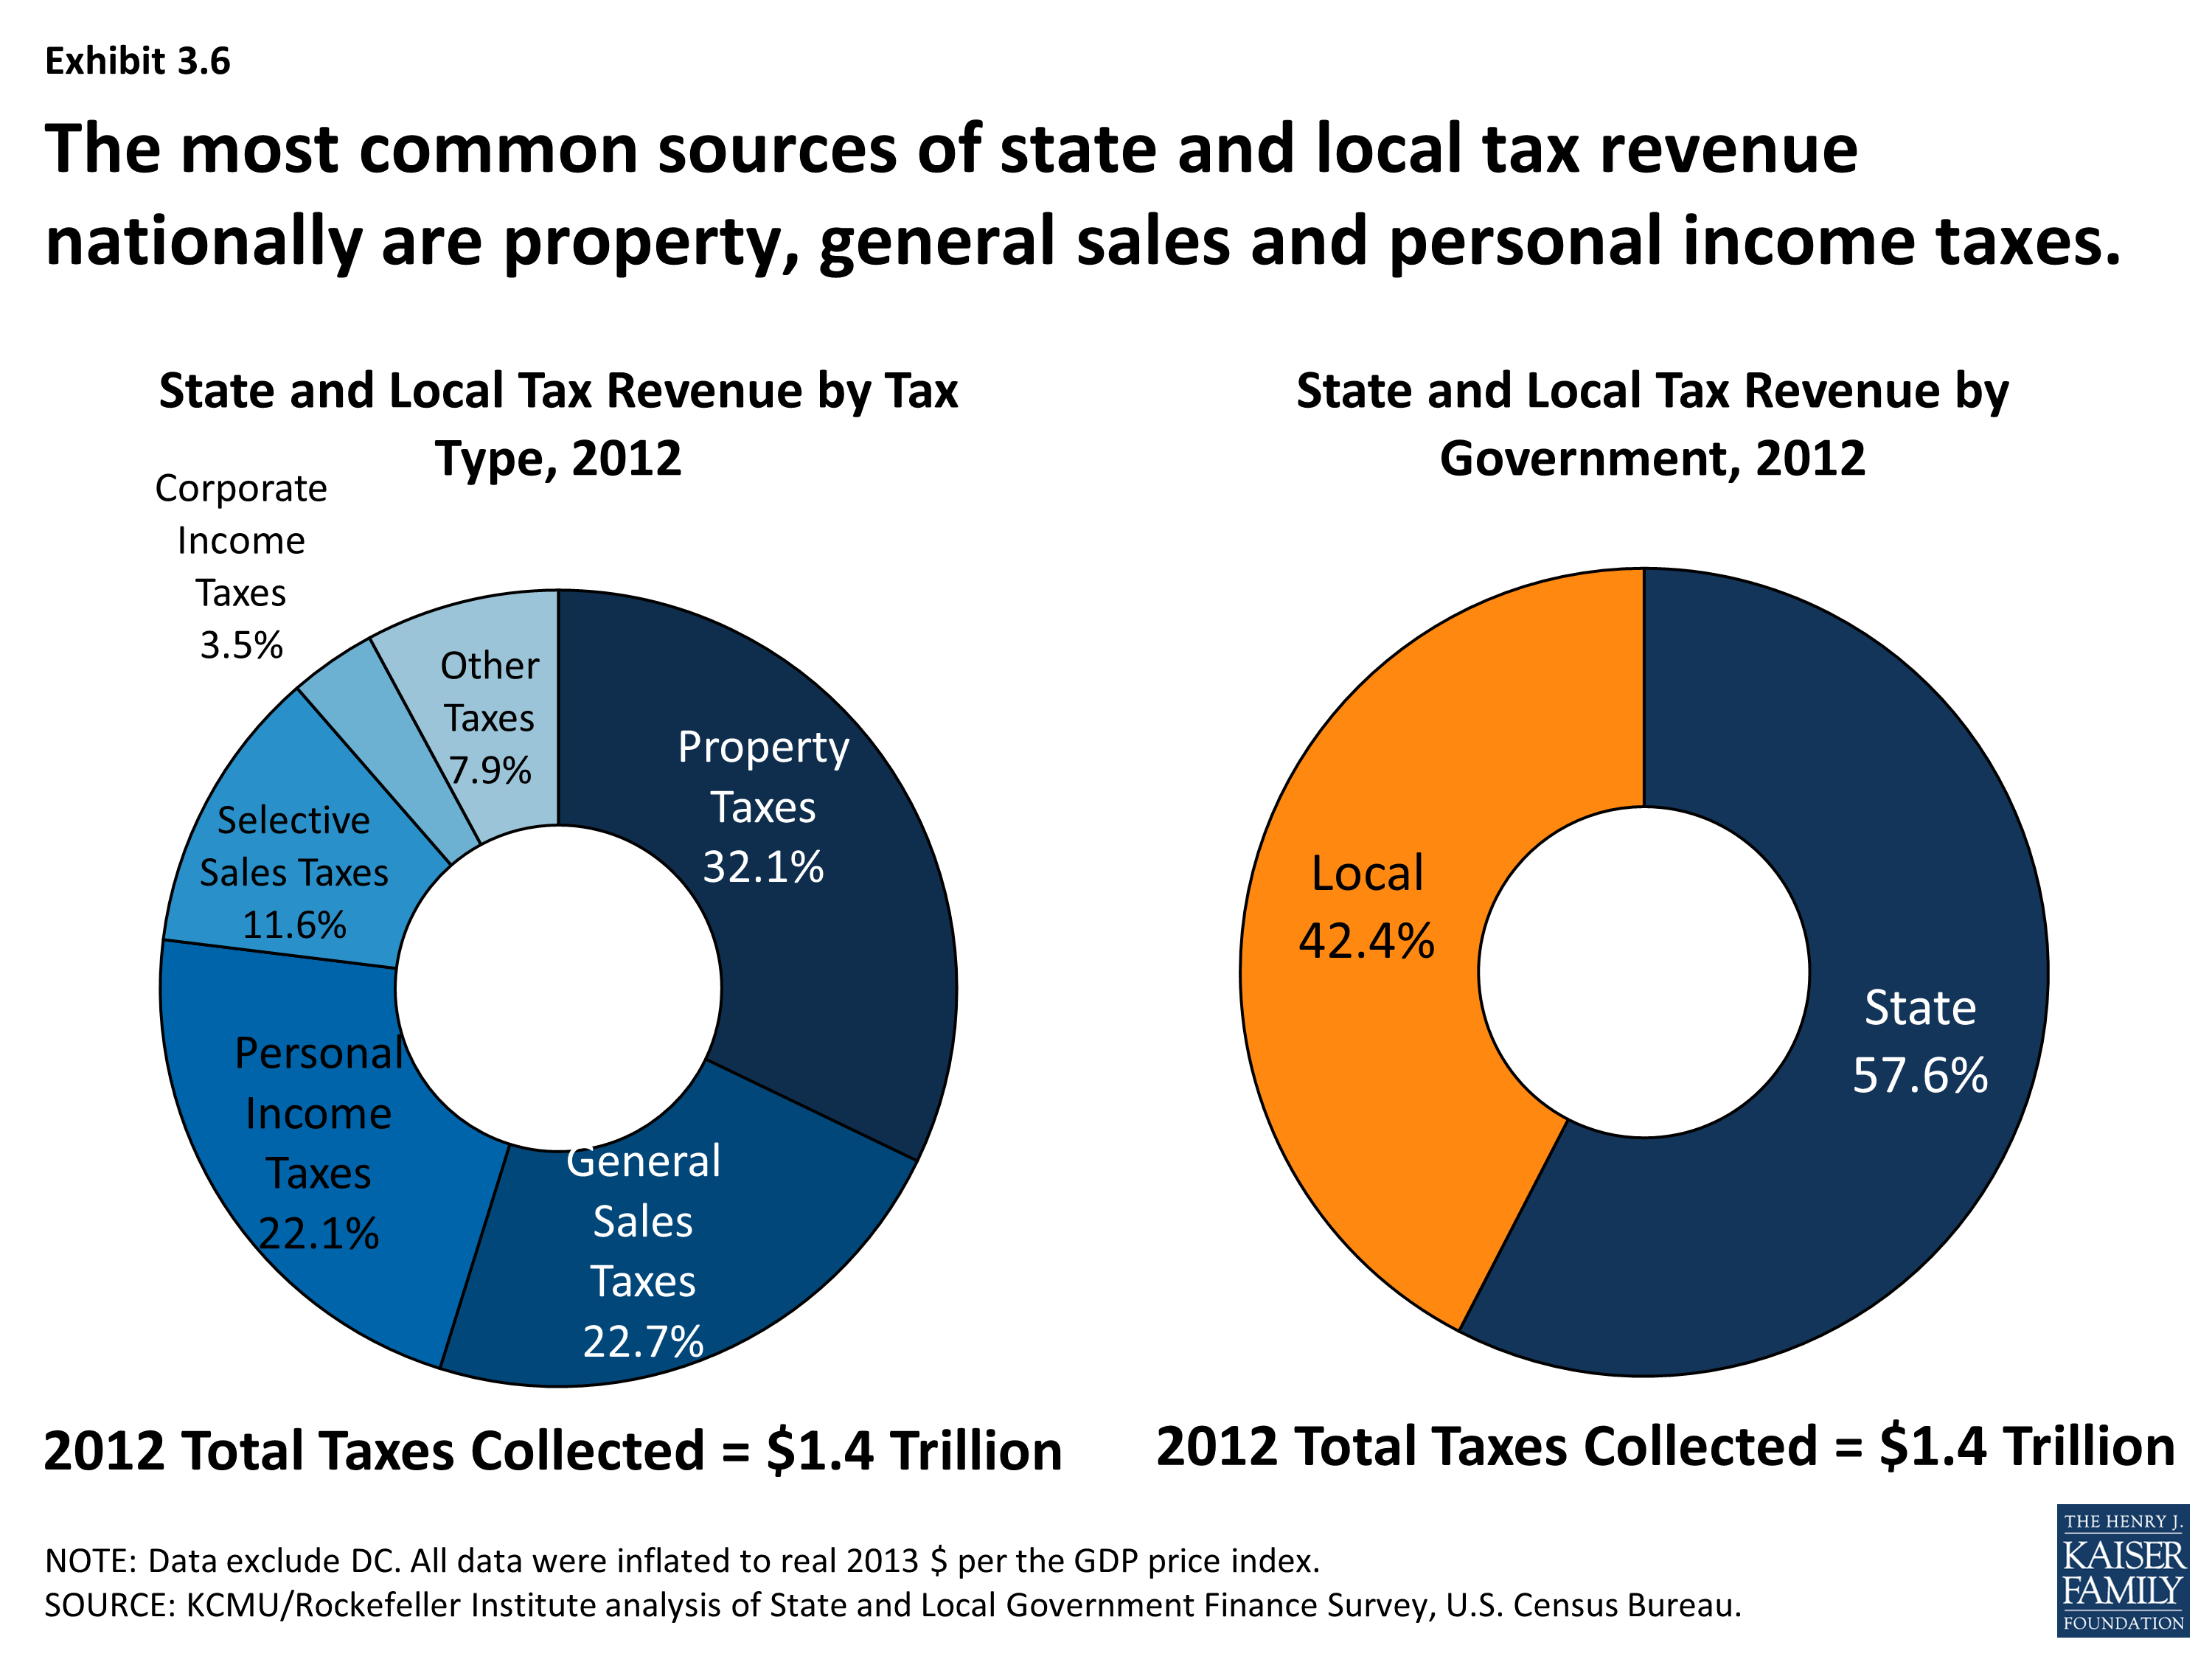
The most common sources of state and local tax revenue nationally are property, general sales and personal income taxes.
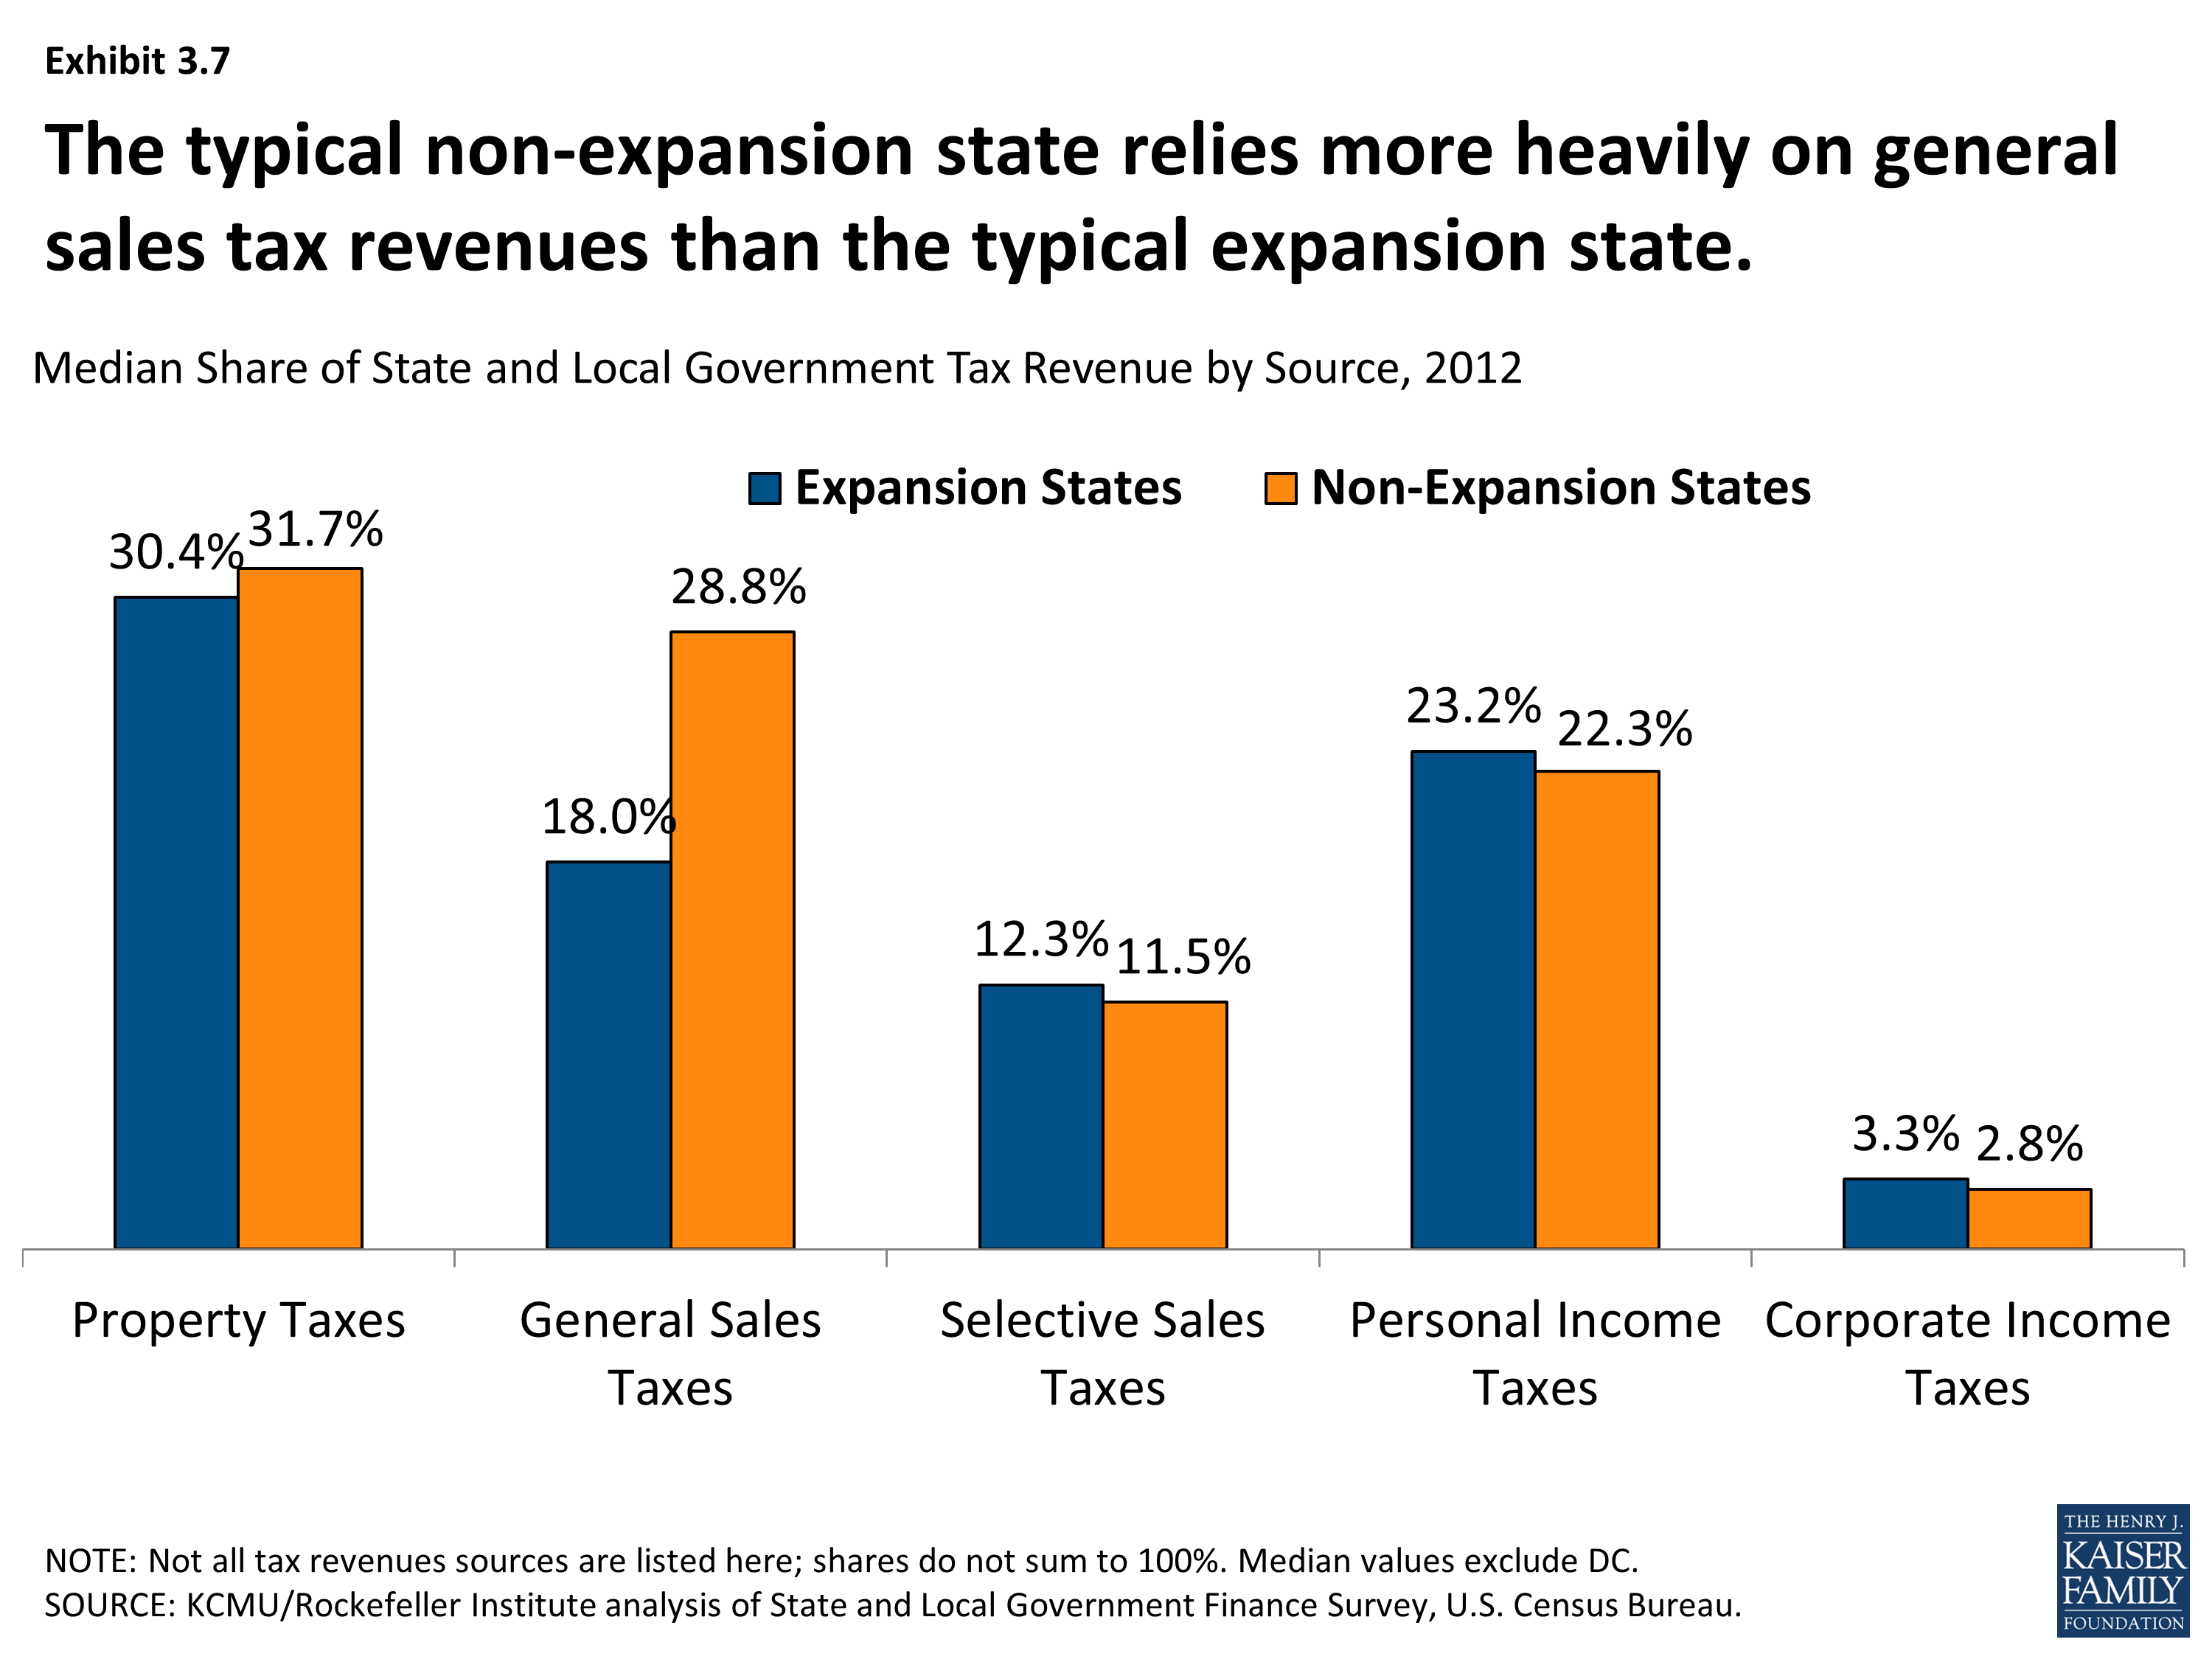
The typical non-expansion state relies more heavily on general sales tax revenues than the typical expansion state.
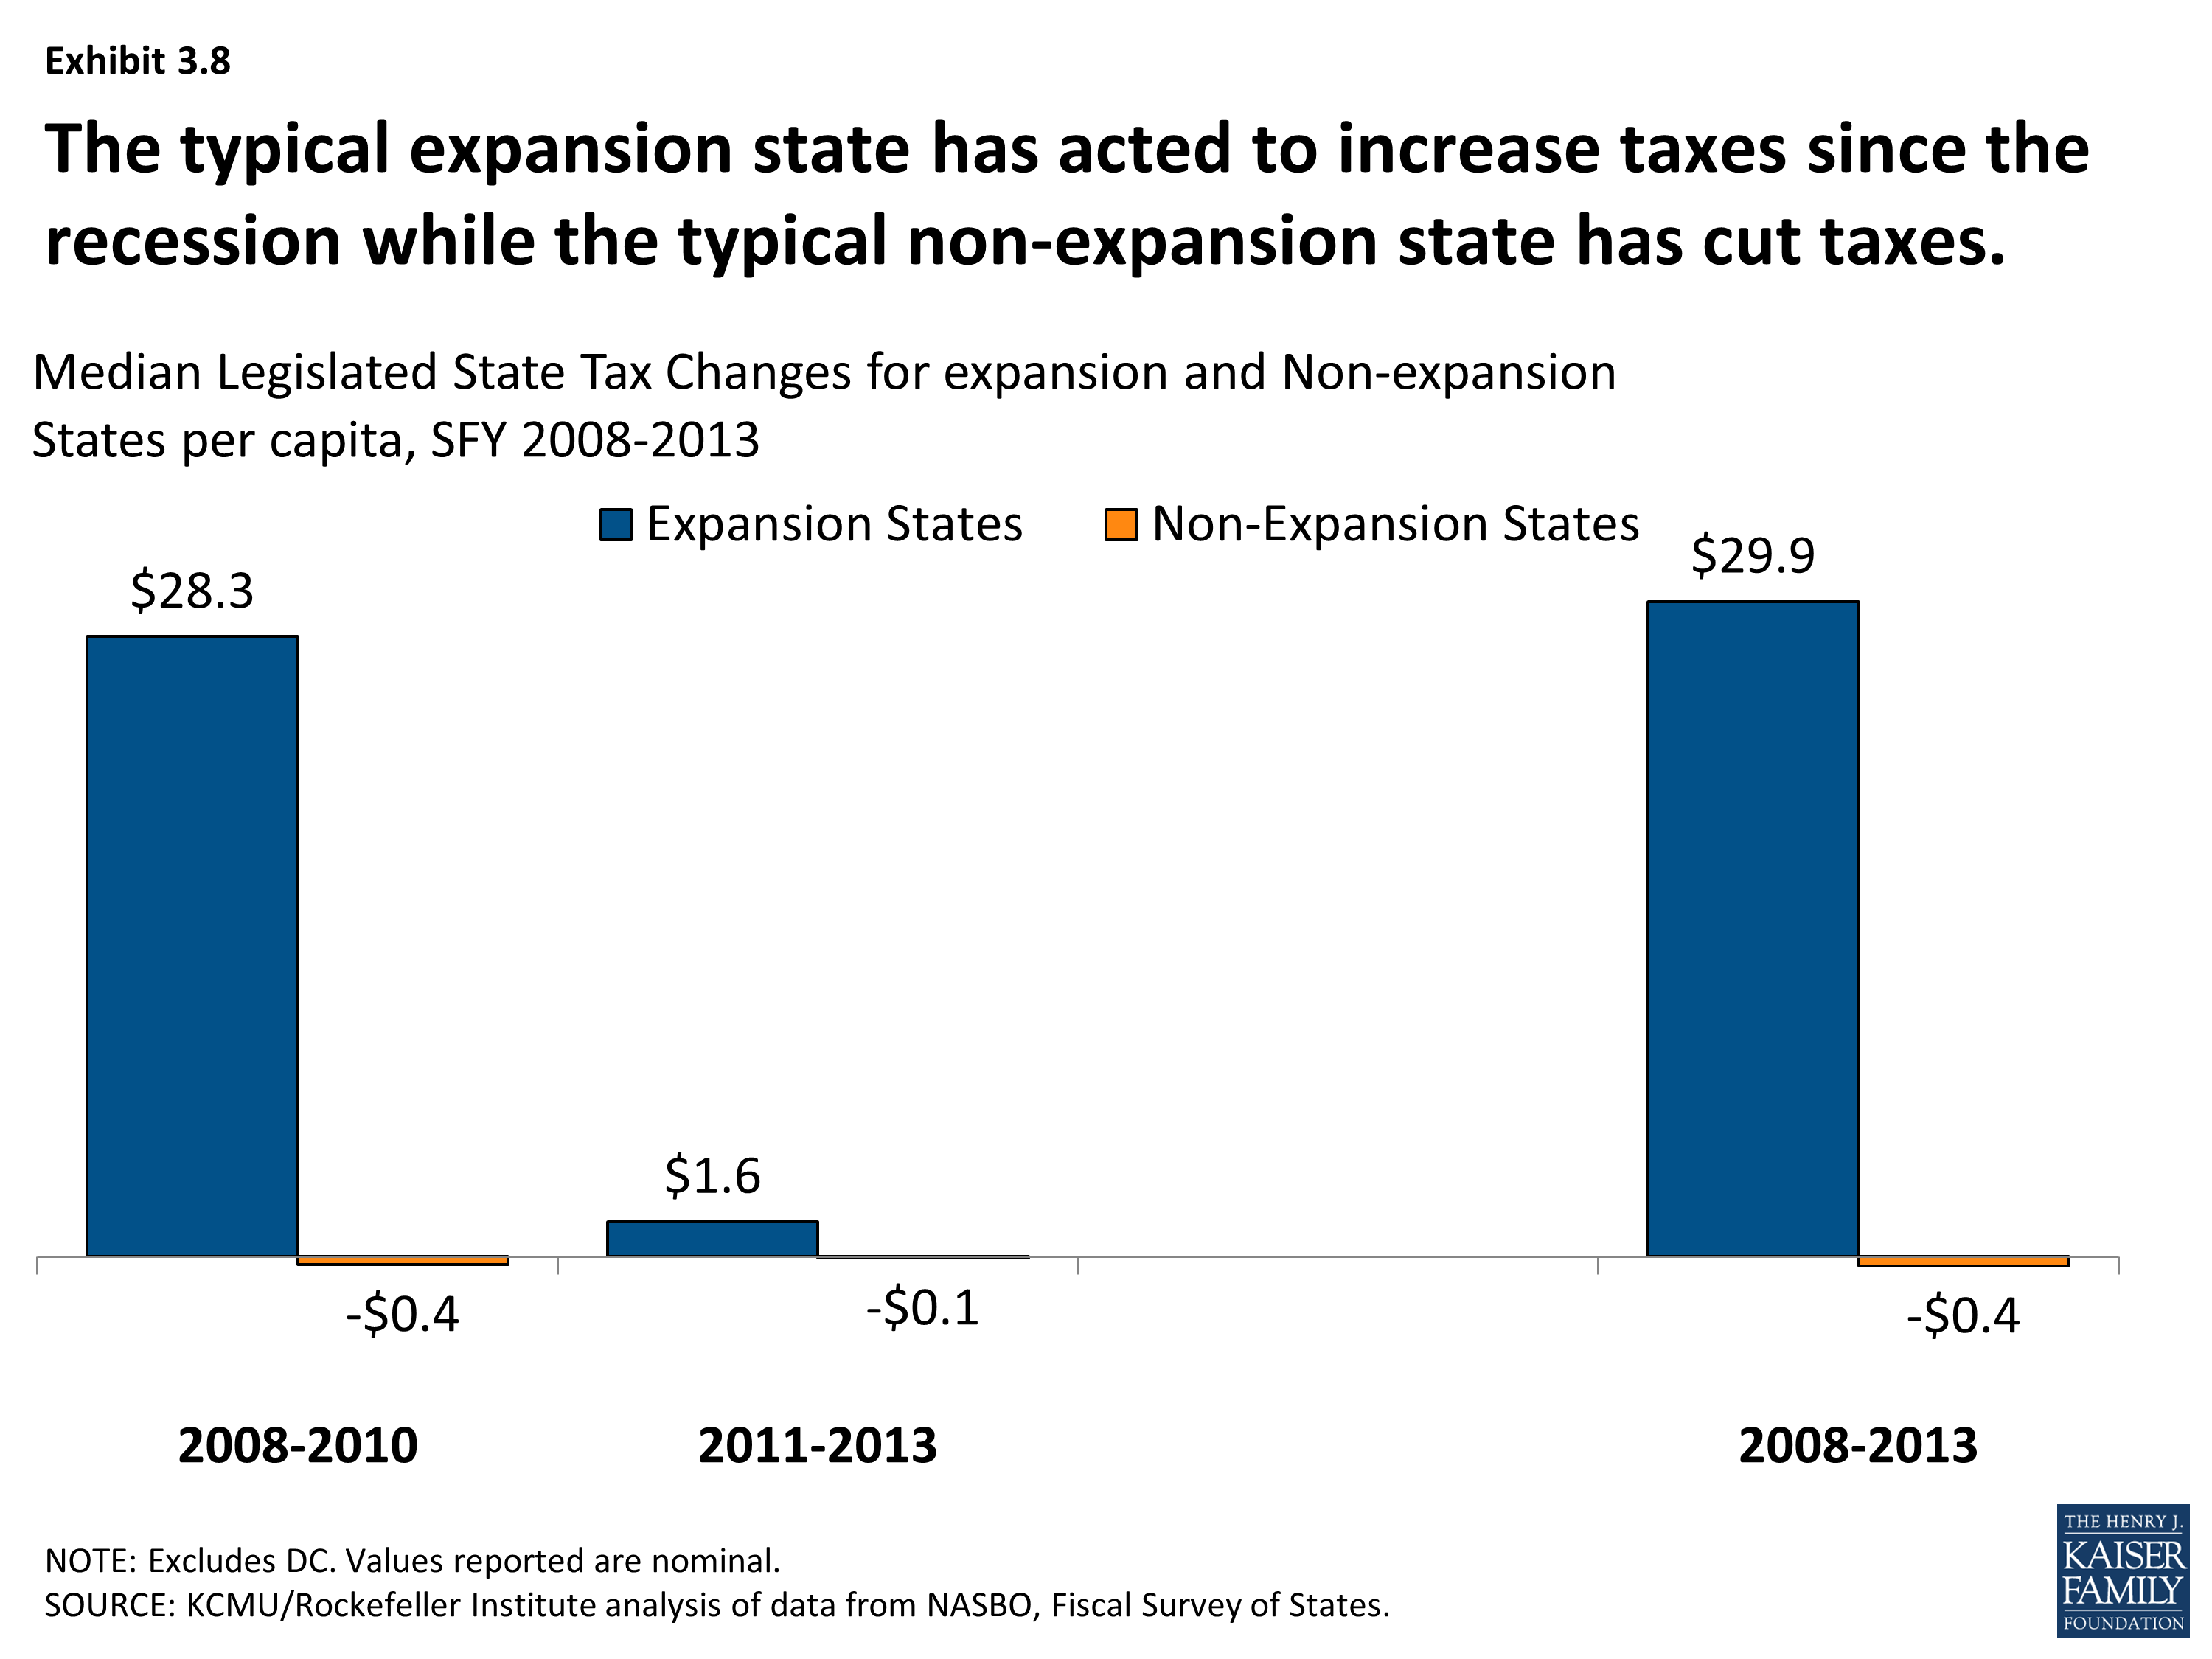
The typical expansion state has acted to increase taxes since the recession while the typical non-expansion state has cut taxes.
How Do Expansion And Non-Expansion States Compare? - Demographics
How Do Expansion And Non-Expansion States Compare? - State Budgets
x
Exhibit 3.1
x
Exhibit 3.2
x
Exhibit 3.3
x
Exhibit 3.4
x
Exhibit 3.5
x
Exhibit 3.6
x
Exhibit 3.7
x
Exhibit 3.8
Topics
