
Economic and Fiscal Trends in Expansion and Non-Expansion States: What We Know Leading Up to 2014
Appendix A - Methodology and Definitions
This analysis focused a series of demographic, fiscal, budget and employment indicators available publicly from the Bureau of Labor Statistics, the Census Bureau, and Department of Treasury, and the Bureau of Economic Analysis. Additional information about the variables included follows. The analysis focused on differences between expansion and non-expansion states over the period from 2000 through 2013 expect for a few sources where the latest available data was for 2012. Analysis of data from the Census Survey of Government Finances, which includes state and local revenue as well as direct general expenditures regardless of fund source (state, local or federal1), examines the period from 2004 to 2012; the US Census did not conduct the survey for local governments for 2001 and 2003. Included as expansion states for this analysis were the 31 states that had adopted the Medicaid expansion as of July 2015; however, the District of Columbia is frequently excluded from median calculations in this analysis as it is not consistently included in all data sources. Non-expansion states include the 19 states that have not adopted the expansion at this time as well as Utah where adoption of the expansion is currently under discussion.(Exhibit A.1) To examine differences between these groups, this analysis focuses on the typical expansion state and the typical non-expansion state, which is defined as the median value for each group. Additionally, all monetary values have been converted to real 2013 dollars to control for inflationary changes.
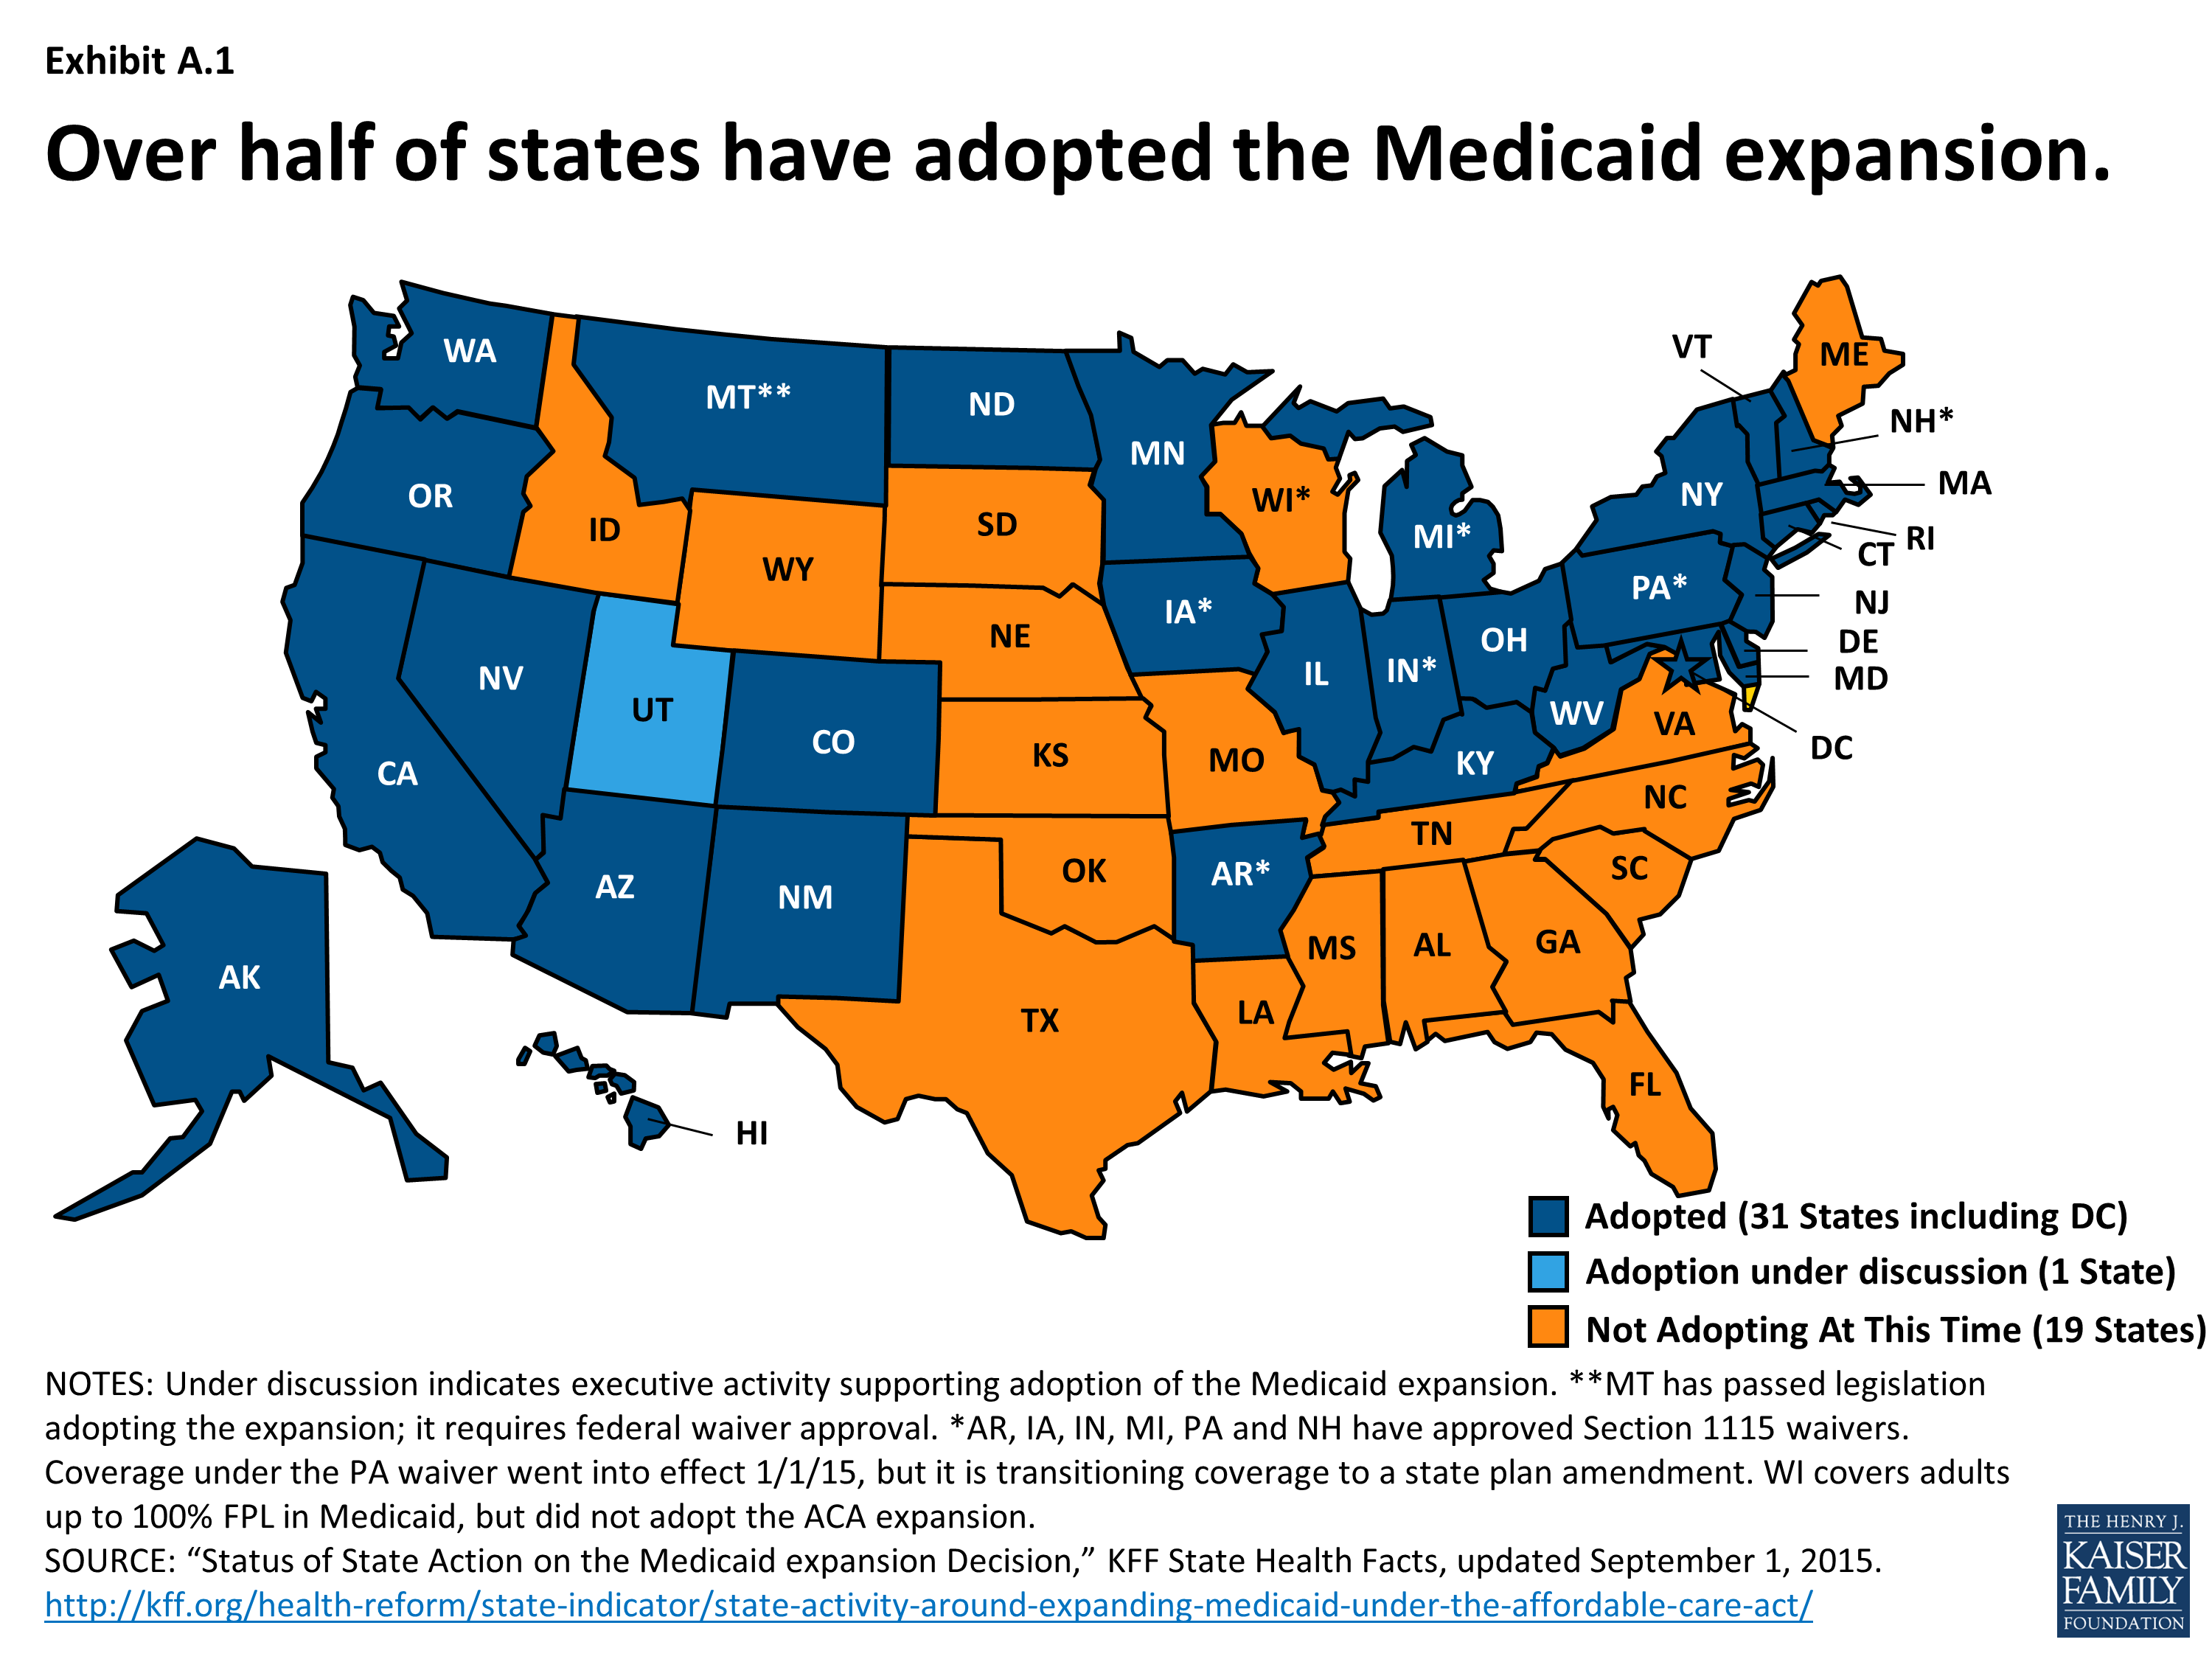
Exhibit A.1: Over half of states have adopted the Medicaid expansion.
Demographics
Age. State spending priorities are affected by the types of populations they serve. For example, states with higher shares of older populations face higher demands for long term care services, which may lead to higher Medicaid spending as Medicaid is the largest purchaser of long term care services. In contrast, states with higher shares of children may face higher demands for education services.
Median Household Income. Household income, which is a measure of all income from those age 15 and older living in the same household, is a common measure of relative wealth of state residents.
Poverty Rates. Many government assistance programs are targeted to help low-income families. Programs administered or supported by the United States Department of Health and Human Services (HHS) use the department’s federal poverty guidelines. The federal poverty guideline for a family of three in the 48 contiguous states and the District of Columbia was $19,530 in 2013.
Health Insurance. The existing status of health insurance coverage and the number of uninsured have been commonly discussed as factors in a state’s decision to adopt the Medicaid expansion. Coverage varied across states due to the availability of employer-based coverage, the scope of public coverage, regulations in the non-group market, poverty rates, and demographics. The share of the population that is uninsured highlights the gap among different coverage options.
Tax Collections and Revenue
Tax Collections. How much tax revenue is collected determines the size of state budgets that lawmakers must then allocate to different spending priorities. A number of factors play into how much is collected – the state tax capacity (how much state and local governments could potentially collect), the composition of state and local taxes (e.g. general sales taxes, property taxes, etc.) and tax policy changes lawmakers elect to make.
Tax Capacity. A state’s tax capacity refers to the potential amount state and local governments could collect through taxes. There are several measures of tax capacity, such as personal income, a state’s gross domestic product as well as a lesser known measure of a state’s total taxable resources – a measure developed by the Treasury Department that addresses concerns with the incompleteness of other measures.
Tax Effort/Tax Collections as a Share of Capacity. Tax capacity is just one factor in determining how much tax revenue states and local governments collect. How much states and localities collect as a share of their potential is a measure of tax effort. Tax collections alone only illustrate the amount the state was able to collect; collections as a share of their capacity controls for the fact that some states are able to potentially collect more.
Composition of Tax Revenue Sources. State and local governments draw their tax revenues from different sources. The most common sources of tax revenue are property taxes, general sales taxes, personal income taxes, corporate income taxes and selective sales taxes (e.g. alcohol and tobacco.) Tax revenues are also separately collected by state and local governments.
Tax Policy Changes. Another factor in determining the amount of revenue that states collect relates to state lawmaker decisions on tax policy. As with determining spending priorities, state lawmakers also determine the tax rates and types of taxes enacted in a state.
State Budgets and Spending
Total State Budget Spending. Data in this section reflect total spending by state and local governments; this includes federal dollars spent by states and localities as well as spending from state and local sources.
Spending categories. This analysis focuses on the following categories of spending:
- Medicaid-related spending: Refers to medical vendor payments according to Census definitions for their annual survey of state and local government finances. This does not include all Medicaid spending, but refers to payments under public welfare programs made directly to private vendors for medical assistance and hospital or health care on behalf of low-income or other medically needy persons. It captures most, but not all, Medicaid spending.
- Health and Hospitals: Refers to spending related to public health programs and other activities (e.g. public health administration, vita statistics, etc.) as well as support for public or private hospitals outside of public welfare programs (e.g. Medicaid). It can include construction costs of hospitals as well.
- K-12 Education: Refers to spending for operation, maintenance and construction of public schools and facilities for elementary and secondary education, including vocational-technical education.
Employment
Employment. Employment, or the number of jobs, is a strong indicator of economic conditions. This analysis focused on total non-farm employment, which includes private sector and government employment.
Unemployment. Unemployment is also a strong indicator of economic conditions. The unemployment rate is measure of the share of the labor force who are not employed; individuals who are no longer looking for work or those under the age of 16 are not counted as part of the labor force and are excluded from such calculations.
Health-Related Employment. Employment in the health and social assistance sectors as defined by the NAICS definition. This includes jobs in ambulatory health care (physician office, dental offices, etc.) outpatient care centers, medial and diagnostic laboratories, hospitals, home health care, nursing facilities and among others.
Topics
