A Final Look: California's Previously Uninsured after the ACA's Third Open Enrollment Period
Section 1: Coverage among the Previously Uninsured
Enrolling in Health Care Coverage
After three rounds of open enrollment under the Affordable Care Act, 72 percent of Californians who were uninsured prior to the first open enrollment period now report that they have health insurance. This is similar to the share who were insured after the second open enrollment period (68 percent), which may indicate a stabilizing of health insurance coverage. About one-fourth (27 percent) report being currently uninsured, a group referred to throughout this report as the “remaining uninsured.” Excluding those who are likely ineligible for coverage under the ACA due to their immigration status,1 78 percent of California’s eligible uninsured now report having coverage.
For the purposes of this report, the “eligible uninsured’” are California residents who said they had been uninsured for at least two months in the baseline survey and would be eligible for participation in the ACA coverage expansion based on their self-reported status as a citizen, permanent resident, or lawfully present immigrant.2
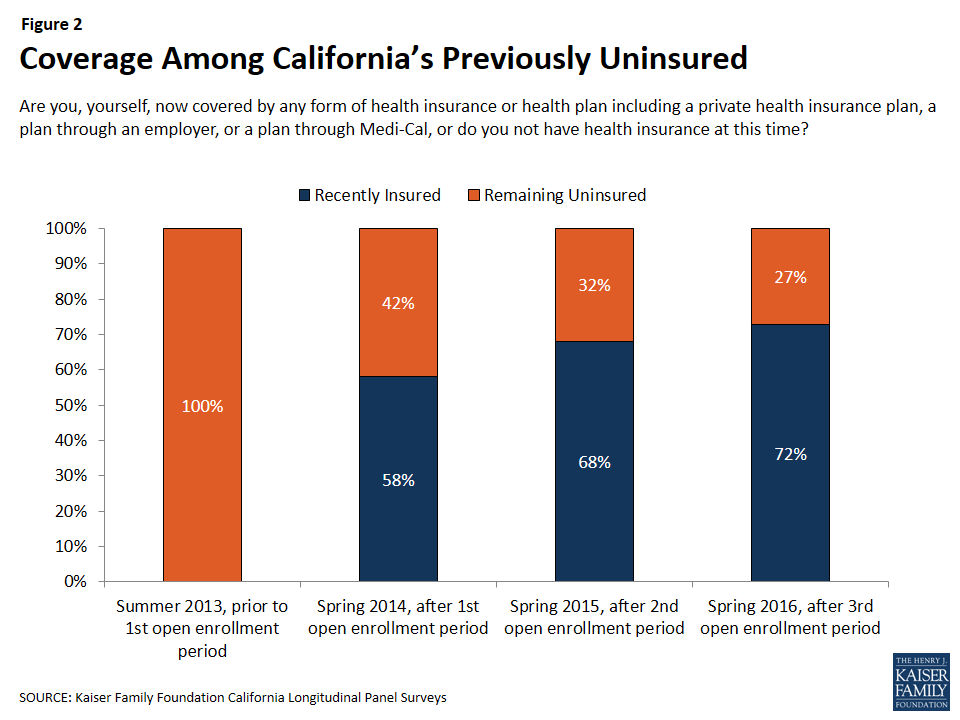
Figure 2: Coverage Among California’s Previously Uninsured
Those previously uninsured Californians who report after the third open enrollment period that they have health insurance (72 percent), referred to throughout this report as “California’s recently insured,” say they gained coverage from several different sources. The largest share of California’s previously uninsured (33 percent) say they have coverage through the state’s Medicaid program, Medi-Cal, which is similar to the share reported in 2015 (34 percent). One in five say they have insurance through an employer, up from 14 percent in 2015. About one in ten (11 percent) say they have a plan through Covered California, the state’s health insurance marketplace where people can shop for and compare health insurance plans and access federal subsidies for coverage, and another 8 percent say they have non-group coverage or insurance through some other source.3
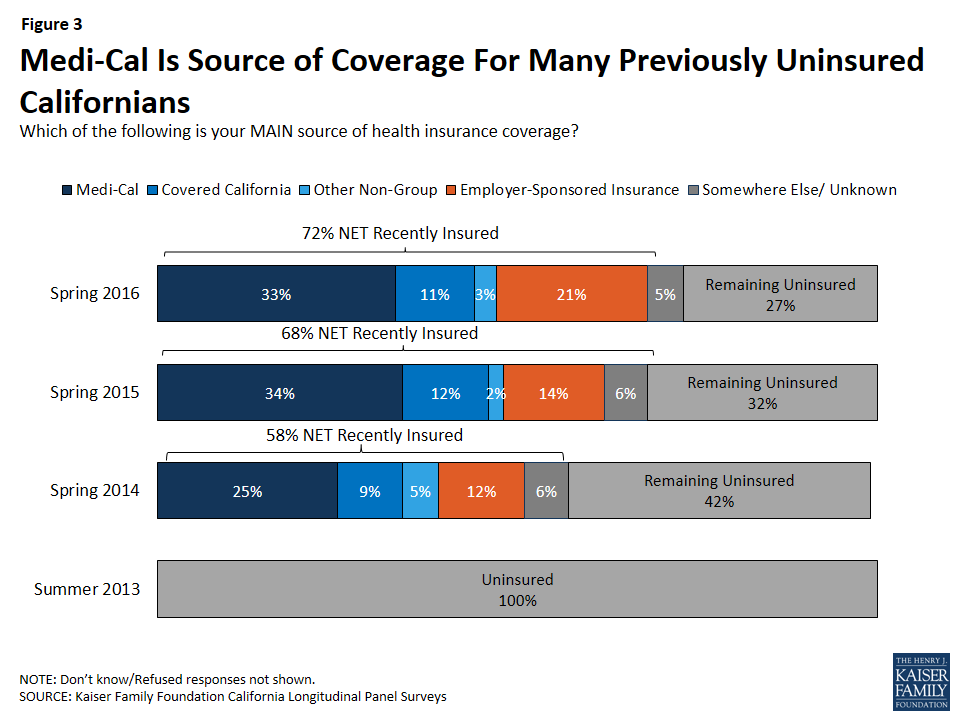
Figure 3: Medi-Cal Is Source of Coverage For Many Previously Uninsured Californians
Who Now Has Coverage?
Similar shares of many demographic groups now report having coverage, such as men and women, people of different ages, and people of different employment status, with one notable exception: Hispanic individuals. One-third of previously uninsured Hispanic individuals still do not have insurance, with individuals who may not be eligible for insurance comprising nearly half of this group. This subgroup is examined in more depth in Section 3.
There are some factors that contribute to now being insured. Over half (62 percent) of those who said in 2013 that they had spent their lifetime without insurance now report having coverage while nearly eight in ten of the individuals who reported in 2013 that they had health insurance less than a year earlier report now being insured. Previously uninsured people who report being in good health are slightly less likely to say they have coverage than those who report being in fair or poor health (69 percent v. 78 percent). In addition, those who report having a debilitating chronic disease that keeps them from fully participating in work or other activities are more likely to say they have coverage now than those without significant chronic disease (85 percent vs. 70 percent).
| Table 1: Percentage Of Each Group Of Previously Uninsured Reporting That They Are Recently Insured Or Remain Uninsured | |||||||
| TOTAL RECENTLY INSURED IN 2016 |
COVERAGE TYPE IN 2016 | TOTAL REMAINING UNINSUREDIN 2016 |
|||||
| Medi-Cal | Covered California | Other Non-Group | Employer-Sponsored Insurance | ||||
| TOTAL | 72% | 33% | 11% | 3% | 21% | 27% | |
| AGE | 19-34 | 70% | 30% | 8% | 1% | 28% | 29% |
| 35-49 | 65% | 28% | 8% | 6% | 20% | 35% | |
| 50-64 | 81% | 42% | 18% | 3% | 14% | 19% | |
| RACE | White non-Hispanic | 80% | 33% | 15% | 6% | 21% | 18% |
| Hispanic (NET) | 67% | 32% | 8% | 2% | 21% | 33% | |
| Hispanic, Eligible | 76% | 37% | 11% | 3% | 22% | 24% | |
| GENDER | Male | 72% | 30% | 10% | 2% | 24% | 27% |
| Female | 73% | 38% | 11% | 5% | 17% | 27% | |
| LENGTH OF TIME UNINSURED PRIOR TO ACA | 2mo – <1 year | 81% | 32% | 10% | 5% | 32% | 19% |
| 1 year to <2 years | 75% | 33% | 7% | 3% | 26% | 25% | |
| 2 or more years | 77% | 35% | 14% | 3% | 19% | 23% | |
| Never had insurance | 62% | 32% | 7% | 3% | 16% | 37% | |
| EMPLOYMENT | Employed | 75% | 27% | 13% | 2% | 31% | 25% |
| Unemployed | 60% | 44% | 8% | 3% | 4% | 38% | |
| A student, retired, on disability, or stay at home parent | 72% | 44% | 7% | 6% | 4% | 28% | |
| EDUCATION | High school or less | 65% | 35% | 6% | 3% | 18% | 34% |
| Some college | 79% | 35% | 15% | 4% | 21% | 21% | |
| College or more | 88% | 22% | 21% | 3% | 36% | 12% | |
| HEALTH STATUS | Excellent/ Very good/ Good | 69% | 30% | 12% | 4% | 20% | 30% |
| Fair/ Poor | 78% | 39% | 8% | 2% | 22% | 22% | |
| MARITAL STATUS | Married | 71% | 27% | 12% | 4% | 23% | 29% |
| Not married | 73% | 37% | 10% | 3% | 20% | 26% | |
| FAMILY INCOME | Less than 138% FPL | 71% | 49% | 4% | 4% | 11% | 29% |
| Between 138% – 400% FPL | 73% | 18% | 17% | 2% | 30% | 27% | |
| DEBILITATING CHRONIC CONDITION | Yes | 85% | 44% | 15% | 3% | 12% | 15% |
| No | 70% | 31% | 10% | 4% | 22% | 30% | |
The Enrollment/Renewal Process
Being contacted by phone, email or a door-to-door visit about signing up for health insurance appears to have played a role in some of California’s previously uninsured gaining or keeping coverage. A large majority (85 percent) of those who say they were personally contacted since November 1st say they now have coverage, compared to 68 percent of those who report that they were not contacted.
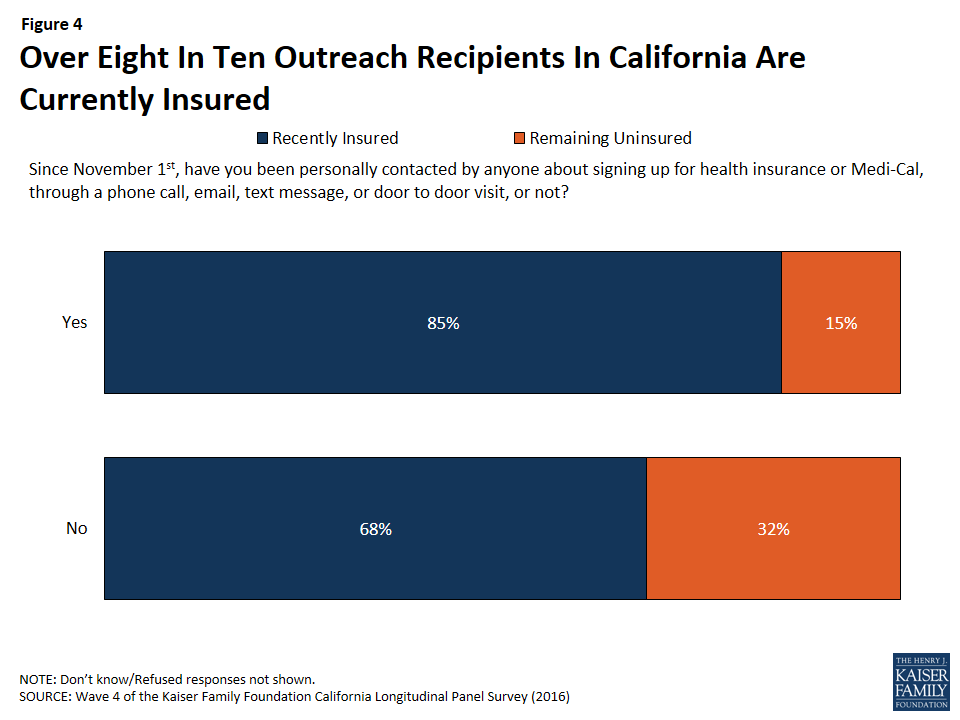
Figure 4: Over Eight In Ten Outreach Recipients In California Are Currently Insured
In addition, of the recently insured individuals whose main source of health insurance is not an employer-sponsored plan, 43 percent say that someone either helped them complete the enrollment/renewal process or someone else did the entire thing. This share includes 14 percent who report that a Covered California representative helped them enroll or renew, which is slightly higher than the share (8 percent) who say a community or county health worker helped them or who say a health plan representative helped them. Five percent of recently insured individuals without employer-sponsored coverage say a family member or friend helped them enroll or renew.
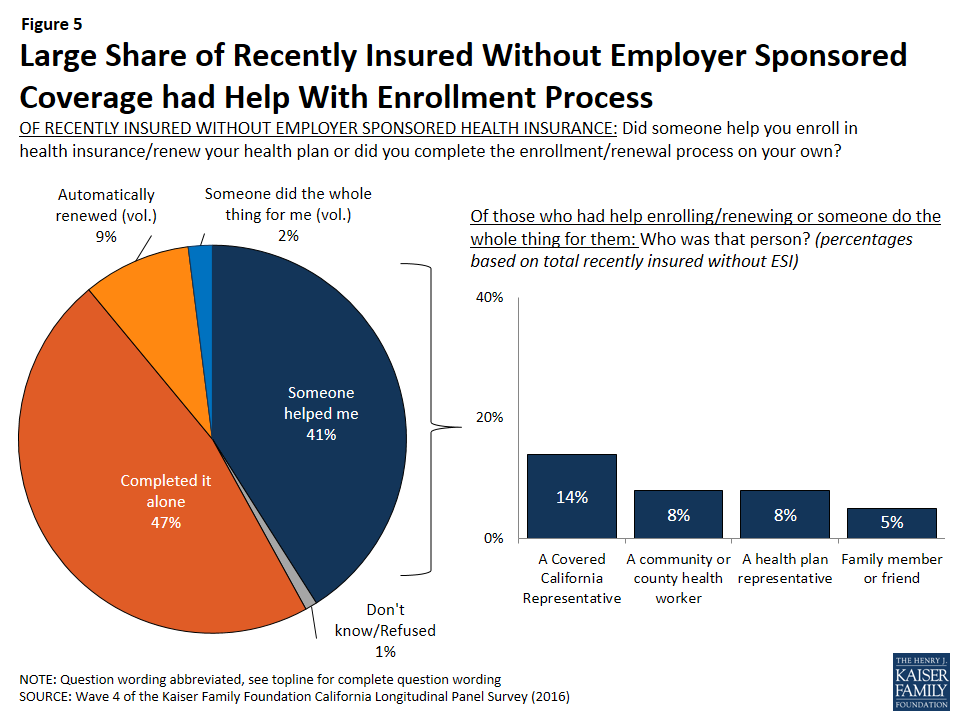
Figure 5: Large Share of Recently Insured Without Employer Sponsored Coverage had Help With Enrollment Process
The majority of California’s recently insured (70 percent) have the same plan in 2016 that they did in 2015 while one-fourth say they changed to a different plan and 5 percent were uninsured last year. This is also true of only those who got health insurance through Covered California. Of individuals who currently have health insurance coverage through Covered California, 68 percent say they have the same health insurance plan as they had last year in 2015, one-fourth say they changed to a different plan, and 7 percent were uninsured in 2015.
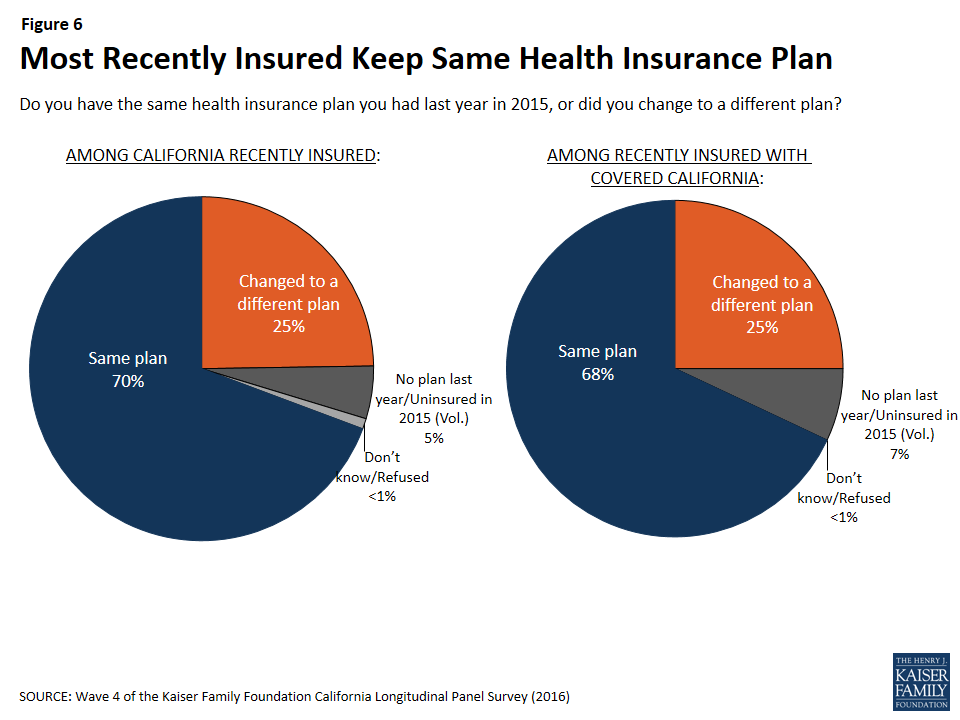
Figure 6: Most Recently Insured Keep Same Health Insurance Plan
For most recently insured, re-enrolling was automatic, with two-thirds saying they were re-enrolled in the same health plan without having to take any action while one-third say they took action to re-enroll in their same health plan. Only 15 percent of those who kept the same plan as they had last year shopped around for another health plan (9 percent of total insured).
Changing Health Insurance Plans
Of the one-fourth of California’s recently insured who did change health insurance plans, about three-fourths (77 percent) found the process either “very easy” or “somewhat easy” while 22 percent say the process was either “somewhat” or “very” difficult.
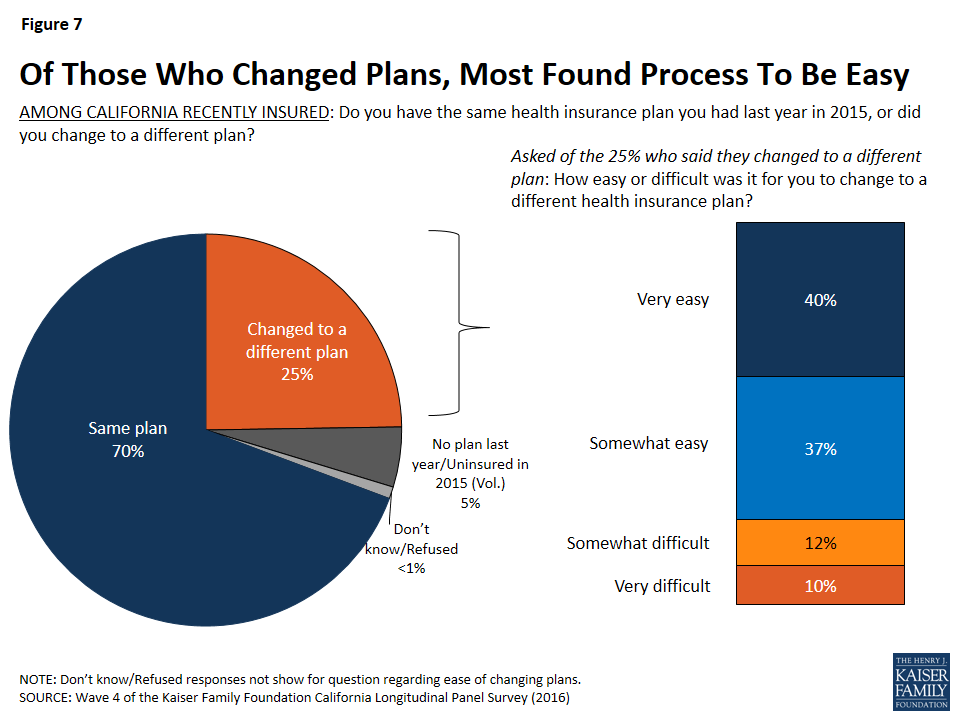
Figure 7: Of Those Who Changed Plans, Most Found Process To Be Easy
When those who had changed plans in the past year were asked their reasoning for switching to a different health plan, more than half (56 percent) say it was because their income changed. This was followed by half (49 percent) who say it was because they were able to enroll in an employer-sponsored plan, 31 percent who found a plan with a lower monthly premium, 28 percent who wanted a plan with more choice in providers, 27 percent who wanted a plan with a lower annual deductible, and 22 percent who said their or their family’s health needs changed. Only 5 percent say they changed health plans because they wanted to be eligible for government financial help.4
Dynamics In Enrollment And Coverage
People tend to move in and out of coverage as their income, employment status and other life factors change, particularly those with lower incomes or recent experience being uninsured. Many (57 percent) Californians who reported being uninsured in 2013, prior to the ACA’s first open enrollment period, reported gaining insurance in the spring 2014 or the second open enrollment period (spring 2015), and now report still having insurance coverage after the third open enrollment period (spring 2016). These individuals are referred to here as those “still insured.”5 While these people may have fluctuated in and out of coverage or changed plans over the course of the past two years, they are not new to health insurance. Another 15 percent of California’s previously uninsured are more likely to be new to their coverage because they reported being uninsured in the survey they most recently completed (whether it was Wave 3 or Wave 2). This group is referred to here as the “newly insured.”6 In addition, 22 percent of people reported being uninsured after three open enrollment periods and another 5 percent said they had coverage in the most recent survey they completed (either Wave 3 or Wave 2) but now say they are without health insurance. These groups combined are referred to here as the “remaining uninsured.” To see a demographic profile of each of these groups, see Appendix A.
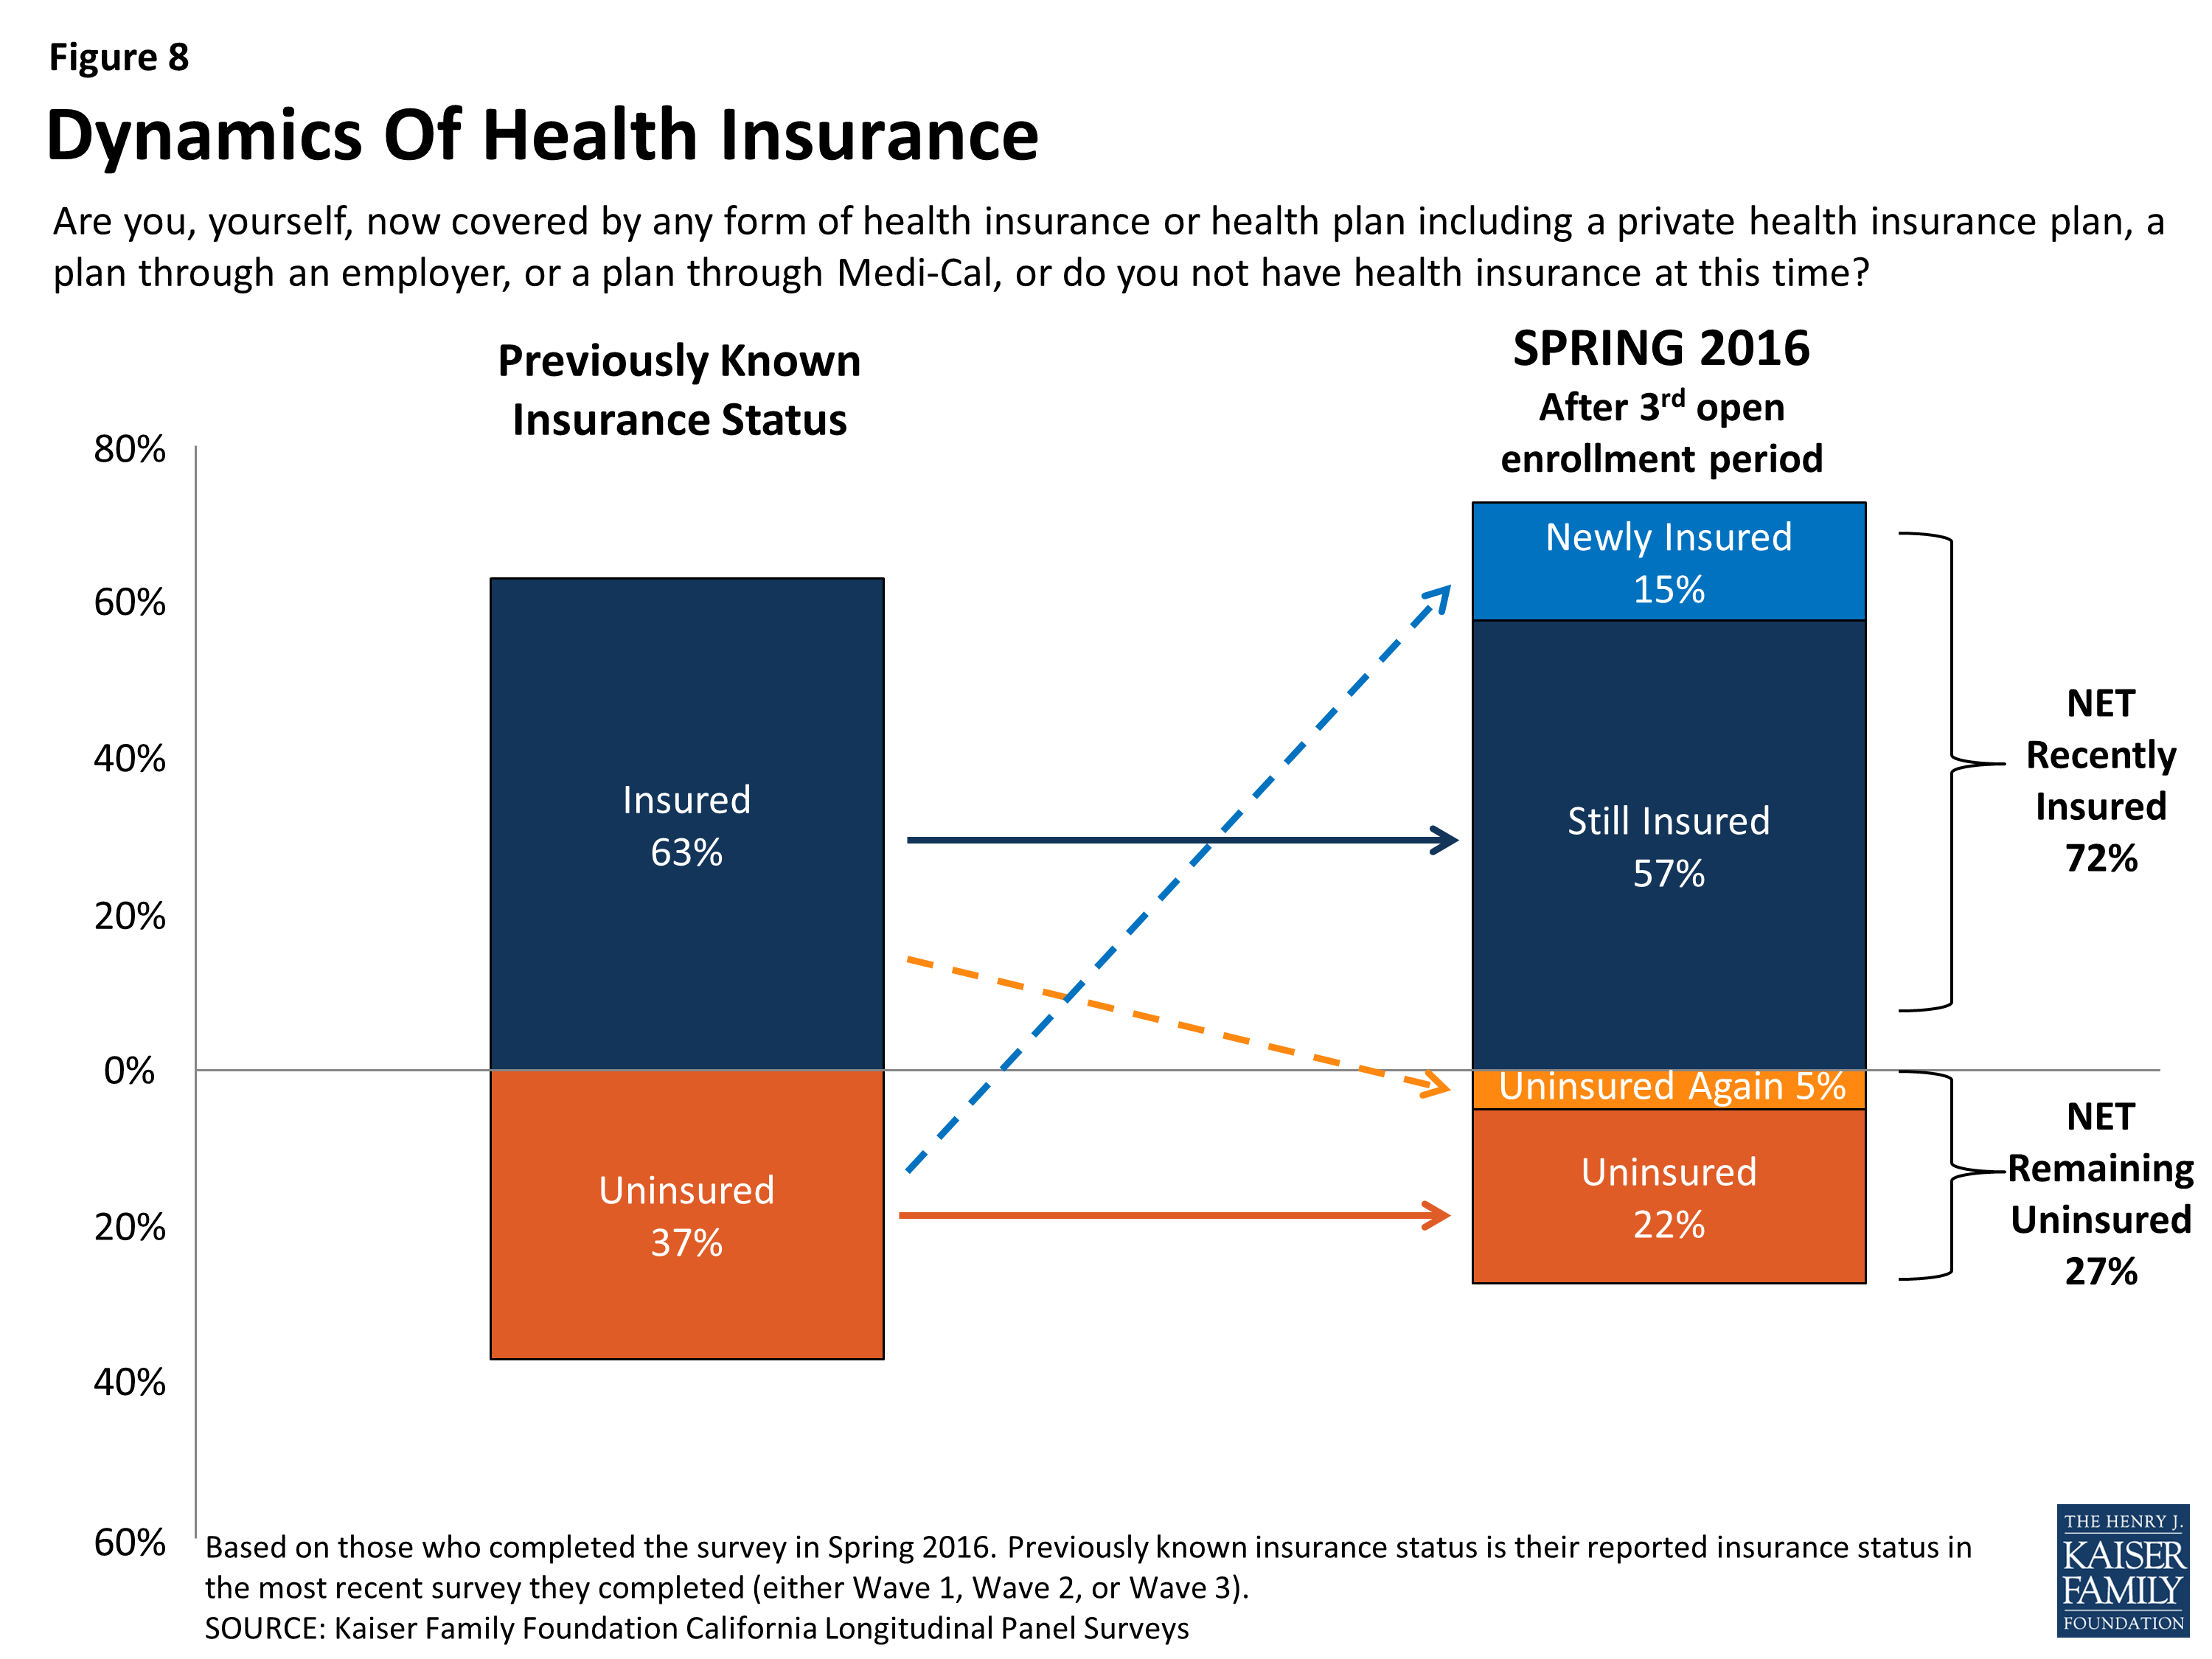
Figure 8: Dynamics Of Health Insurance
Getting Health Insurance Coverage and Keeping Coverage
By tracking the insurance status of these individuals over a period of four years, it is clear that the majority of individuals who get health insurance coverage keep some form of coverage. Individuals who completed all four waves of interviews are known as “habitual respondents.” In the first survey, conducted in 2013, 70 percent of the habitual respondents reported not having health insurance for a period of at least 2 years. Now, after collecting the insurance status of these individuals over the past three years, we can report that 63 percent of these individuals have reported having health insurance for at least one year, including 48 percent who have had coverage for at least two years. In addition, 14 percent of the habitual respondents have unstable health insurance status meaning that they have gotten health insurance in the past two years and have subsequently lost their coverage. Of the individuals with unstable health insurance status, 5 percent gained coverage again but 9 percent remain without health insurance coverage.
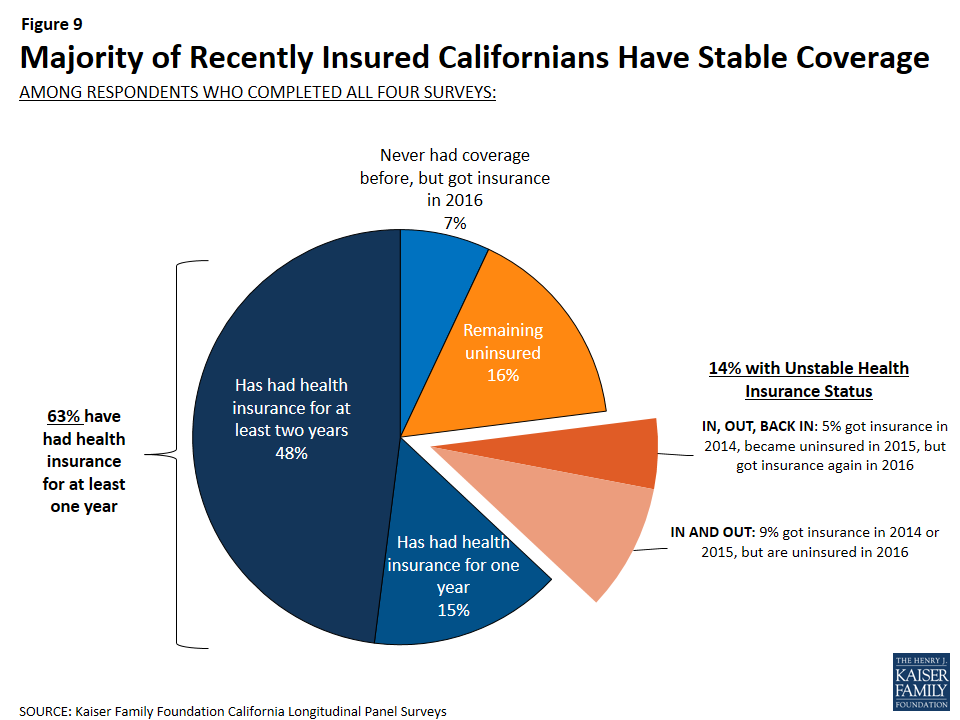
Figure 9: Majority of Recently Insured Californians Have Stable Coverage