Data Note: Estimated Medicaid Savings in the House Budget Resolution from March 2016
As the 115th Congress starts the session, GOP members of Congress are moving to repeal the Affordable Care Act (ACA) and are likely to consider proposals to restrict and fundamentally restructure Medicaid financing. While the current Budget Resolution under consideration will set the framework for a repeal of the ACA, the Budget Resolution that passed in March 2016 provides insight into other Medicaid cuts that could be considered by Congress later this year. This Data Note examines proposed reductions in federal Medicaid funding under the March 2016 House Budget Resolution.
March 2016 House Budget Resolution
The House Budget Resolution passed in March 2016 called for the repeal of the ACA and other reductions in federal spending for Medicaid. The Budget Resolution called for a transition to State Flexibility Funds, or a block grant for Medicaid. However, subsequent language in the Budget Report indicated that states could choose between a single lump sum (block grant) or a per capita-cap methodology. The report language suggests that both options (block grant and per-capita cap) would be tied to additional state flexibility to administer their programs, but the block grant option would grant states sole discretion over eligibility requirements, benefits, and provider reimbursement rates while there would be some minimum eligibility requirements under the per-capita option (with additional flexibility to set benefits or coverage type).
Analysis of the budget implications show that the combination of the ACA repeal and the spending caps could result in reductions in federal funding for Medicaid of $2.1 trillion over the 2017-2026 period or 41% compared to CBO projections for current law from the January 2016 baseline. These estimates use the reductions in Medicaid and Other Health figures specified in the House Budget Resolution Summary Tables that total $1.028 trillion over the 10 year period. In addition to Medicaid cuts, the Budget Resolution also called for a repeal of the ACA. The summary tables do not allocate the Medicaid share of the cuts tied to the ACA repeal. For these estimates, we use the Medicaid estimates from the March 2016 CBO Estimates from the Federal Subsidies for Health Insurance Coverage for People Under Age 65: 2016 to 2026. This report estimates direct Medicaid spending of $1.063 trillion from the coverage provisions of the ACA over the 2017-2026 period which could be eliminated under repeal. (Table 1 and Figure 1)
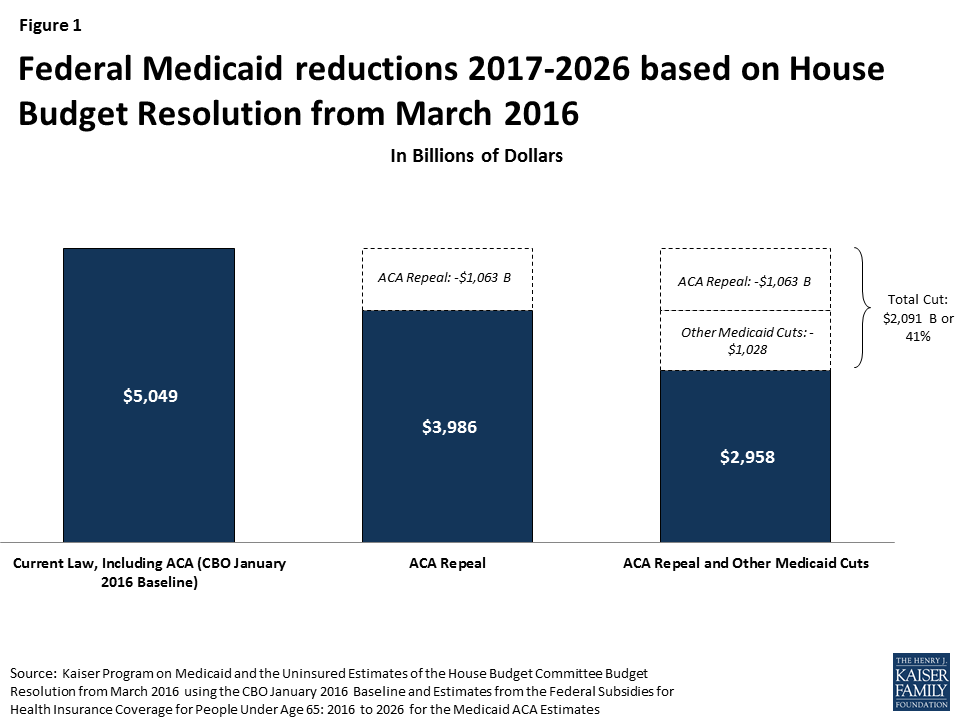
Figure 1: Federal Medicaid reductions 2017-2026 based on House Budget Resolution from March 2016
When fully implemented in 2026, cuts from the ACA repeal together with the Medicaid caps could result in a reduction of nearly 50% from projected federal Medicaid spending in that year. If the ACA expansion is not considered, the caps alone would reduce federal Medicaid funding by $169 billion or one-third from projected non-ACA Medicaid spending in 2026. (Table 1 and Figure 2)
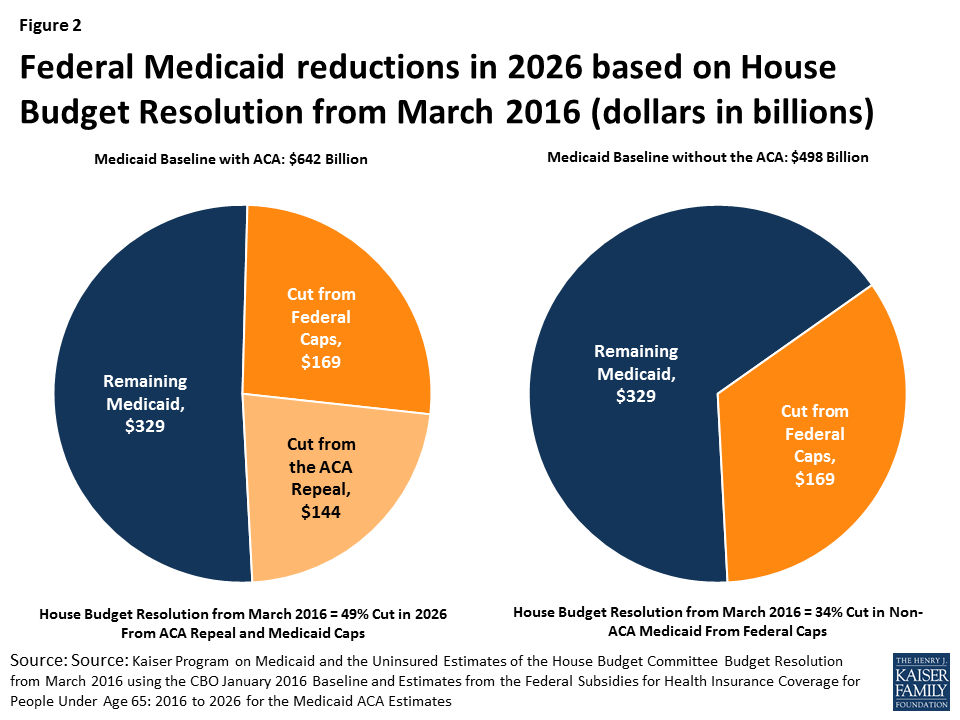
Figure 2: Federal Medicaid reductions in 2026 based on House Budget Resolution from March 2016 (dollars in billions)
| Table 1: House Budget Resolution March 2016: Implications for Medicaid (in billions of dollars) | ||||||||||||
| 2017 | 2018 | 2019 | 2020 | 2021 | 2022 | 2023 | 2024 | 2025 | 2026 |
10 Year:
2017-2026
|
||
| CBO Baseline January 2016 | 401 | 420 | 439 | 460 | 484 | 509 | 536 | 564 | 593 | 642 | 5,049 | |
| CBO March 2016 ACA Baseline | 78 | 81 | 85 | 91 | 100 | 108 | 116 | 125 | 134 | 144 | 1,063 | |
| Traditional Medicaid (Non-ACA) Baseline | 323 | 339 | 354 | 369 | 384 | 401 | 420 | 439 | 459 | 498 | 3,986 | |
| ACA Repeal | (78) | (81) | (85) | (91) | (100) | (108) | (116) | (125) | (134) | (144) | (1,063) | |
| Medicaid/Other Health Reductions | (7) | (67) | (82) | (88) | (97) | (109) | (121) | (135) | (151) | (169) | (1,028) | |
| Total Reductions | (85) | (148) | (167) | (179) | (197) | (217) | (237) | (260) | (285) | (313) | (2,091) | |
| – | ||||||||||||
| % Non ACA Reduction | -2% | -20% | -23% | -24% | -25% | -27% | -29% | -31% | -33% | -34% | -26% | |
| % Total Reduction | -21% | -35% | -38% | -39% | -41% | -43% | -44% | -46% | -48% | -49% | -41% | |
| SOURCE: Kaiser Program on Medicaid and the Uninsured Estimates of the House Budget Committee Budget Resolution from March 2016 using the CBO January 2016 Baseline and Estimates from the Federal Subsidies for Health Insurance Coverage for People Under Age 65: 2016 to 2026 for the Medicaid ACA Estimates | ||||||||||||
KFF analysis of the House Republican Budget Plan in 2012 showed that reductions of a similar magnitude could result in enrollment reductions of 42 to 50% and could have significant implications for provider payments. These estimates assume that states would not increase state spending to offset the federal spending cuts. In the upcoming debate, the implications for Medicaid enrollees, states and providers will depend on the details of an ACA replacement plan, if states are able to maintain ACA Medicaid expansion funding (like in A Better Way Proposal), the targeted level of savings tied to Medicaid cap proposals and what changes are included in federal program rules and options for the states.