Do Health Plan Enrollees have Enough Money to Pay Cost Sharing?
This brief looks at the extent to which people have enough savings to meet the cost sharing requirements under private health insurance policies, which have risen substantially in recent years.
The amount of cost sharing in private and public insurance arrangements has been a key area of discussion in recent years and particularly during the recent debate over repealing and replacing the Affordable Care Act (ACA). The group market has seen meaningful increases in deductibles over the past few years, and worker payments for cost sharing have increased steadily. In the nongroup market, where cost sharing has always been relatively high, the substantial deductibles and other cost sharing have raised concerns about affordability. Cost sharing in nongroup plans was a major point of emphasis during the repeal and replace debate this summer and fall, where several leading proposals would have ended the cost sharing subsidies currently available to lower income enrollees while permitting states to use a portion of new market stability funds to reduce enrollee out of pocket costs. Other proposals would have expanded the use of health savings accounts, which permit individuals with high-deductible health plans to pay out-of-pocket costs with tax-preferred funds.
Deductibles and other cost sharing play a significant role in health insurance plans. Deductibles and copayments, by shifting a portion of the cost of care to those using services, reduce premiums by reducing the share of costs funded by insurance. More importantly, requiring consumers to directly pay out-of-pocket for a portion of the cost of services encourages them to more carefully consider the need for services and, depending on how the cost sharing is structured, can encourage consumers to use lower cost providers and service options. These dynamics lower the amount of health care that people get, reducing premiums but also in some cases discouraging people from needed and beneficial care.
As cost sharing levels have risen, consideration of the affordability of health insurance has necessarily broadened beyond looking at premiums to include the financial burden placed on enrollees by high cost- sharing requirements. Particularly for those in low and moderate income families, the cost sharing in private plans may make it difficult for them to have access to the services covered under their plans. Recent coverage expansions under the ACA, which has expanded private insurance coverage to millions of lower and moderate income people, incorporated significant public subsidies to reduce cost sharing for enrollees with incomes below two and a half times the poverty level.
While people might expect to pay premiums and small copayments from their current income, cost sharing for costly medical events may need to be funded from savings or through borrowing. Deductibles for employer plans with deductibles averaged over $2,000 in small firms and almost $1,300 in large firms in 2016 and 2017. In the nongroup market, deductibles in silver plans (not including reductions through cost-sharing subsidies) averaged over $3,000 in both 2016 and 2017 with many silver and bronze plans having deductibles exceeding $5,000 or $6,000. Coinsurance and other cost sharing can increase out-of-pocket liabilities considerably: the maximum out-of-pocket limits for in-network services in most private plans was $7,150 for single plans and $14,300 for family coverage in 2017. Some households may incur higher spending on out-of-network services or those not included as an essential health benefit.
These amounts can stress the finances of many families. In order to evaluate the affordability of different cost-sharing levels for different types of households we used information from the 2016 Survey of Consumer Finances to look at the asset of households and their potential ability to meet different levels of cost sharing. The Figures below show the percentage of singe-person and multi-person households that could meet an array of cost sharing amounts ($1,000 through $15,000) with their liquid or net financial assets. In the text, we focus on two levels: $2,000 for single-person households and $4,000 for multi-person households, amounts that are now not uncommon in employer-based plans; and a higher level of $6,000 for single persons households and $12,000 for multi-person households. These upper level amounts were a little less than the maximum out-of-pocket limits for private insurance in 2016 of $6,850 for single coverage and $13,700 for family coverage. We use 2016 levels because the data on assets is for that year.
As discussed below, we find that less than half of non-elderly, one-person households could pay $2,000 toward cost sharing from current liquid assets, while only about a third could pay $6,000. These percentages vary considerably by income and are much higher for households with incomes 400% of poverty or more and much lower for households with incomes below 150% of poverty.
Defining Assets
The Survey of Consumer Finances (SCF) is a triennial, nationally representative household survey conducted by the Federal Reserve Board. The 2016 SCF provides a snapshot of household finances, including detailed information on households’ debts, assets, income and other characteristics, including the types of health insurance present in the household.1 Using this information, we developed two measures of resources that households may have to meet health insurance cost sharing2. The measures used here could be considered conservative because they assume that a household can bring a large share of its saved resources to bear to pay one-year’s cost sharing.
- The first category is liquid financial assets, which are those most easily converted to cash. The category includes checking and saving accounts, money market accounts, certificates of deposit, savings bonds, non-retirement mutual funds, stocks and bonds, but excludes the value of dedicated retirement accounts (such as 401k accounts) and the cash value of life insurance.
- The second category is net financial assets, which is a broader measure of the household’s total resources. This category includes all financial assets, including assets dedicated to retirement, reduced by the household’s unsecured debts. For this measure, the value of assets is reduced by credit-card debt and other unsecured loans, but debts secured by real property (such as mortgage debt) and loans for vehicles and education are not counted against assets. This category measures how much money a household has to pay medical expenses after meeting debt obligations, although the money may not in all cases be easily accessible.
Generally, liquid financial assets are a few percentage points higher than net financial assets at any given level of income. For simplicity, we present the analysis using liquid financial assets; we include comparable charts with net financial assets in Appendix 2.
We assume that households pay premiums out of current income, but that they may need to use savings or other assets if they become seriously ill in order to meet the deductible. For more information see the Methods Section. The SCF defines a family as a “primary economic unit (PEU),” or all of the individuals living in a household who are financially interdependent with the dominant individual or couple.3 Income and assets are measured for the PEU in the household. The definitions of the different types of assets and debts are available [here] and [here].
Cost-sharing in private insurance may take several forms; enrollees are often required to meet a deductible or an annual spending amount before the plan covers most services. In most cases enrollees must pay a portion of the cost of care at the point of service, either as a set amount (copayment) or a percent of the cost (coinsurance). Private insurance plans, under requirements included in the ACA, include an out-of-pocket limit, or a maximum amount that a household must pay out of pocket for in-network care each year. Deductibles and out-of-pocket limits are lower in single plans than in family plans.
In this analysis, we first look at the median levels of assets of non-elderly families. We look at median assets because the averages are significantly affected by the much larger levels of assets in a small number of higher income families (see Appendix 1). We next look at the percentage of households with sufficient assets to meet different levels of out-of-pocket costs. Because cost-sharing requirements are higher in family plans than in single plans, we show results separately for one-person households and households with more than one person.
Our approach here is actually a conservative look at affordability because it assumes that all of a household’s assets are available to meet cost-sharing obligations in the current year. This assumption leaves households with no additional assets for savings or to meet other emergencies, and does not account for the fact that high out-of-pocket medical costs may continue for more than one year.
Household Asset Levels and Cost-Sharing Requirements
Among nonelderly households, the median level of liquid assets in 2016 was about $2,500 for single-person households and $5,000 for households with more than one person (Figure 1). This means that one-half of single-person households could only contribute $2,500 from their liquid assets to pay for cost sharing, and that one-half of multi-person households could contribute $5,000. These amounts were below the cost sharing requirements in many plans significantly below the maximum out-of-pocket limits allowed for private insurance in 2016 ($6,850 for single coverage and $13,700 for family coverage).
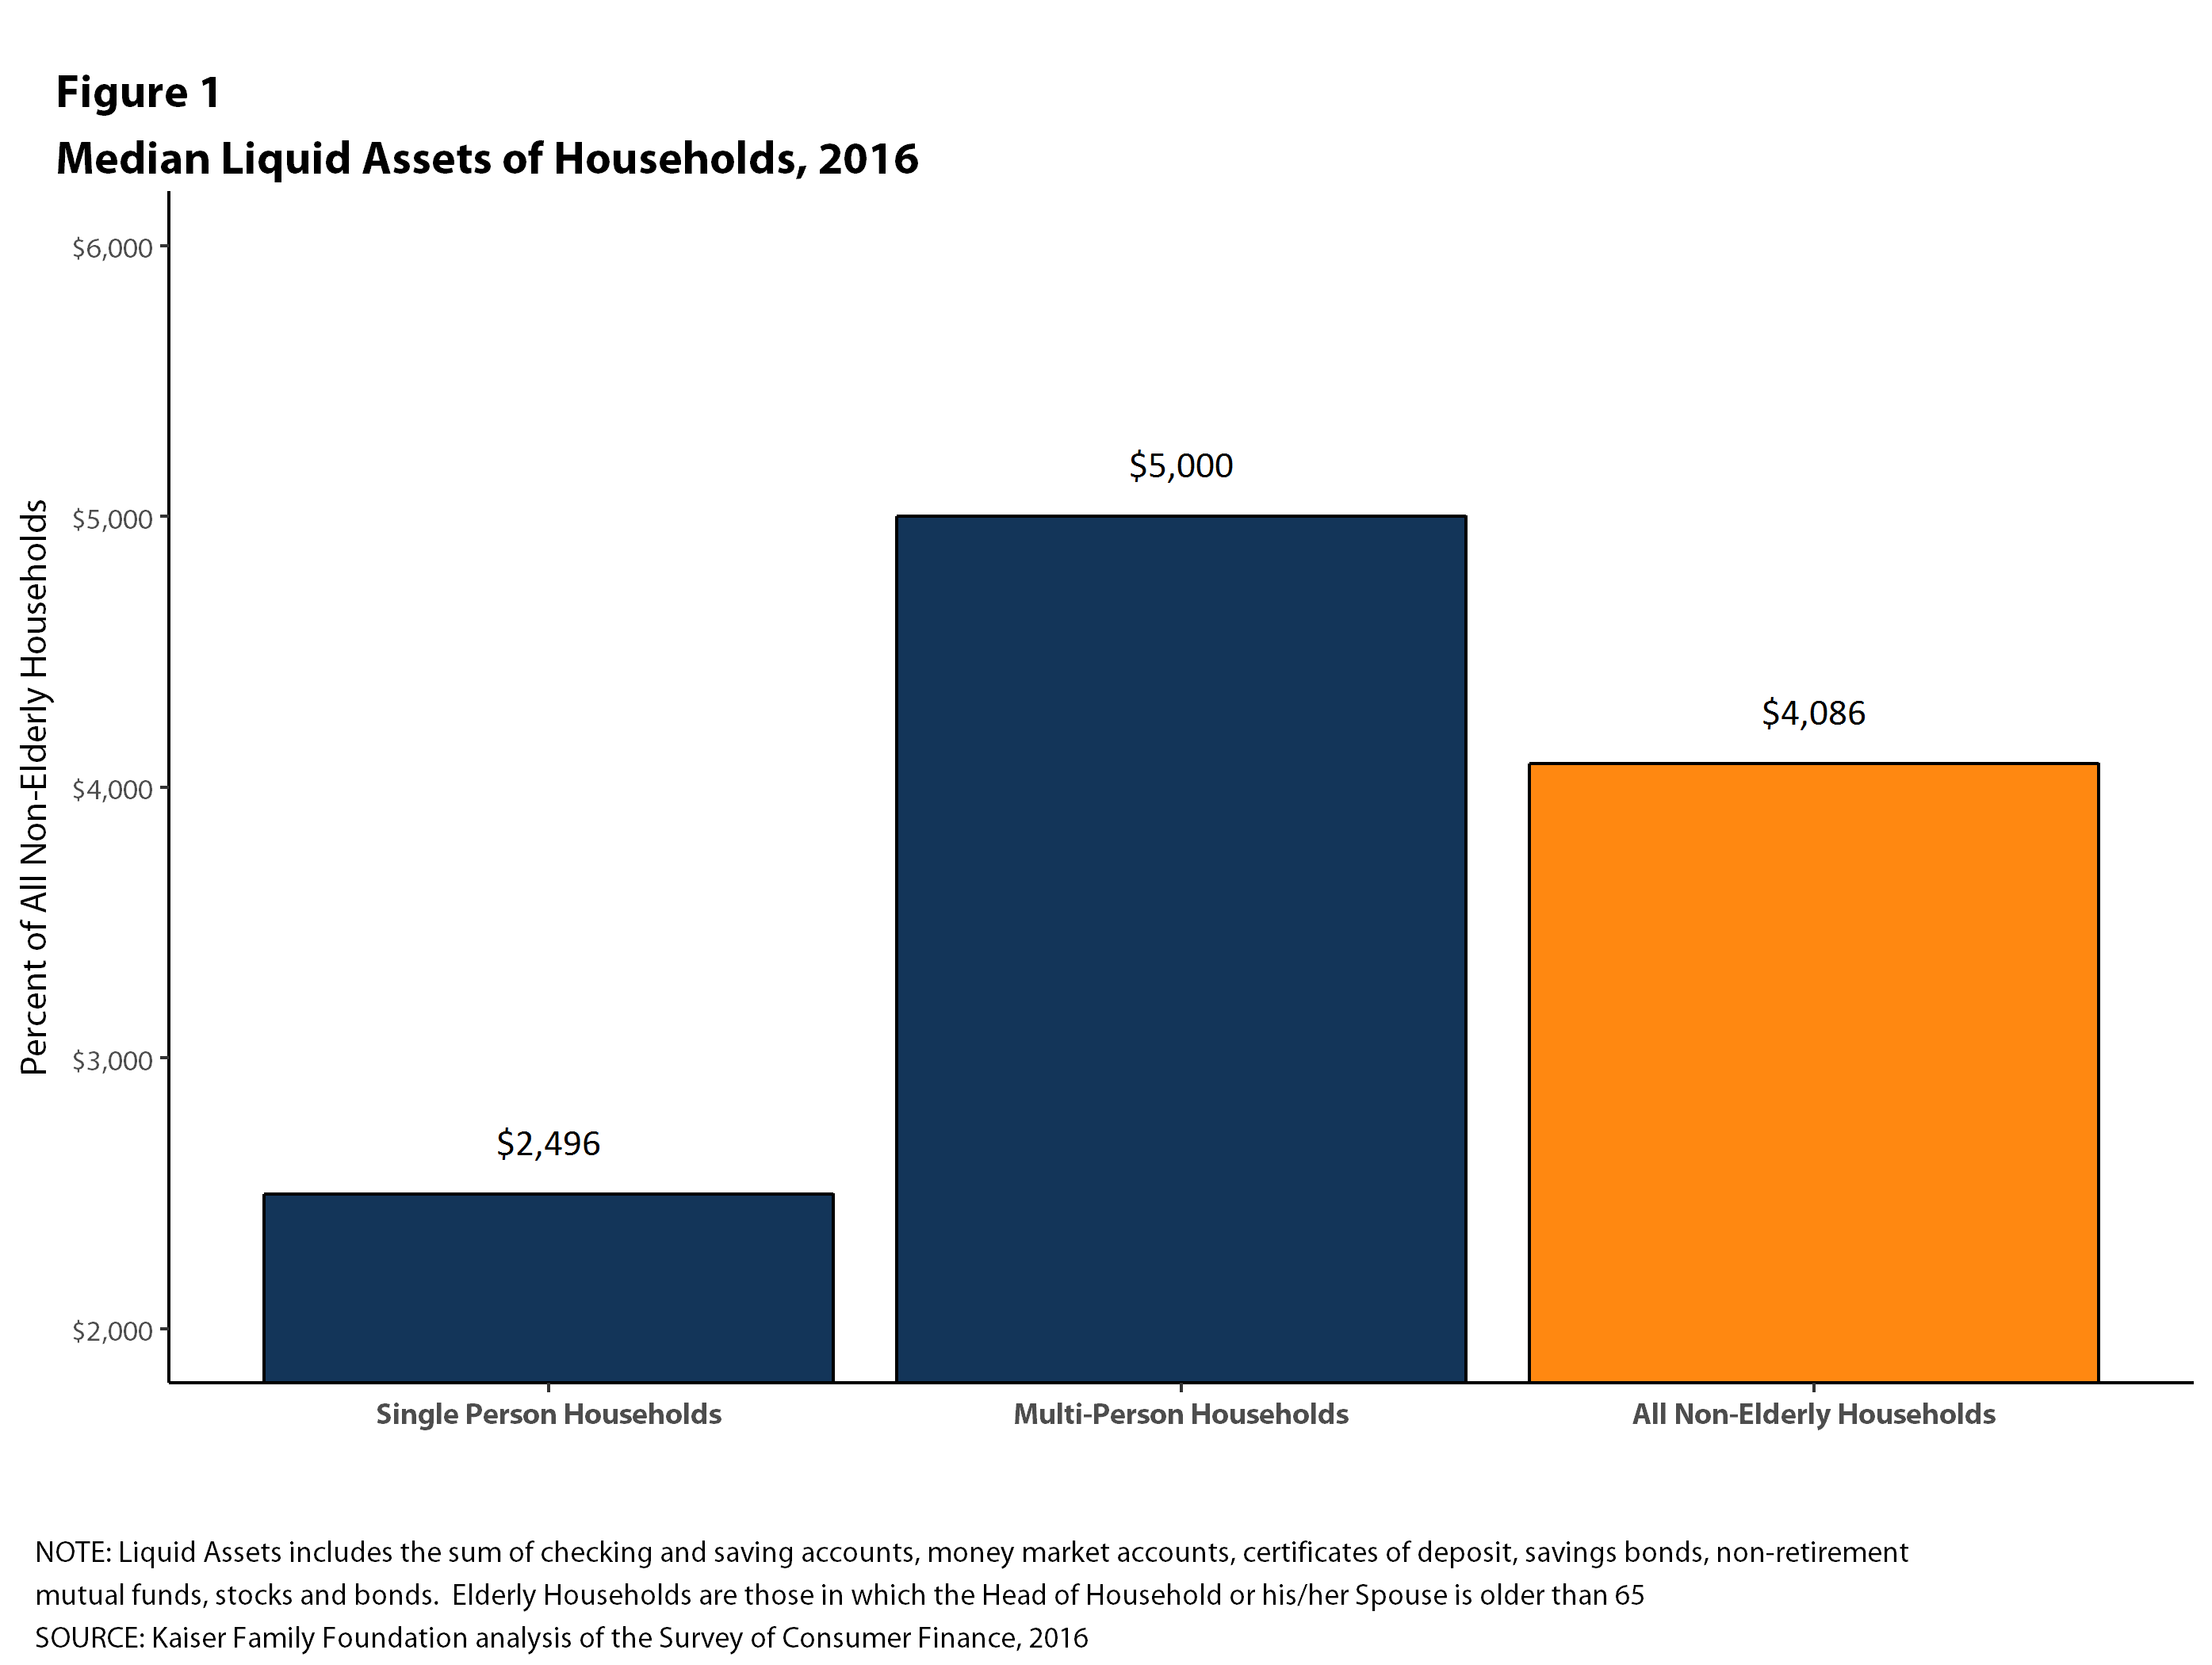
Figure 1: Median Liquid Assets of Households, 2016
Median asset levels vary tremendously with household income. Among single-person households, the median amount of liquid assets in households with incomes below 150% of poverty was less than $500 in 2016, compared to $1,902 for households with incomes between 150% and 400% of poverty, and $14,361 for families with incomes of 400% of poverty or more (Figure 2). Among multi-person households, the median amount of liquid assets in households with incomes below 150% of poverty was still less than $500 in 2016, compared to $2,811 for households with incomes between 150% and 400% of poverty, and $21,838 for families with incomes of 400% of poverty or more.
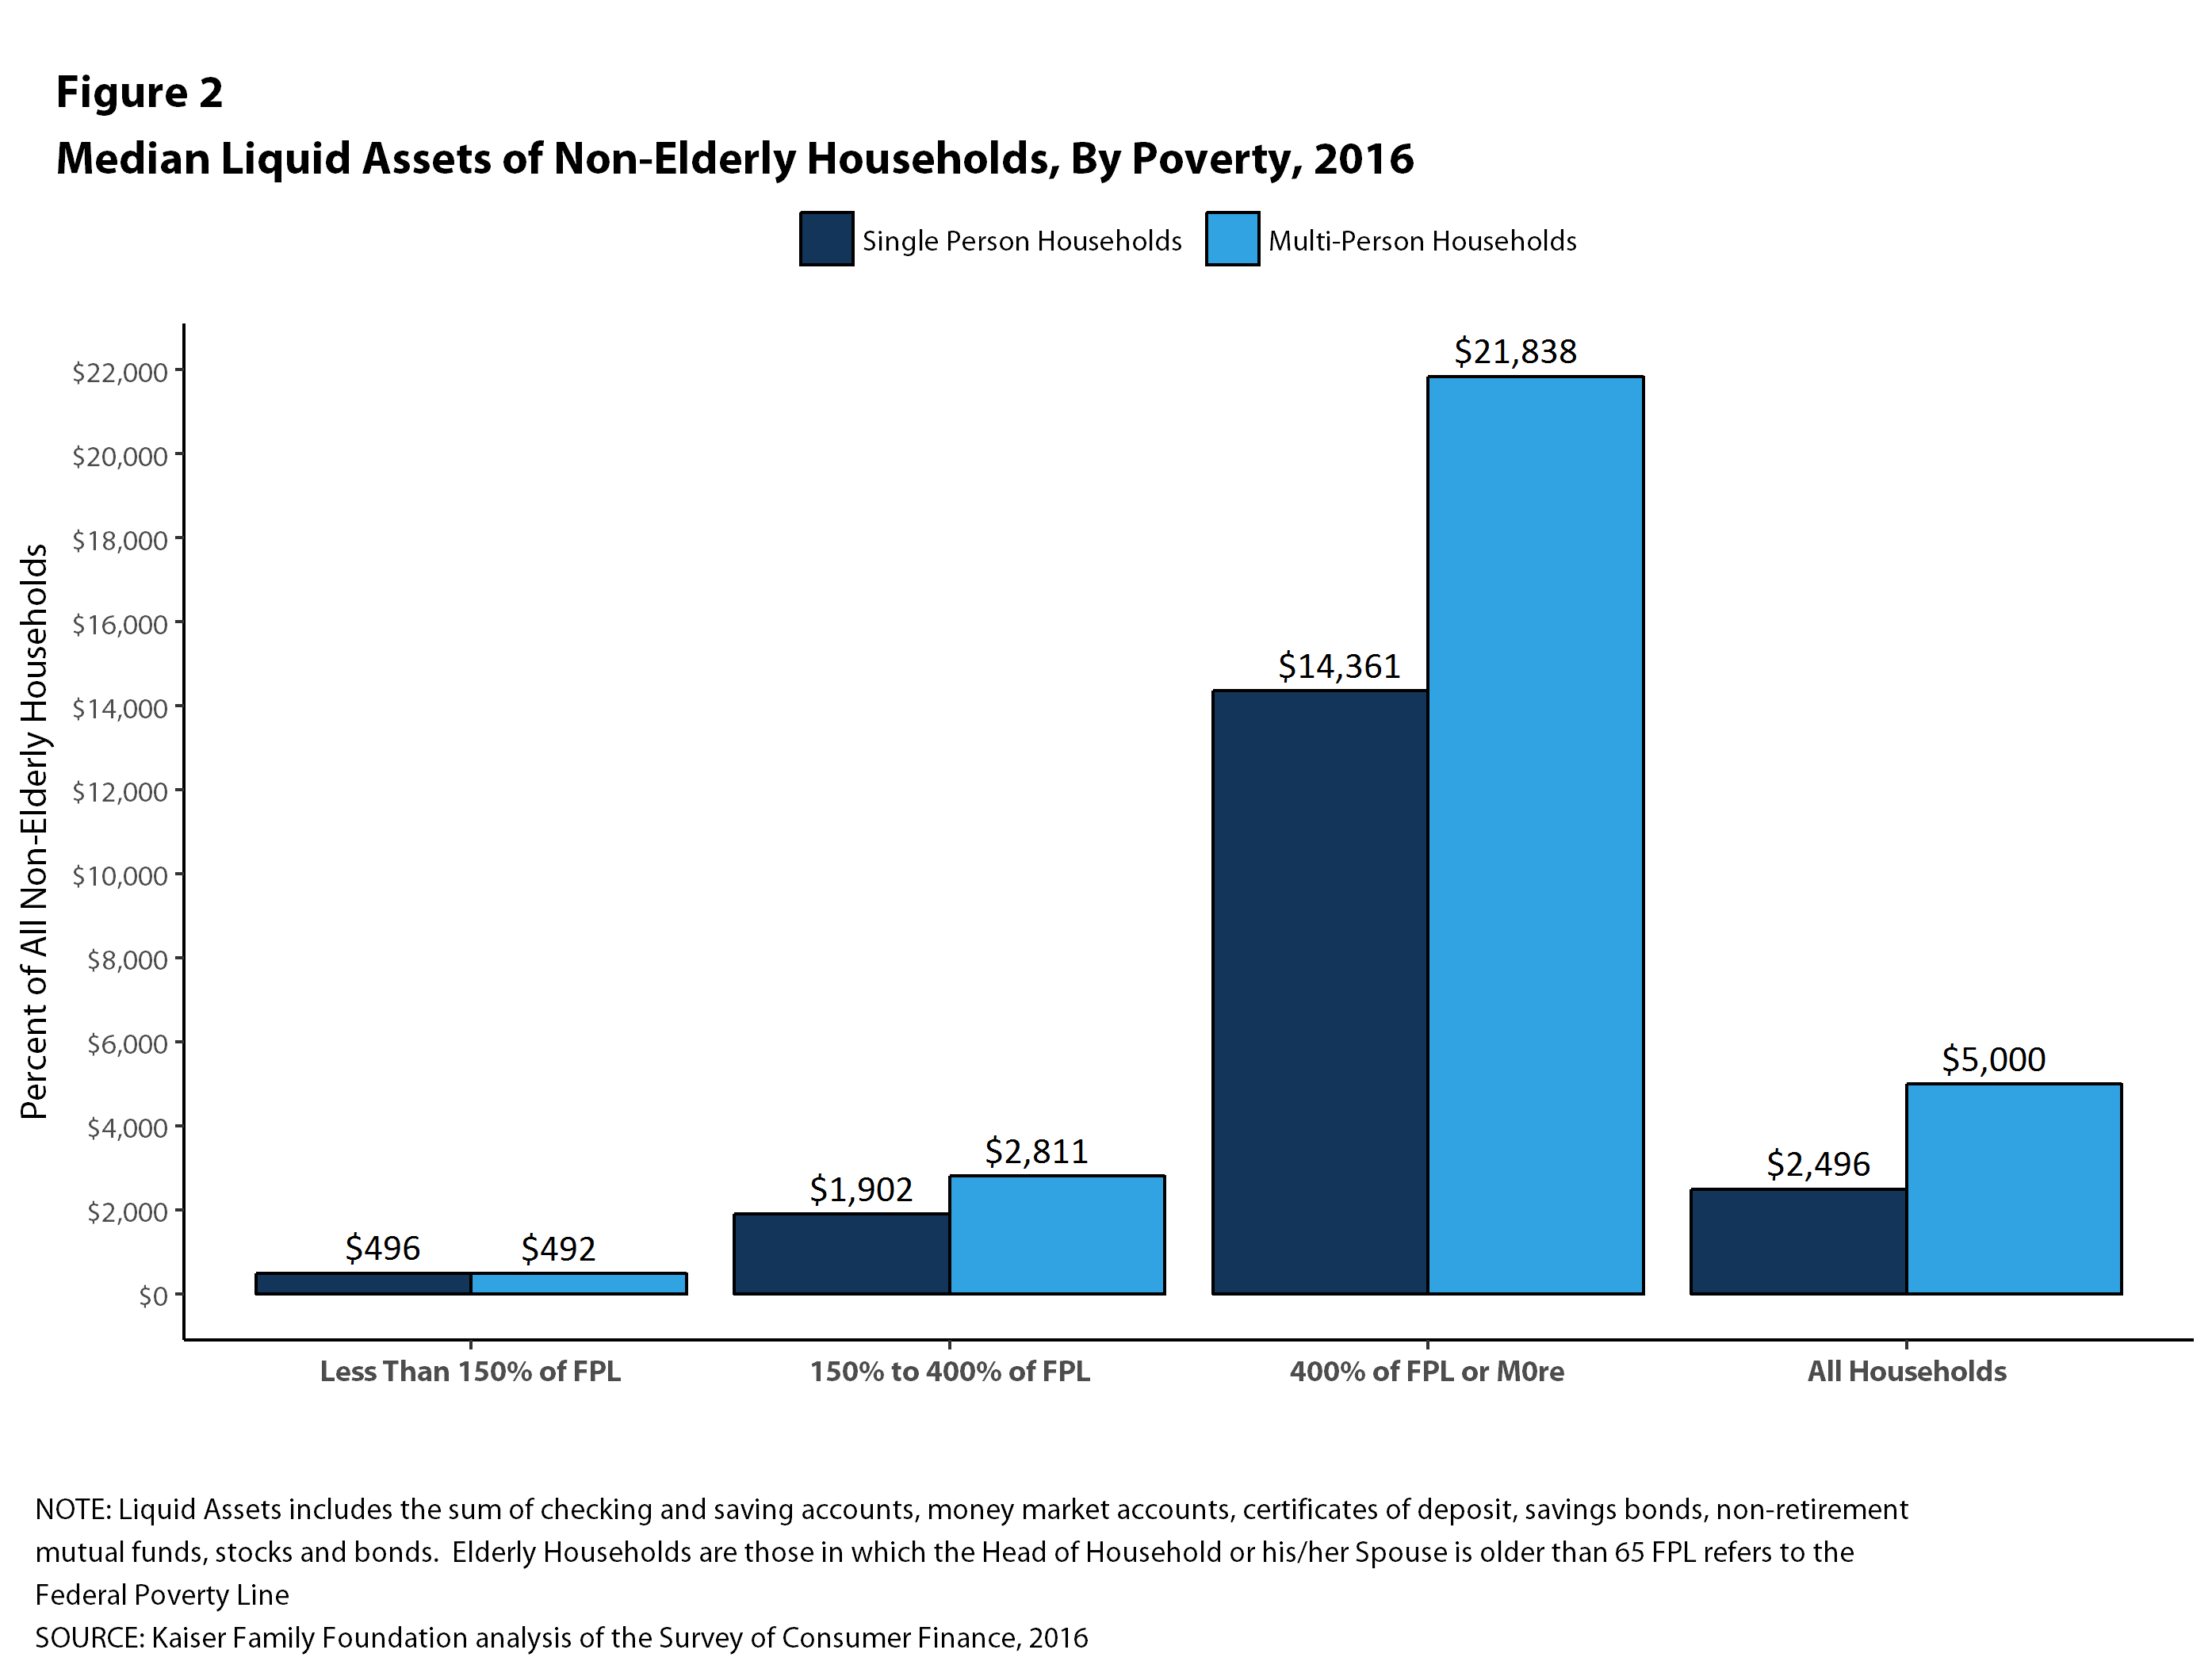
Figure 2: Median Liquid Assets of Non-Elderly Households, By Poverty, 2016
Figure 3 shows the distributions of households with sufficient liquid assets to meet different cost sharing amounts. About half (53%) of single-person nonelderly households could pay the $2,000 from their liquid assets towards cost sharing, and only 37% could pay $6,000, which as noted above was less than the maximum out-of-pocket limit for single coverage in 2016. For multi-person families, 47% could pay $4,000 from their liquid assets for cost sharing, while only 35% could pay $12,000.

Figure 3: Percent of Households with Liquid Assets in Excess of Certain Thresholds by Household Size, 2016
These percentages vary significantly with family income. Among single-person households, only 23% of households with incomes below 150% of poverty could pay $2,000 from their liquid assets for cost sharing, compared with 47% of households with incomes between 150% and 400% of poverty and 87% of households with incomes of 400% of poverty or more (Figure 4). At the higher level, only 12% of households with incomes below 150% of poverty could pay $6,000 from their liquid assets for cost sharing, compared with 29% of households with incomes between 150% and 400% of poverty and 69% of households with incomes of 400% of poverty or more.
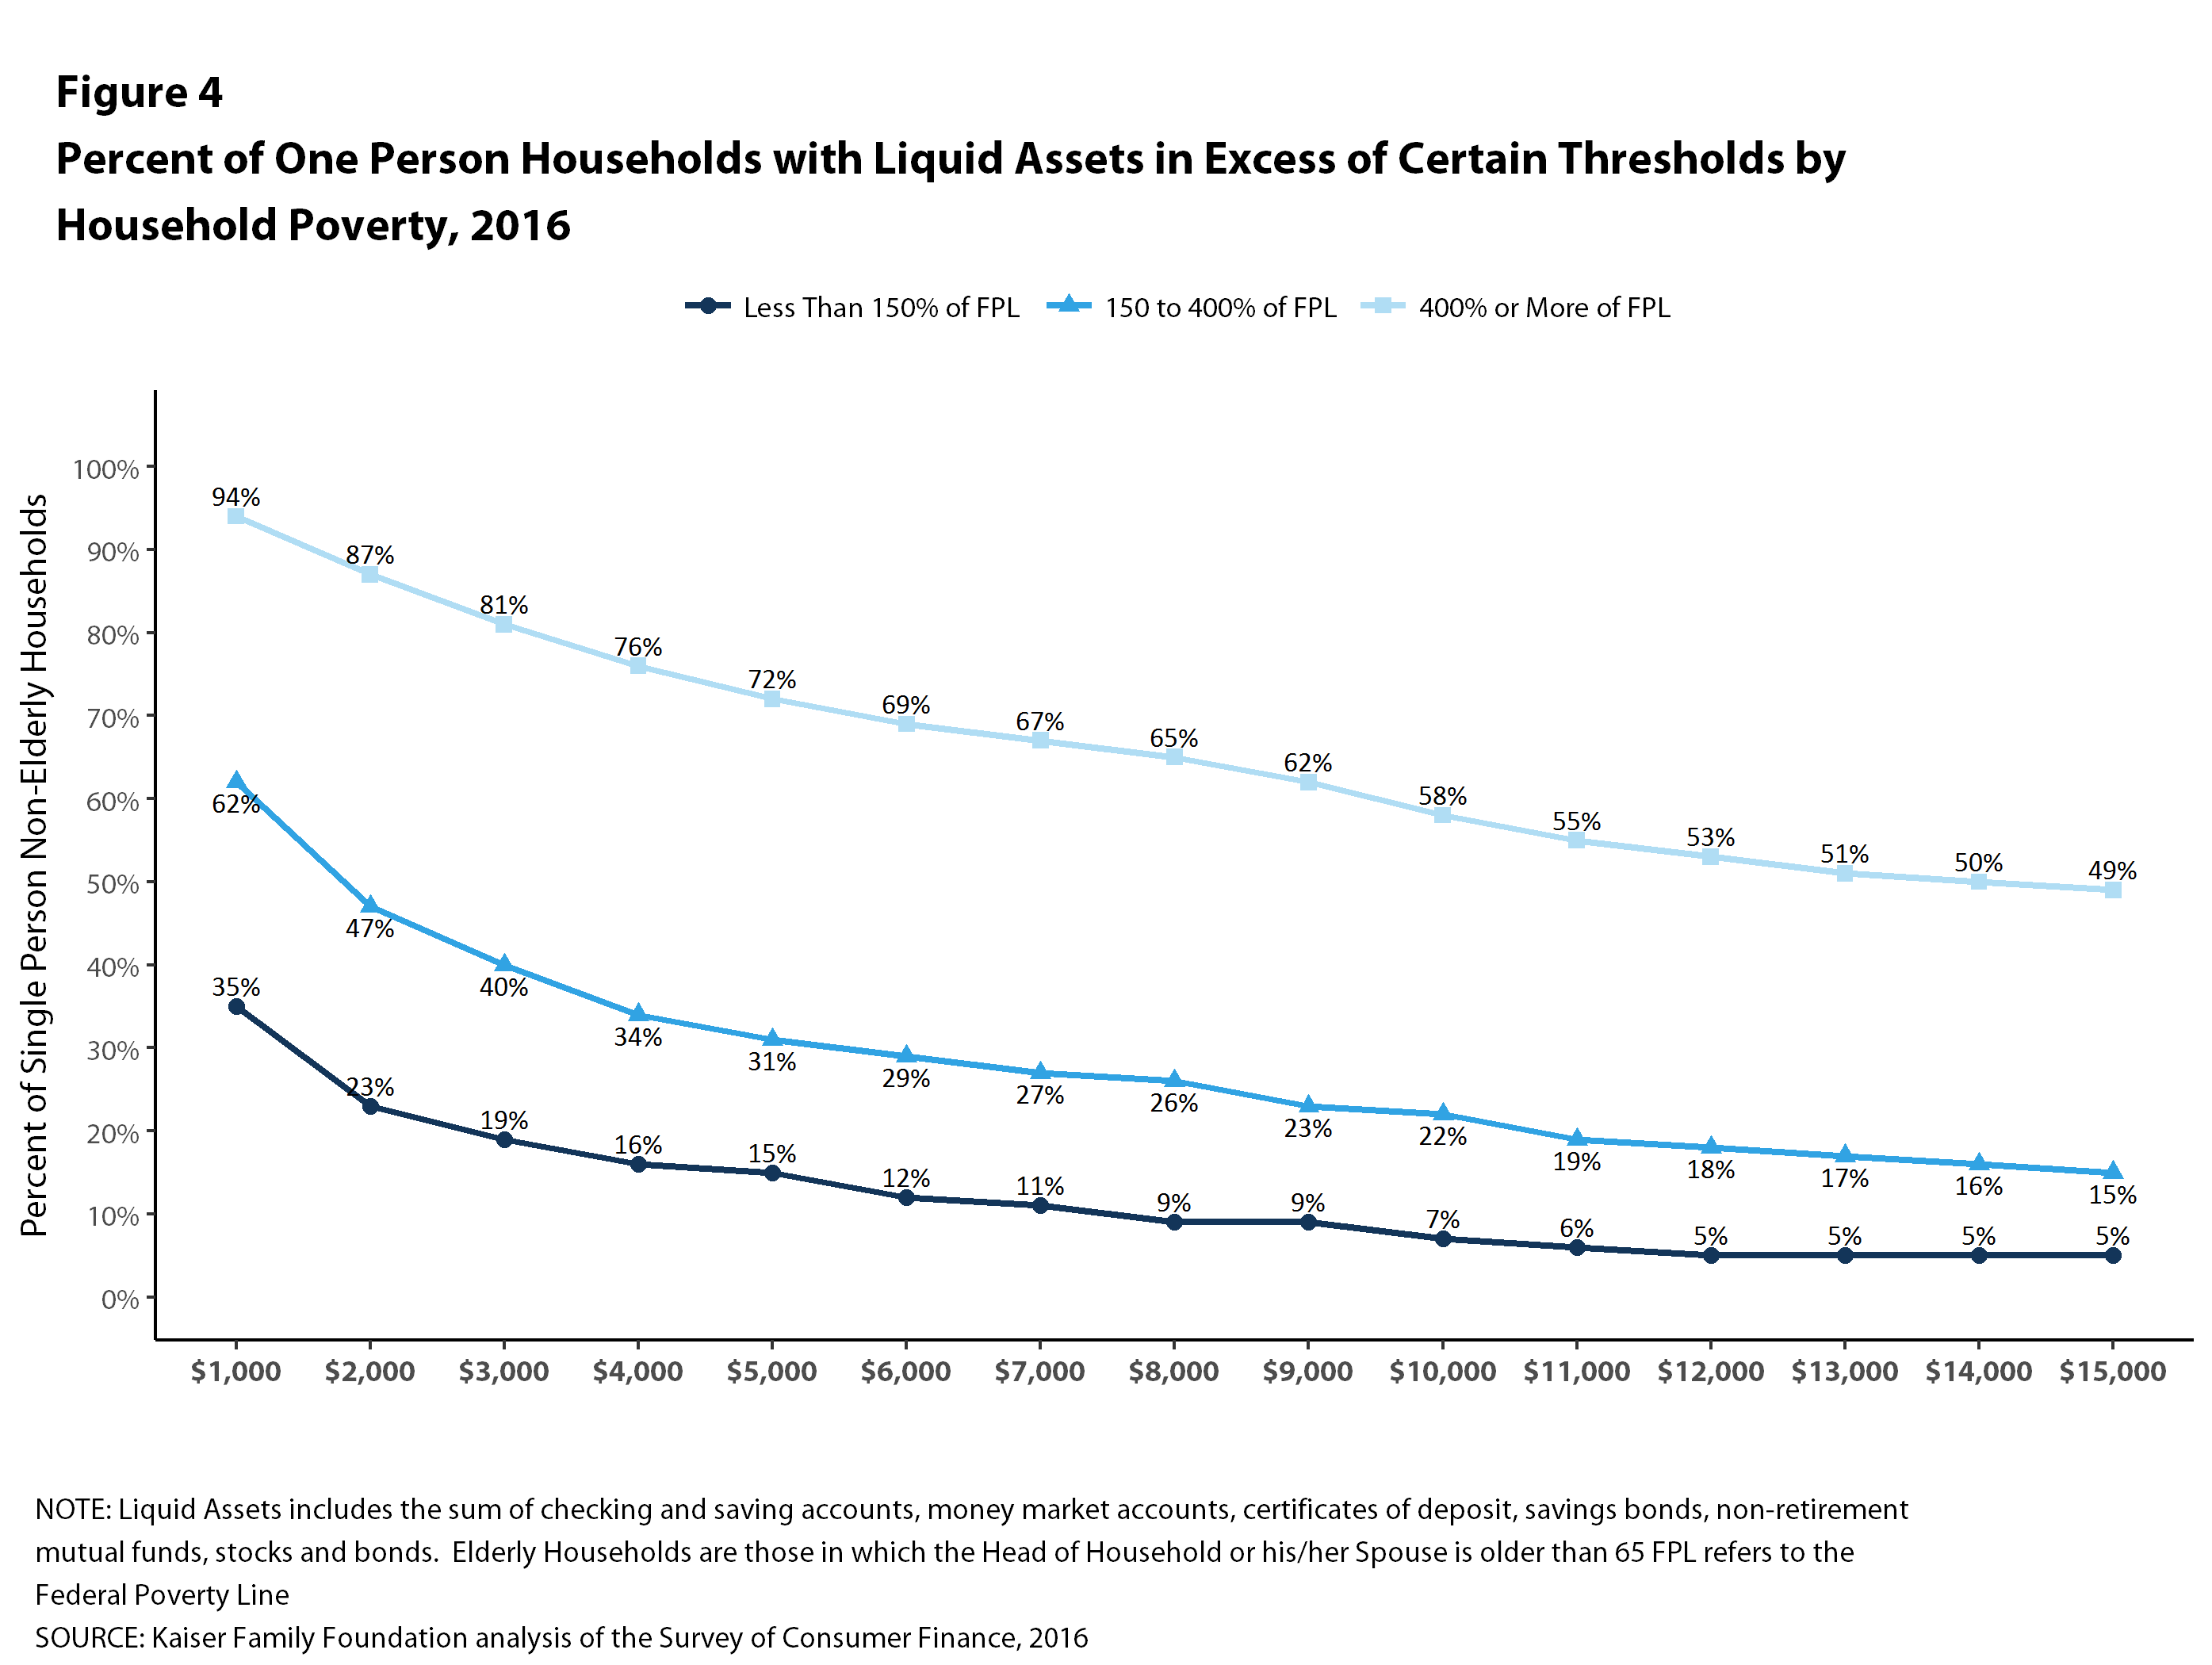
Figure 4: Percent of One Person Households with Liquid Assets in Excess of Certain Thresholds by Household Poverty, 2016
The picture is similar for multi-person families, where only 10% of households with incomes below 150% of poverty could pay $4,000 from their liquid assets for cost sharing, compared with 41% of households with incomes between 150% and 400% of poverty and 84% of households with incomes of 400% of poverty or more (Figure 5). At the higher level, only 4% of households with incomes below 150% of poverty could pay $12,000 from their liquid assets for cost sharing, compared with only 18% of households with incomes between 150% and 400% of poverty and 63% of households with incomes of 400% of poverty or more.
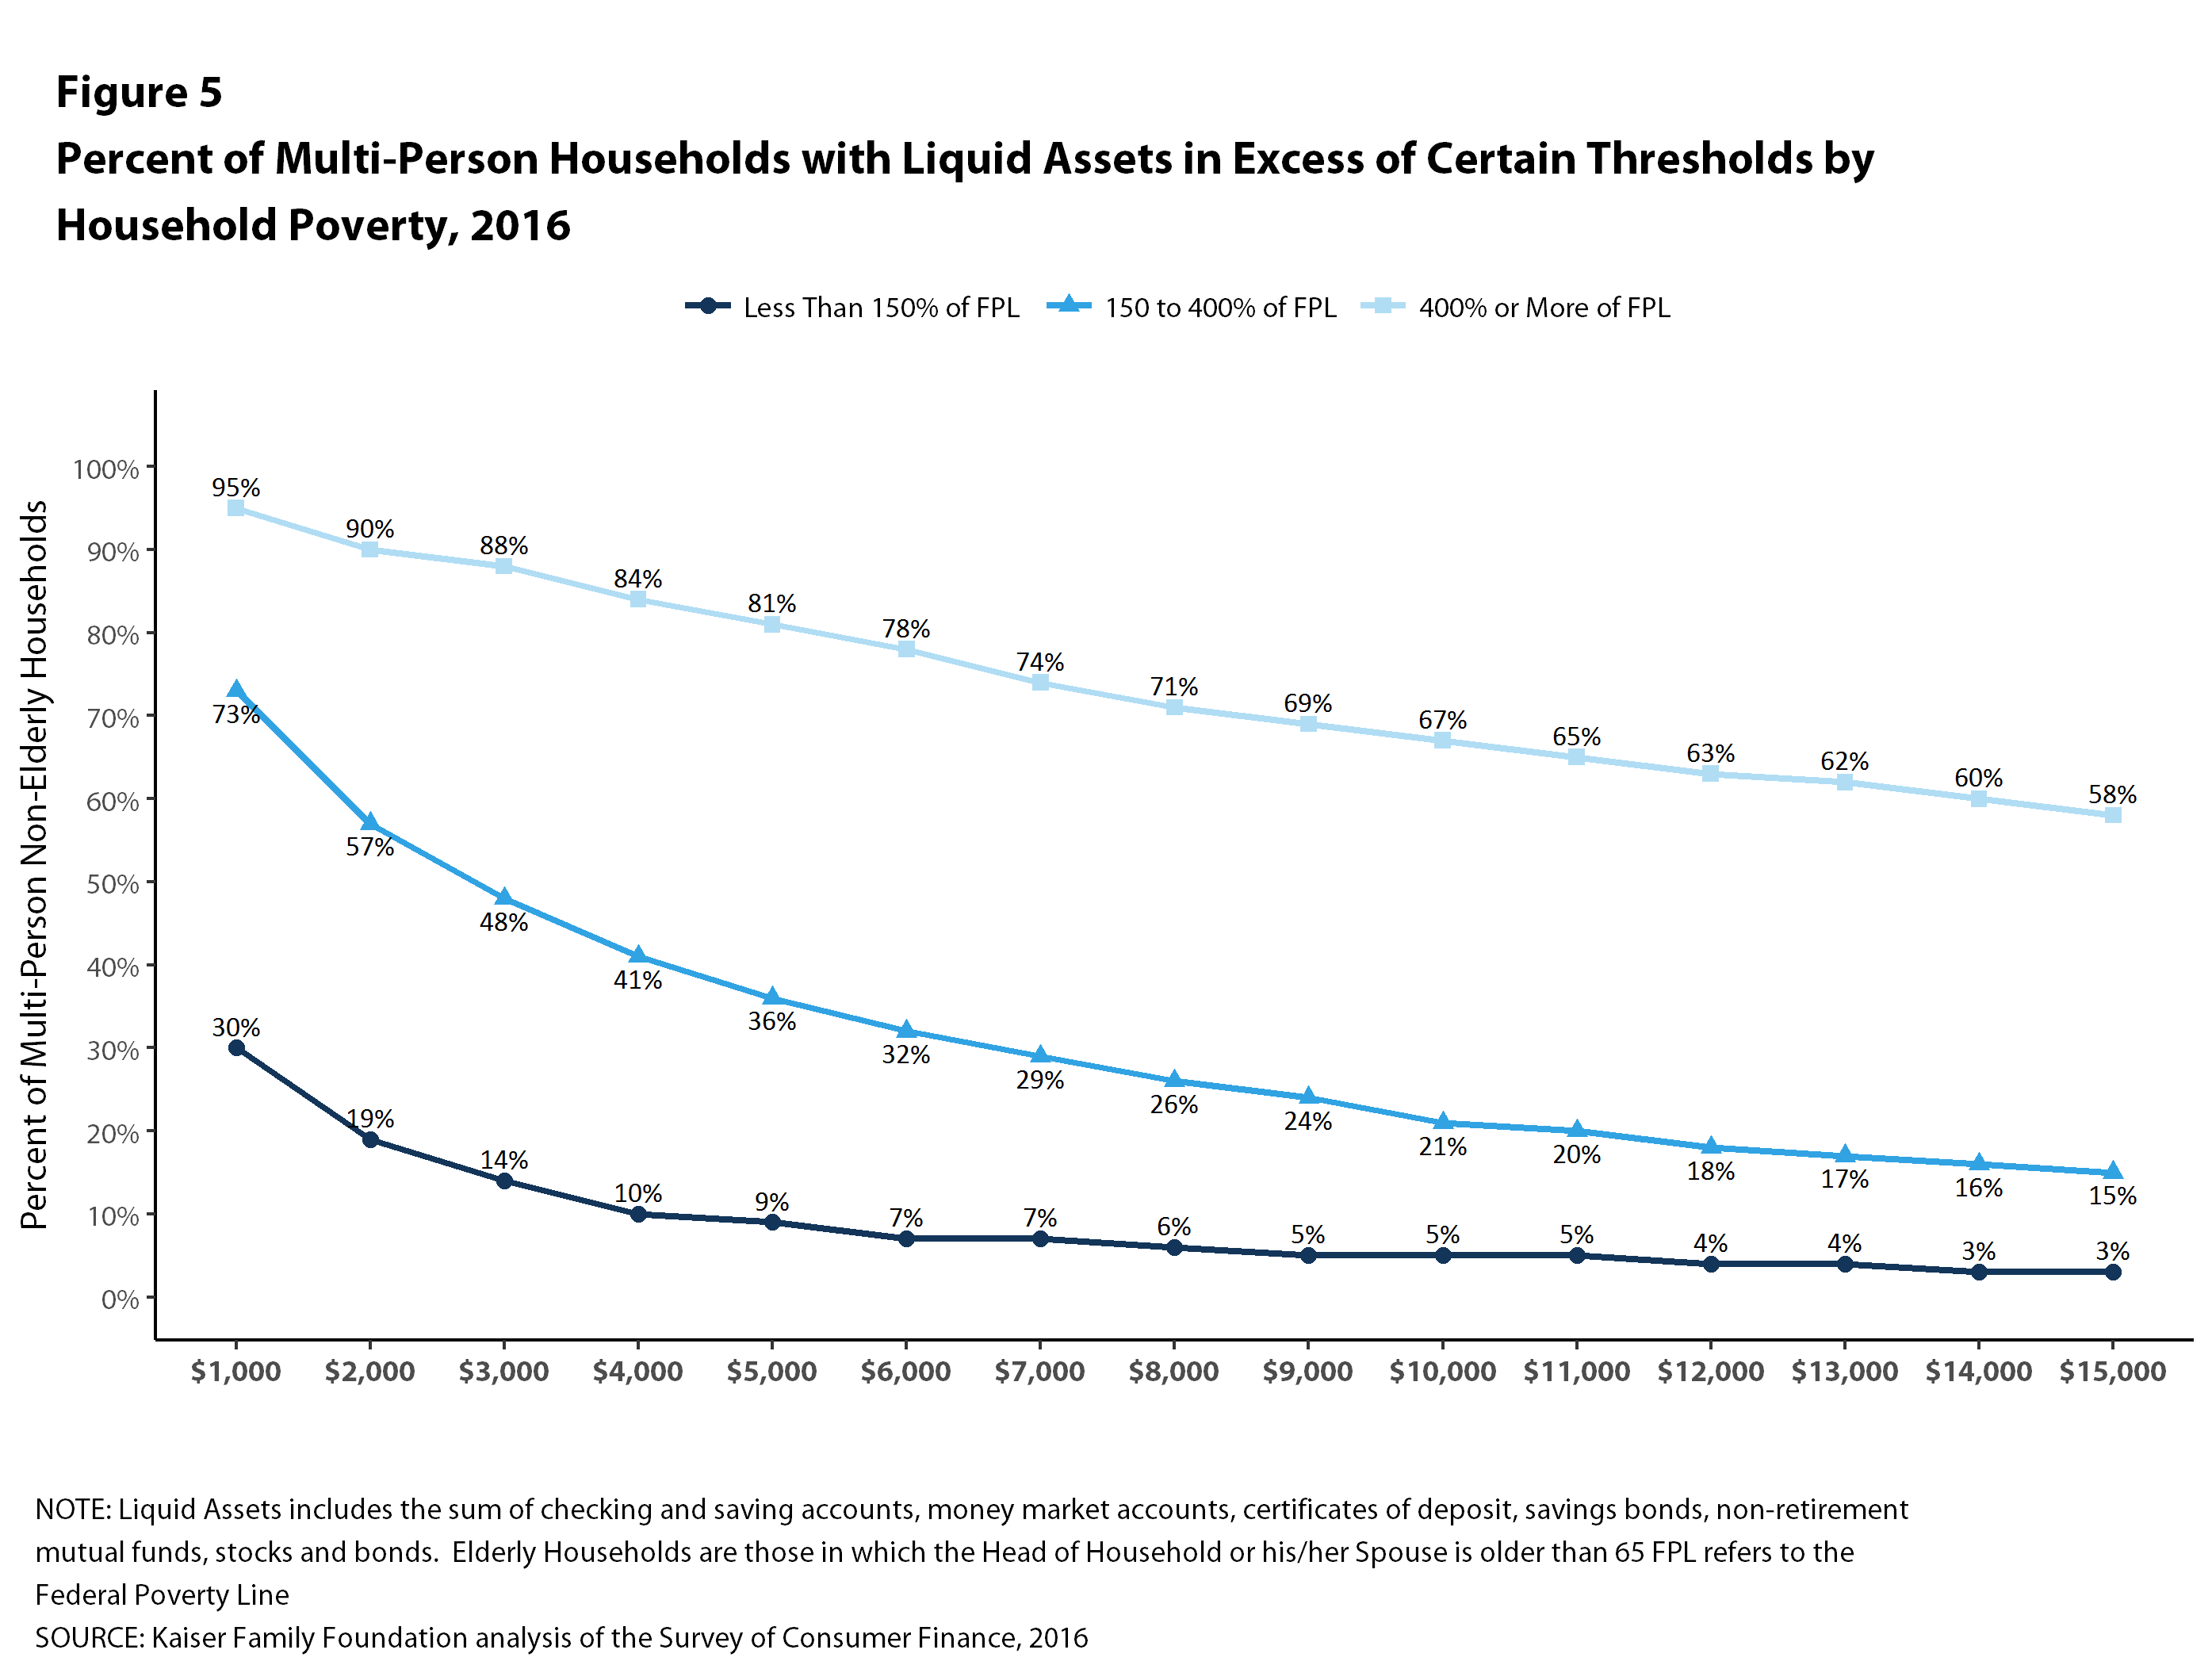
Figure 5: Percent of Multi-Person Households with Liquid Assets in Excess of Certain Thresholds by Household Poverty, 2016
Households with someone who is uninsured have particularly low levels of assets: among single-person households, 28% could pay $2,000 from liquid assets for cost sharing while only 14% could pay $6,000. Among multi-person families, 21% could pay $4,000 from liquid assets for cost sharing while only 9% could pay $12,000 (Figure 6).
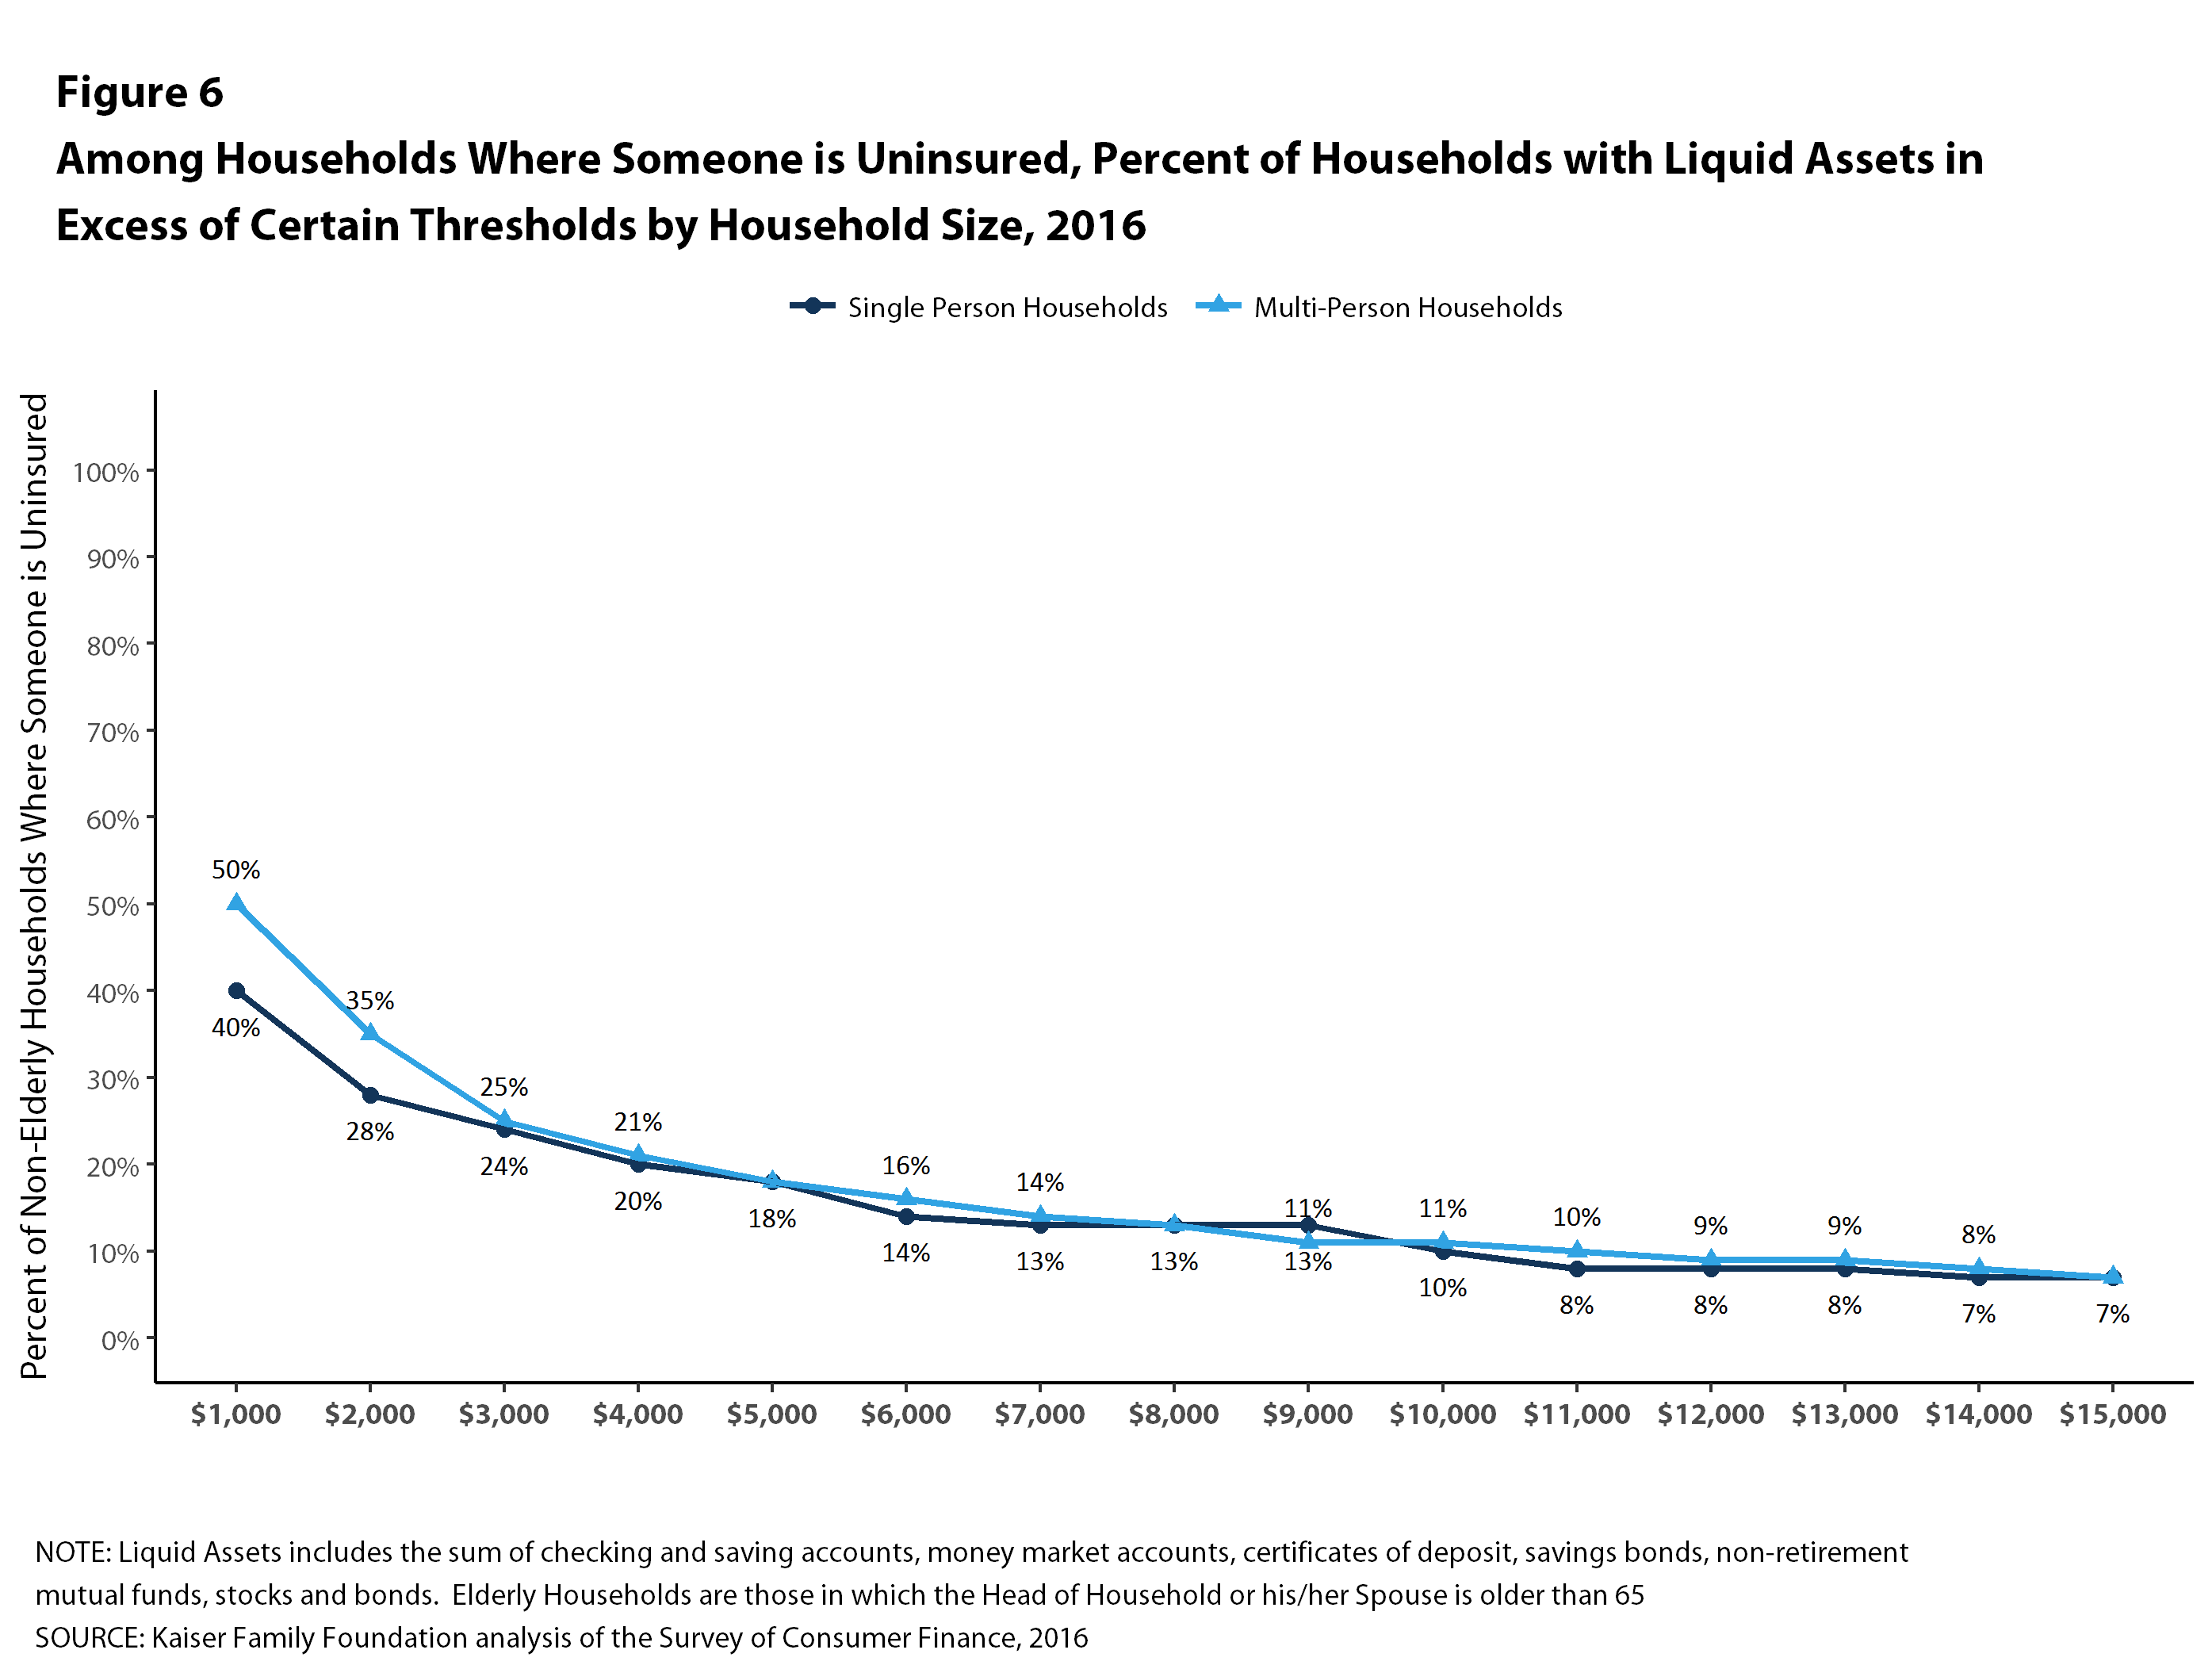
Figure 6: Among Households Where Someone is Uninsured, Percent of Households with Liquid Assets in Excess of Certain Thresholds by Household Size, 2016
Discussion
Many families lack the financial resources to meet the levels of cost sharing they may face in private health insurance policies. Not surprisingly, there are significant differences across the income spectrum, where, for example, 63% of multi-person households with incomes of 400% of poverty or more could pay $12,000 from liquid assets for cost sharing, compared with only 18% of households with incomes between 150% and 400% of poverty, and 4% of households with incomes below 150% of poverty.
Much of the discussion around affordability has centered on premium costs. A broader notion of affordability will have to focus on the ability of families, particularly low and moderate income families, to meet potentially high out-of-pocket expenses associated with a chronic or acute illness. One-half of multi-person households with incomes between 150% and 400% of poverty had less than $3,000 in liquid assets in 2016, which means that any significant illness could wipe out all their savings just to meet deductibles and other cost sharing. To adequately address the issue of affordability of health insurance, reform proposals should be evaluated on the affordability of out-of-pocket costs, especially for low and moderate income families, and be sensitive to the financial impacts that high cost sharing will have on financial wellbeing.
Methods
The 2016 Survey of Consumer Finances (SCF) is a triennial, nationally representative household survey conducted by the Federal Reserve Board. The survey has a dual frame, with respondents selected both from a national area probability design and a sample of households with high income tax returns.4 The 2016 SCF is the most current survey available and is based on 6,254 households.5 Weights were applied to ensure that percentages were representative of the population.
The SCF provides information about the types of insurance present in each household, and also about whether each member had coverage or not. Unlike financial characteristics, insurance questions are asked of all members of a household, including members that are not part of the PEU, which could be a relative who is financially independent or a financially independent nonrelative living in the household. This creates some potential ambiguity when we look at households in which someone has private coverage because it is possible that the only people with private coverage are not part of the PEU. Because we have information about whether or not each person in the household has some coverage or not, we were better able to target the members of the PEU in identifying households where someone was uninsured. We selected only households where the financially dominant individual, his or her spouse or partner, or his or her financially dependent children (regardless of the child’s age) were uninsured.